. 1997 May 13;94(10):5302-7.
doi: 10.1073/pnas.94.10.5302.

Acute leukemia with promyelocytic features in PML/RARalpha transgenic mice

Affiliations

Acute leukemia with promyelocytic features in PML/RARalpha transgenic mice

L Z He et al. Proc Natl Acad Sci U S A. .

Abstract

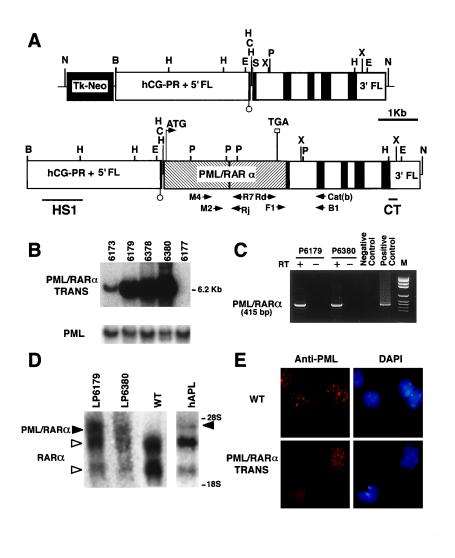
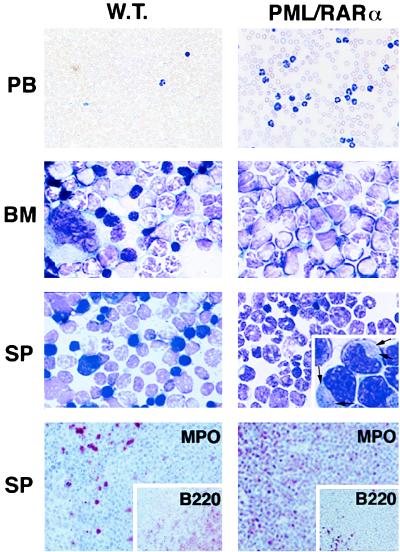
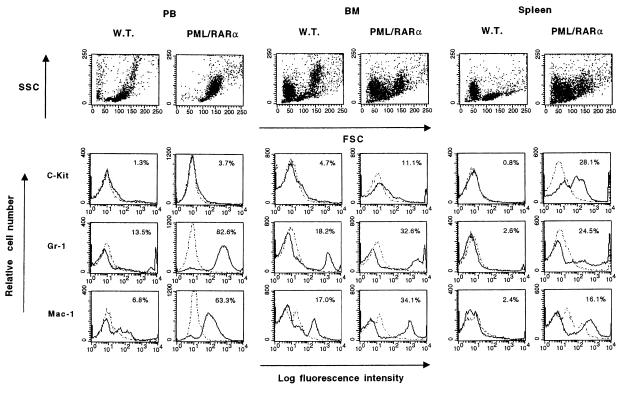
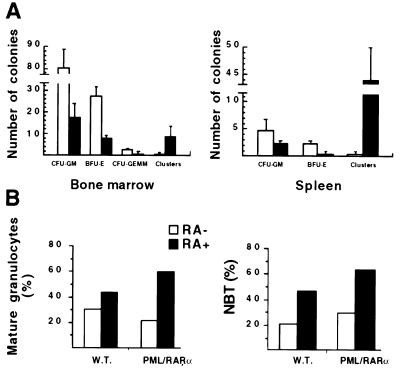
Acute promyelocytic leukemia (APL) is associated with reciprocal chromosomal translocations involving the retinoic acid receptor alpha (RARalpha) locus on chromosome 17. In the majority of cases, RARalpha translocates and fuses with the promyelocytic leukemia (PML) gene located on chromosome 15. The resulting fusion genes encode the two structurally unique PML/RARalpha and RARalpha/PML fusion proteins as well as aberrant PML gene products, the respective pathogenetic roles of which have not been elucidated. We have generated transgenic mice in which the PML/RARalpha fusion protein is specifically expressed in the myeloid-promyelocytic lineage. During their first year of life, all the PML/RARalpha transgenic mice have an abnormal hematopoiesis that can best be described as a myeloproliferative disorder. Between 12 and 14 months of age, 10% of them develop a form of acute leukemia with a differentiation block at the promyelocytic stage that closely mimics human APL even in its response to retinoic acid. Our results are conclusive in vivo evidence that PML/RARalpha plays a crucial role in the pathogenesis of APL.


Figures

Figure 1
Figure 1
Structure, integration, and expression of the hCG–PML/RARα transgene. (A) Structure of the hCG minigene expression vector (Upper) and the hCG–PML/RARα transgene fragment used for injection (Lower). The exons of hCG gene are designated by solid boxes. The promoter and the 5′ flanking region (hCG–PR + 5′ FL) as well as the 3′ flanking region (3′ FL) of the hCG gene are indicated. The PML/RARα cDNA was cloned into hCG exon 1. Restriction endonuclease sites used in construction and Southern blotting are as follows: N, NotI; B, BamHI; E, EcoRI; C, ClaI; S, SalI; P, PmlI; X, XbaI; H, HindIII. The location of probes for Southern blotting and primers for RT-PCR are shown underneath the structure of the injected fragment. (B) Southern blot of mouse genomic tail DNA from the four transgenic founders and one control digested with EcoRI and hybridized with probe CT reveals the expected band of 6.2 kb. PML probe A (see Materials and Methods) was used as an internal control probe to normalize DNA loading. Lanes: 6173, 6179, 6378, and 6380, four founders; 6177, nontransgenic mouse. (C) RT-PCR analysis of PML/RARα fusion mRNA expression in BM cells from progeny from founders 6179 (P6179) and 6380 (P6380). Representative result of nested PCR is shown. Negative control, RNA from a nontransgenic mouse; positive control, RNA from an APL patient with t(15;17); M, pGEM DNA markers (Promega). (D) Northern blot on total RNA from leukemic progeny from lines 6179 (LP6179) and 6380 (LP6380) hybridized with the human RARα probe IT (5). WT, nontransgenic mouse; hAPL, APL patient with t(15;17) [PML/RARα of bcr1 type (ref. 12)]. Expected 4.0-kb transcript for hCG–PML/RARα transgene (left solid arrowhead) and 4.4-kb transcript for human PML/RARα chimeric mRNA (right solid arrowhead) are indicated. Open arrowheads indicate the positions of the two RARα transcripts. The position of the 28S and the 18S ribosomal RNA transcripts are also indicated. (E) Immunofluorescence staining of BM cells from control mice (WT) and leukemic hCG–PML/RARα transgenic mice. PML is localized within the NBs in nontransgenic mouse (Upper), whereas it is in the form of microspeckles in transgenic mouse (Lower). 4′,6-Diamidino-2-phenylindole (DAPI) staining was used to visualize cell nuclei.
Figure 2
Figure 2
Morphology and immunohistochemistry of PB, BM, and spleen (SP) cells from wild-type (W.T.) and leukemic hCG–PML/RARα transgenic mice. The smears of PB or imprints of BM and spleen were stained with Wright-Giemsa stain. Magnified detail of promyelocyte morphology is shown in the spleen imprint from the leukemic hCG–PML/RARα mouse. Auer’s bodies are visible in the cytoplasm of the leukemic promyelocytes as indicated by the arrows. The serial spleen sections shown in the bottom panel were immunohistochemically stained with MPO (myeloid precursors and mature granulocytes) and B220 (pan-B cells, Inset) antibodies. (×400 for PB; ×1,000 for BM and spleen; ×128 for immunohistochemical staining.) Note that in the leukemic mice, the number of WBC in PB is much increased; the normal BM components, including erythrocytes and megakaryocytes, are replaced by myeloid cells at various maturation stages; the spleen is heavily infiltrated by MPO-positive cells.
Figure 3
Figure 3
Flow cytometric analysis of PB, BM, and spleen cells from leukemic hCG–PML/RARα transgenic and wild-type mice. The cells were analyzed with antibodies against the cell surface markers, c-Kit, Gr-1, and Mac-1, conjugated with fluorescein isothiocyanate (Mac-1) or R-phycoerythrin (others) (solid lines), and with control antibodies of the same isotype (dotted lines). Before Gr-1 and Mac-1 staining, cells were incubated with CD16/32 antibody to block non-antigen-specific binding of antibodies to the murine FcγII/III receptors. Values given in upper right corner of each histogram indicate the positive population for each antibody.
Figure 4
Figure 4
(A) Colony formation assay on BM and spleen cells from hCG–PML/RARα leukemic mice (solid bars) and sex- and age-matched wild-type littermates (open bars). Cells (3 × 10⁴) were plated per dish in 0.9% methylcellulose medium in triplicate. Colony numbers shown here are from one representative experiment (mean ± SD from the triplicate). CFU-GM includes CFU-G, -M, and -GM. Clusters are clones with <20 cells, often observed in assays performed on cells from acute leukemia and thought to represent colonies of leukemic origin (37). Note that colony formation from all lineages decreased and the number of clusters often observed in cultures from acute leukemias dramatically increased in BM and spleen cultures from leukemic transgenic mice. (B) In vitro response of BM cells to RA. BM cells from transgenic (PML/RARα) and wild-type (W.T.) mice were incubated with or without RA. Percentages of mature granulocytes and NBT-positive cells on day 5 are shown from two independent experiments. Note that both the percentage of mature granulocytes and the percentage of NBT-positive cells from leukemic transgenic mice are increased by 2-fold in the presence of RA.

References

    1. Bennett J M, Catovsky D, Daniel D, Flandrin G, Galton D A G, Gralnick H R, Sultan C. Br J Haematol. 1976;33:451–458. - PubMed
    1. Pandolfi P P. Haematologica. 1996;81:472–482. - PubMed
    1. Grignani F, Fagioli M, Alcalay M, Longo L, Pandolfi P P, Donti E, Biondi A, Lo Coco F, Pelicci P G. Blood. 1994;83:10–25. - PubMed
    1. Warrell R P, Jr, de Thé H, Wang Z Y, Degos L. N Engl J Med. 1993;329:177–189. - PubMed
    1. Longo L, Pandolfi P P, Biondi A, Rambaldi A, Mencarelli A, Lo Coco F, Diverio D, Pegoraro L, Avanzi G, Tabilio A, Zangrilli D, Alcalay M, Donti E, Grignani F, Pelicci P G. J Exp Med. 1990;172:1571–1575. - PMC - PubMed

Publication types

MeSH terms

LinkOut - more resources