. 1997 May 13;94(10):5444-9.
doi: 10.1073/pnas.94.10.5444.

Slow skeletal troponin I gene transfer, expression, and myofilament incorporation enhances adult cardiac myocyte contractile function

Affiliations

Slow skeletal troponin I gene transfer, expression, and myofilament incorporation enhances adult cardiac myocyte contractile function

M V Westfall et al. Proc Natl Acad Sci U S A. .

Abstract

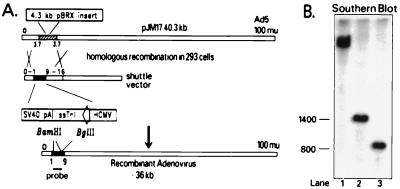
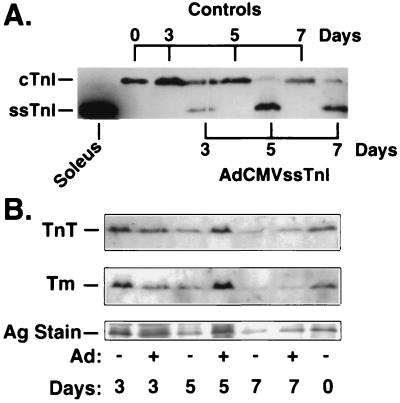
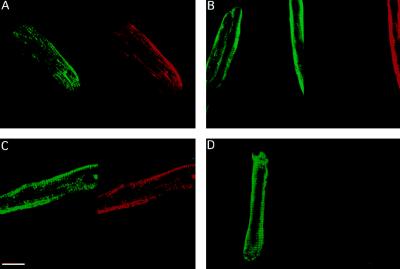
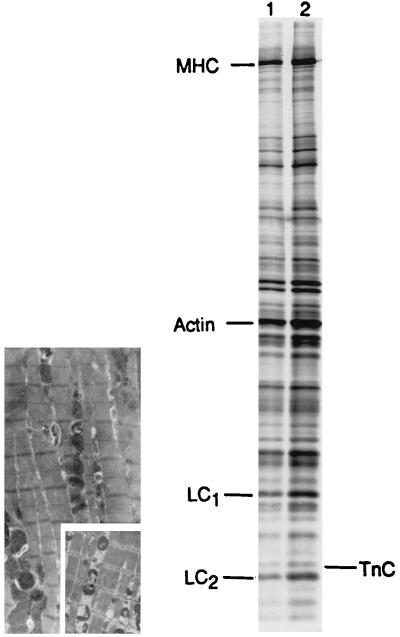
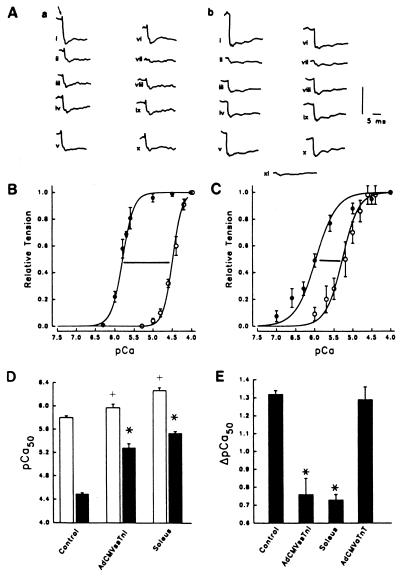
The functional significance of the developmental transition from slow skeletal troponin I (ssTnI) to cardiac TnI (cTnI) isoform expression in cardiac myocytes remains unclear. We show here the effects of adenovirus-mediated ssTnI gene transfer on myofilament structure and function in adult cardiac myocytes in primary culture. Gene transfer resulted in the rapid, uniform, and nearly complete replacement of endogenous cTnI with the ssTnI isoform with no detected changes in sarcomeric ultrastructure, or in the isoforms and stoichiometry of other myofilament proteins compared with control myocytes over 7 days in primary culture. In functional studies on permeabilized single cardiac myocytes, the threshold for Ca2+-activated contraction was significantly lowered in adult cardiac myocytes expressing ssTnI relative to control values. The tension-Ca2+ relationship was unchanged from controls in primary cultures of cardiac myocytes treated with adenovirus containing the adult cardiac troponin T (TnT) or cTnI cDNAs. These results indicate that changes in Ca2+ activation of tension in ssTnI-expressing cardiac myocytes were isoform-specific, and not due to nonspecific functional changes resulting from overexpression of a myofilament protein. Further, Ca2+-activated tension development was enhanced in cardiac myocytes expressing ssTnI compared with control values under conditions mimicking the acidosis found during myocardial ischemia. These results show that ssTnI enhances contractile sensitivity to Ca2+ activation under physiological and acidic pH conditions in adult rat cardiac myocytes, and demonstrate the utility of adenovirus vectors for rapid and efficient genetic modification of the cardiac myofilament for structure/function studies in cardiac myocytes.


Figures

Figure 1
Figure 1
Generation and structural characterization of the recombinant adenovirus vector AdCMVssTnI. (A) Scheme for creating the recombinant adenovirus AdCMVssTnI with plasmid pJM17 and plasmid pAdCMVssTnI, which contains the rat ssTnI expression cassette. (B) Recombinant AdCMVssTnI was identified by Southern blot analysis of viral lysates. Lane 1, undigested recombinant AdCMVssTnI DNA; lane 2, BglII digest, and lane 3, BamHI digest. The BglII excised the expected 1,400-bp fragment, containing the expression cassette and the left end of the adenovirus genome, whereas digestion with BamHI excised the full-length ssTnI cDNA of predicted size (800 bp).
Figure 2
Figure 2
Western blot analysis of regulatory protein isoforms in control and AdCMVssTnI-treated adult cardiac myocytes. (A) TnI isoform composition. Labels on top indicate days in primary culture for control myocytes while labels on bottom indicate days in culture for AdCMVssTnI-infected myocytes. A soleus slow skeletal fiber is shown as a positive control for detection of ssTnI. (B) TnT and Tm isoform composition. The day in culture (days) and experimental group (control = −; AdCMVssTnI = +) are labeled. These results (TnI, TnT, and Tm) are obtained from membrane-intact samples but also represent the pattern observed in permeabilized preparations (results not shown). A silver (Ag)-stained portion of the gel was used to normalize data for variations in protein loaded per lane. The cTnI+ssTnI/Ag stain ratio in AdCMVssTnI-treated myocytes over 7 days (0.94 ± 0.25, n = 4) is not significantly different (P > 0.05) from control myocyte values (1.56 ± 0.28, n = 4). The TnT/Ag stain and Tm/Ag stain ratios in AdCMVssTnI-infected myocytes over 7 days also are unchanged from controls (TnT/Ag stain: control = 1.27 ± 0.11, AdCMVssTnI = 1.08 ± 0.07, n = 4; Tm/Ag stain: control = 0.54 ± 0.09, AdCMVssTnI = 0.55 ± 0.17; n = 4).
Figure 3
Figure 3
TnI remodeling in adult single cardiac myocytes. Representative confocal images of indirect immunostaining of TnI in control (A and C) and AdCMVssTnI-infected (B and D) ventricular myocytes cultured for 4 (A and B) and 7 (C and D) days. TI-4 mAb labeling and cardiac specific TnI labeling with TI-1 mAb are shown in the left and right portions of A-D, respectively. (Bar = 17 μm.)
Figure 4
Figure 4
(Right) Representative SDS/PAGE gel analysis of myofilament isoform composition and stoichiometry of AdCMVssTnI-treated (lane 1) and control (lane 2) ventricular myocytes. Gels indicate that isoform expression of myosin heavy chain, TnC, LC1, and LC2 are not altered by ssTnI gene transfer. Laser-based densitometry was performed, and the integrated peak for each protein was used to evaluate myofilament stoichiometry. Ratios for TnC/(TnC+LC1+LC2) were 0.06 and 0.08 in control and AdCMVssTnI-treated myocytes, respectively. Ratios for LC1 (LC1/(LC1+LC2) and LC2 (LC2/(LC1+LC2) were 0.56 and 0.45 in control myocytes and, 0.58 and 0.42 in AdCMVssTnI-treated myocytes, respectively. (Left) Transmission electron micrograph of a cardiac myocyte 3 days after adenovirus-mediated ssTnI gene transfer. The average sarcomere length of this cardiac myocyte is 1.7 μm. (Inset) Electron micrograph of a freshly isolated control cardiac myocyte with an average sarcomere length of 1.8 μm. Examination of other electron micrographs up to 5 days postinfection with AdCMVssTnI showed no differences in sarcomeric ultrastructure compared with control myocytes in primary culture. Ventricular myocytes in primary culture were fixed, embedded, and mounted as described previously (3).
Figure 5
Figure 5
Enhanced tension generation in AdCMVssTnI-treated single, adult cardiac myocytes in culture. (A) Original fast time-base recordings of Ca2+-activated isometric tension development in a control (a) and an AdCMVssTnI-treated (b) single cardiac myocyte. In a, the pCa of the activating solution are 4.0, 6.0, 5.8, 5.3, 4.5, 4.0, 5.0, 4.6, 4.4, and 4.0, respectively. (B) pCas are 4.0, 7.0, 6.6, 6.3, 6.0, 4.0, 5.7, 5.2, 4.8, and 4.0, respectively. Records i-v in a and b were obtained at pH 7.00, and records vi-x are obtained at pH 6.20. Active tension was obtained by subtracting resting tension in relaxing solution 9.0 (b, xi) from total tension (see arrow in a, i) at each pCa. On average, tension was determined at eight different pCas at pH 7.00 and 6.20. Maximum Ca2+-activated tension is 29 kN/m2 in control and 30 kN/m2 in the AdCMVssTnI-treated myocytes shown. Vertical calibration bar is 27 kN/m2 for a and 19.7 kN/m2 for b. A summary of the tension-pCa relationships are shown for control (B) and AdCMVssTnI-treated (C) myocytes at pH 7.0 (•) and pH 6.20 (○). Active tension (P) at each submaximal pCa is expressed as a fraction of the maximum active, isometric tension at pCa 4.0 (Po) in each myocyte. The shape and position of the tension–pCa relationship in controls cultured for 6 days are unchanged from values obtained from acutely isolated myocytes. Thus, control data shown in B are pooled from control myocytes cultured for 0–6 days (n = 11–12 observations/point). Results for AdCMVssTnI-treated single cardiac myocytes are from 6-day primary cultures (n = 11–14 observations per point). (D) Summary of pCa50 in control and AdCMVssTnI-treated cardiac myocytes and in single soleus skeletal muscle fibers at pH 7.00 (empty bars) and pH 6.20 (filled bars). (E) Summary of ΔpCa50 (pCa50 pH 7.00 − pCa50 at pH 6.20) in control (n = 12) and AdCMVssTnI-treated (n = 11), and AdCMVaTnT-treated (n = 4; day 6) cardiac myocytes and in single soleus skeletal muscle fibers (n = 5). Values in B-E are expressed as mean ± SEM. The pCa50 and nH (see Results) values are derived from the tension-pCa curves as described in Methods, and n indicates the number of observations per point for the tension-pCa relationship in B and C. Cross indicates significantly different from control at pH 7.00 (D; P < 0.01). Asterisk indicates significantly different (P < 0.001) from control (E) or different from control at pH 6.20 (D).

References

    1. Reiser P J, Westfall M V, Schiaffino S, Solaro R J. Am J Physiol. 1994;267:H1589–H1596. - PubMed
    1. Saggin L, Gorza L, Ausoni S, Schiaffino S. J Biol Chem. 1989;264:16299–16302. - PubMed
    1. Metzger J M, Lin W-I, Samuelson L C. J Cell Biol. 1994;126:701–711. - PMC - PubMed
    1. Lee J A, Allen D G. J Clin Invest. 1991;88:361–367. - PMC - PubMed
    1. Solaro R J, Lee J A, Kentish J C, Allen D G. Circ Res. 1988;63:779–787. - PubMed

Publication types