. 1997 Jun 1;17(11):4022-31.
doi: 10.1523/JNEUROSCI.17-11-04022.1997.

Neurosteroid prolongs GABAA channel deactivation by altering kinetics of desensitized states

Affiliations

Neurosteroid prolongs GABAA channel deactivation by altering kinetics of desensitized states

W J Zhu et al. J Neurosci. .

Abstract

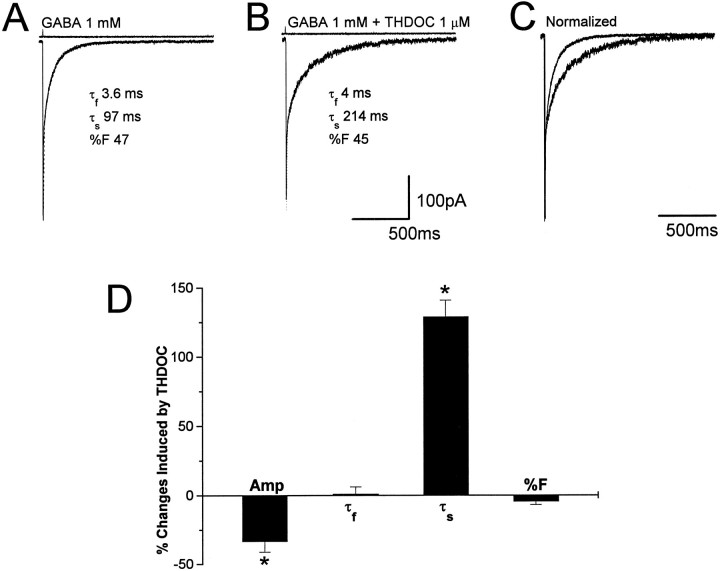
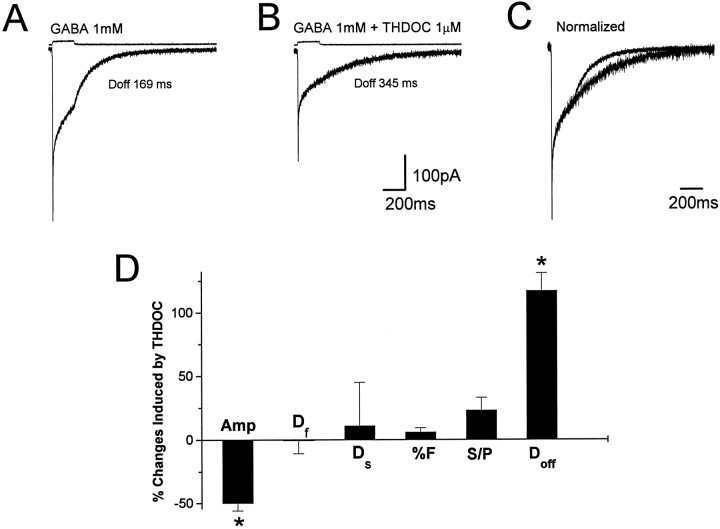
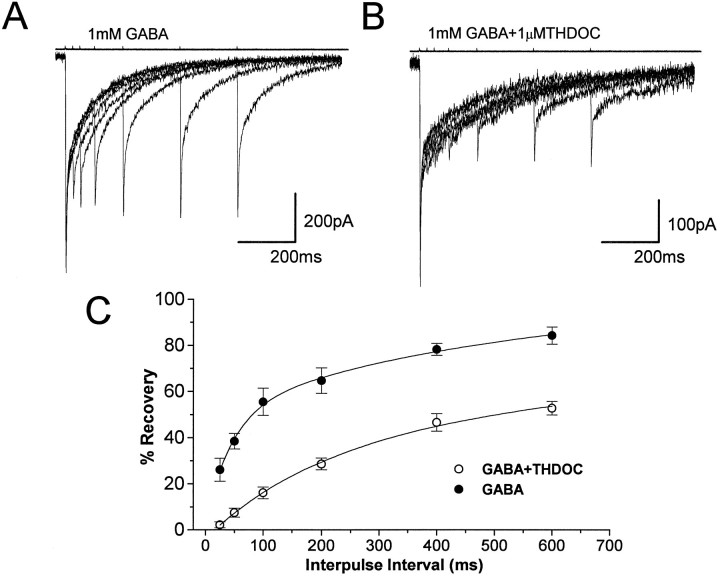
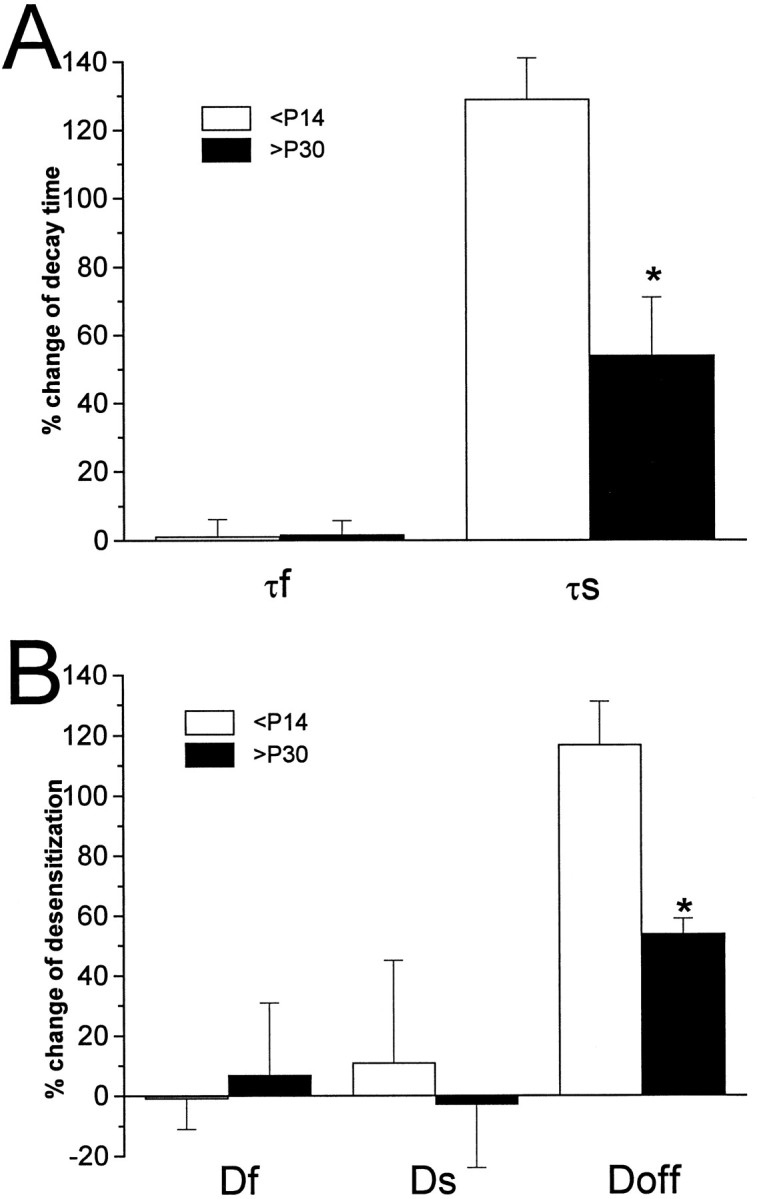
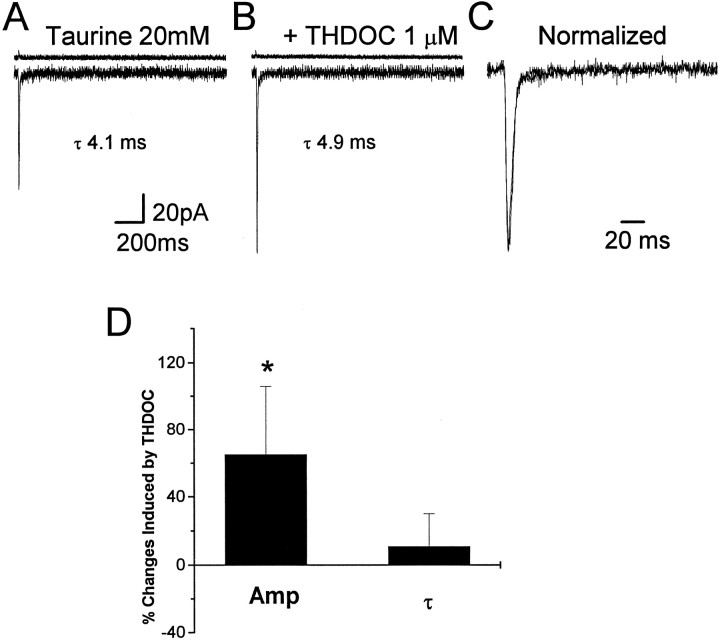
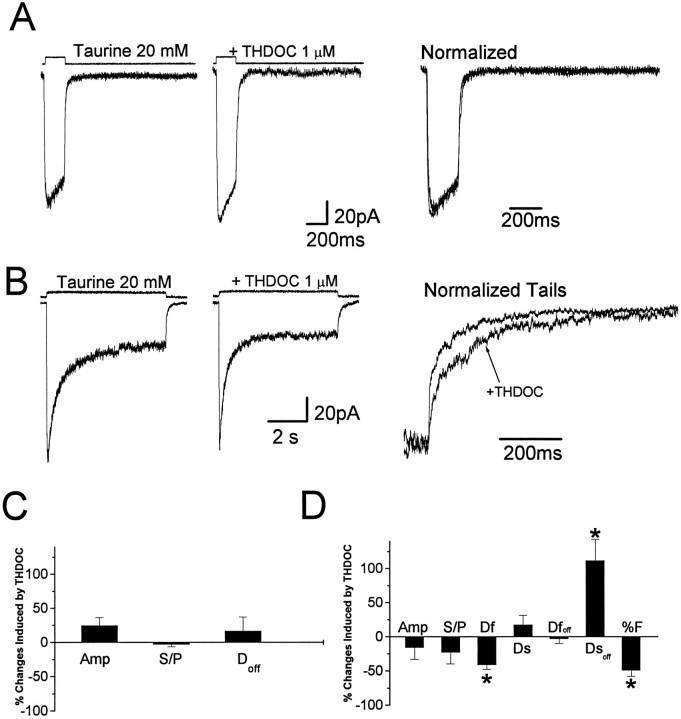
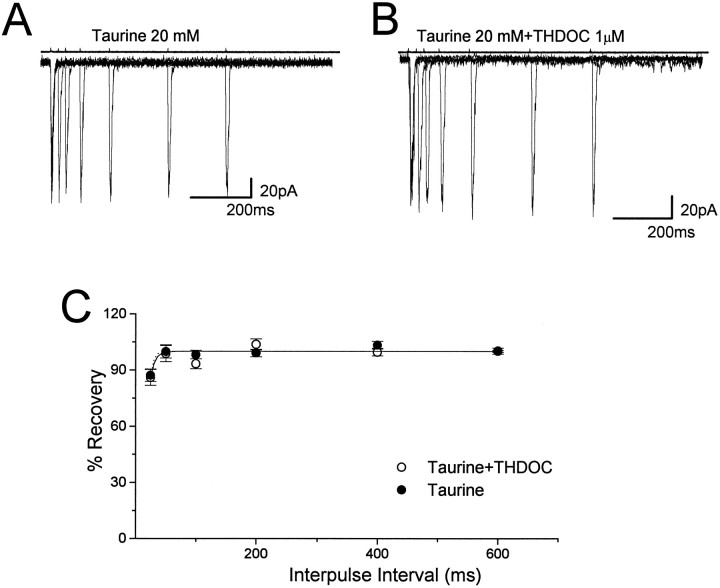
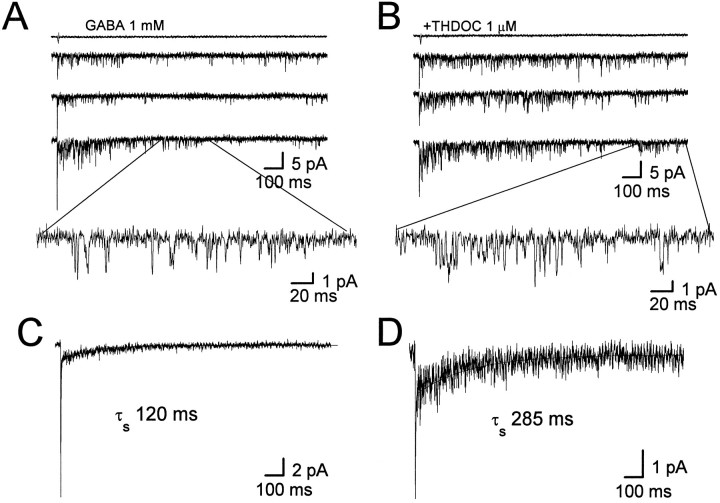
Fast applications of GABA (1 mM) to nucleated and outside-out patches excised from granule neurons in cerebellar slices from developing rats evoked currents with a double exponential time course reminiscent of that of IPSCs. A neurosteroid 3alpha, 21dihydroxy-5alpha-pregnan-20-one (THDOC) remarkably increased the slow deactivation time constant and slowed down recovery from desensitization, as estimated by paired-pulse GABA applications. THDOC also reduced the amplitude of GABA currents, whereas it failed to affect the fast deactivation component and its relative contribution to peak amplitude. The effects of THDOC on slow deactivation were greater in rats younger than postnatal day 13 (P13) as compared with rats at P30-P35. THDOC failed to alter deactivation of short responses induced by a less-potent agonist taurine at saturating doses. These responses had deactivation kinetics described by a fast single exponential decay, little desensitization, and quick recovery. However, THDOC slowed deactivation if taurine responses were long enough to allow consistent desensitization, suggesting that desensitized states are required for the neurosteroid to modulate GABA responses. In outside-out patches, just as desensitized states prolonged GABA responses by producing reopening of channels activated by brief GABA pulses, THDOC increased the channel open probability by further increasing the number of late channel openings, resulting in a prolongation of the slow deactivation. Our data suggest that neurosteroid potentiates the inhibitory postsynaptic transmission via the prolongation of the slow deactivation and that the alteration of kinetics of entry and exit from desensitized states underlies the allosteric modification of GABAA receptors by neurosteroids.


Figures

Fig. 1.
Fig. 1.
THDOC prolongs slow deactivation of currents elicited by brief GABA pulses. A, Average of 10 responses induced by a 1 msec application of 1 mm GABA to a nucleated patch excised from a granule neuron in a rat cerebellar slice (holding potential, −60 mV) with an indication of the double exponential fit.B, Averaged response of the same patch as in A to 1 mm GABA in the presence of THDOC (1 μm).C, Superimposed average currents recorded before and after the coapplication of GABA and THDOC. The average current recorded in the presence of THDOC has been normalized to the peak amplitude of the response in A. D, Summary of the percentage of changes produced by THDOC on GABA-gated currents elicited by 1 msec applications. Amp, Peak amplitude; τf, fast decay time constant; τs, slow decay time constant; %F, relative contribution of the fast component to peak amplitude. Each bar represents the mean ± SEM of 17 patches studied. Above each trace are shown the currents generated by the liquid junction potential because of a 50:1 dilution of the GABA-containing solution measured after “blowing out” the patch to give an indication of the duration of the pulse application. Vertical calibration does not apply to these traces.
Fig. 2.
Fig. 2.
THDOC fails to alter desensitization of currents elicited by 200 msec GABA steps. A, Average of 10 responses induced by 200 msec application of 1 mm GABA to a nucleated patch excised from a granule neuron in a rat cerebellar slice (holding potential, −60 mV) with an indication of the single exponential fit of the offset decay at the end of the 200 msec application. B, Averaged response of the same patch as in A to 1 mm GABA in the presence of THDOC (1 μm).C, Superimposed average currents recorded before and after the coapplication of GABA and THDOC. The averaged current inB has been normalized to the peak amplitude of the response in A. D, Summary of the percentage of changes produced by THDOC on GABA-gated currents induced by 200 msec applications. Amp, Peak amplitude;Df, fast time constant of desensitization;Ds, slow time constant of desensitization; %F, relative contribution of the fast desensitization component to peak amplitude; S/P, ratio between the amplitude at 200 msec (S) and peak amplitude (P);Doff, offset decay time constant at the end of the 200 msec application. Each bar represents the mean ± SEM of 12 patches studied. Above each traceare shown currents generated to give an indication of the duration of the GABA application. Vertical calibration does not apply to these traces.
Fig. 3.
Fig. 3.
THDOC slows recovery from desensitization induced by brief GABA pulses. Superimposed averages of five traces evoked by two successive applications of 1 msec GABA (1 mm) pulses separated by 25, 50, 100, 200, 400, and 600 msec intervals in a nucleated patch excised from a granule neuron at P11 in the absence (A) and the presence (B) of THDOC (1 μm) (holding potential, −60 mV). C, Comparison of the recovery time course of the second response from desensitization. The percentage of recovery from desensitization at each designated separation of two brief GABA pulses is calculated according to the formula ([Peak2 − onset]/[peak1 − onset] × 100) and plotted against the interpulse interval similar to that described by Jones and Westbrook (1995). Each data group represents the mean ± SEM of eight patches studied. Double exponential fitting of the recovery in the presence of THDOC showed an increase from 44 to 195 msec for the fast time constant and from 510 msec to 1.8 sec for the slow time constant. Above eachtrace are shown currents to give an indication of the duration of the pulse applications. Vertical calibration does not apply to these traces.
Fig. 4.
Fig. 4.
Developmental reduction of THDOC effects on GABA current deactivation. GABA responses were compared in nucleated patches isolated from cerebellar granule neurons of rats at postnatal day 10–13 and 30–35. Summary of the percentage of changes produced by THDOC on GABA-gated currents induced by 1 (A) or 200 msec (B) applications. Amp, Peak amplitude;Df, fast decay time constant;Ds, slow decay time constant; %F, relative contribution of the fast component to peak amplitude;S/P, ratio between the amplitude at 200 msec (S) and peak amplitude (P); Doff, offset decay time constant at the end of the 200 msec application.
Fig. 5.
Fig. 5.
THDOC fails to prolong deactivation of responses evoked by brief taurine pulses. A, Averaged response of channel openings induced by 10 applications of taurine (2 msec, 20 mm) to a nucleated patch of a granule neuron excised from a rat cerebellar slice (holding potential, −60 mV). B, Averaged response of the same patch as in A to 20 mm taurine in the presence of THDOC (1 μm).C, Superimposed averaged currents recorded before and after the coapplication of taurine and THDOC. The averaged current inB has been normalized to the peak amplitude of the response in A. D, Summary of the percentage of changes produced by THDOC on taurine-gated currents. Amp, Peak amplitude; τ, decay time constant. Each bar represents the mean ± SEM of 11 patches studied. Above eachtrace are shown the currents indicating the duration of the pulse application. Vertical calibration does not apply to these traces.
Fig. 6.
Fig. 6.
THDOC alters desensitization of currents elicited by 5 sec but not 200 msec taurine applications. A, Left, Averaged response of 10 applications of taurine (200 msec, 20 mm) to a granule neuron nucleated patch excised from a rat cerebellar slice (holding potential, −60 mV). Middle, Averaged response of the same patch as in the left panel to 20 mm taurine in the presence of THDOC (1 μm). Right, Superimposed averaged currents recorded before and after the coapplication of taurine and THDOC. The averaged current in the middle panel has been normalized to the peak amplitude of the response in the left panel. Aboveeach trace in the right and middle panels are shown the currents indicating the duration of the taurine applications. Vertical calibration bars do not apply to these currents. B, Left, Averaged response of 10 applications of taurine (5 sec, 20 mm) to a nucleated patch.Middle, Averaged response of the same patch as in theleft panel to 20 mm taurine in the presence of THDOC (1 μm). Right, Superimposed normalized tail currents recorded before and after THDOC. C, Summary of the percentage of changes produced by THDOC on taurine-gated currents (200 msec applications). Amp, Peak amplitude;S/P, ratio between the amplitude at 200 msec (S) and peak amplitude (P); Doff, decay time constant at the end of the 200 msec application. Eachbar represents the mean ± SEM of nine patches studied.D, Summary of the percentage of changes produced by THDOC on taurine-gated currents (5 sec applications). Amp, Peak amplitude; S/P, ratio between the amplitude at 5 sec (S) and peak amplitude (P); Df andDs are the fast and slow desensitization time constants.Dfoff and Dsoff are the fast and slow decay time constant of deactivation at the end of the 5 sec application, and %F is the relative contribution of the fast component to peak amplitude. Each bar represents the mean ± SEM of eight patches studied.
Fig. 7.
Fig. 7.
THDOC fails to alter responses generated by paired pulses of taurine. Superimposed traces evoked by two successive applications of 2 msec pulses of 20 mm taurine (A) and taurine plus THDOC (1 μm) (B) separated by 25, 50, 100, 200, 400, and 600 msec intervals. C, Comparison of the recovery time course of the second response from desensitization. The percentage of recovery from desensitization at each designated separation of two brief taurine pulses is calculated as described in Figure 3. Exponential fitting of the recovery from desensitization yielded first order kinetics with a time constant of 5 msec for taurine and 7 msec for taurine plus THDOC. Data are expressed as mean ± SEM of eight patches studied.Above each trace are shown the currents used to measure the duration of the application. Vertical calibration does not apply to these traces.
Fig. 8.
Fig. 8.
THDOC increases late openings of single channel currents gated by a brief pulse of GABA. A, Channel activity evoked by a 1 msec pulse of 1 mm GABA as indicated by the current above each trace in an outside-out patch excised from a granule neuron in a cerebellar slice. The inset shows a fraction of the single channel current activity on an expanded time scale. B, Same as in A except that GABA was coapplied with THDOC (1 μm). C, D, Illustrated are the ensemble averages derived from 30 applications as inA and B, respectively. Ensemble responses are shown fit to biexponential functions with an indication of the slow decay time constant. Corresponding calibration bars are shownunder the right corner of the traces.

References

    1. Brickley SG, Cull-Candy SG, Farrant M. Development of a tonic form of synaptic inhibition in rat cerebellar granule cells resulting from persistent activation of GABAA receptors. J Physiol (Lond) 1996;497:753–759. - PMC - PubMed
    1. Callachan H, Cottrell GA, Hather NY, Lambert JJ, Nooney JM, Peters JA. Modulation of GABAA receptor by progesterone metabolites. Proc R Soc Lond [Biol] 1987;231:359–369. - PubMed
    1. Celentano J, Wong RKS. Multiphasic desensitization of the GABAA receptor in outside-out patches. Biophys J. 1994;66:1039–1050. - PMC - PubMed
    1. Cooper EJ, Johnston GAR, Edwards FA. Differential sensitivity of synaptic GABAergic currents to a neuroactive steroid in brain slices from male rats. Soc Neurosci Abstr. 1995;21:1345.
    1. Cooper EJ, Johnston GAR, Edwards FA. Developmental differences in synaptic GABAergic currents in hippocampal and cerebellar cells of male rats. Soc Neurosci Abstr. 1996;22:810.

Publication types

MeSH terms