. 1997 May;109(5):589-605.
doi: 10.1085/jgp.109.5.589.

Molecular analysis of the putative inactivation particle in the inactivation gate of brain type IIA Na+ channels

Affiliations

Molecular analysis of the putative inactivation particle in the inactivation gate of brain type IIA Na+ channels

S Kellenberger et al. J Gen Physiol. 1997 May.

Abstract

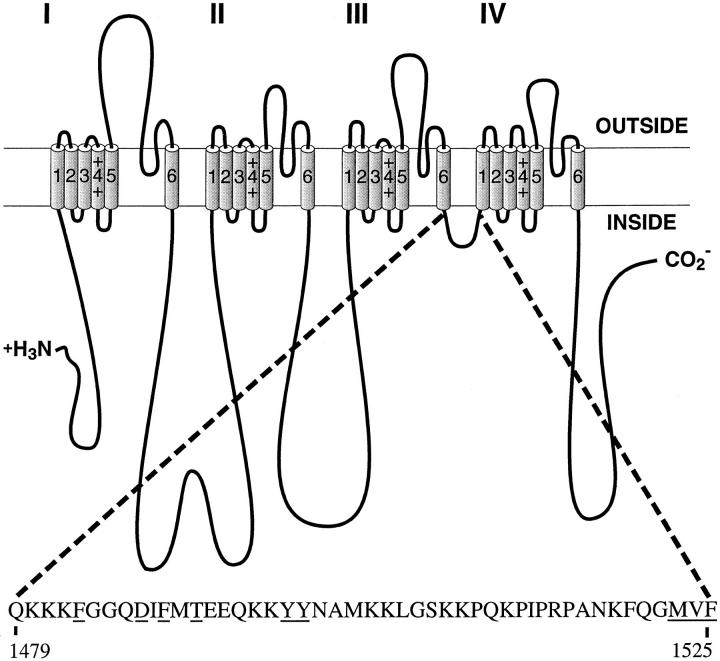
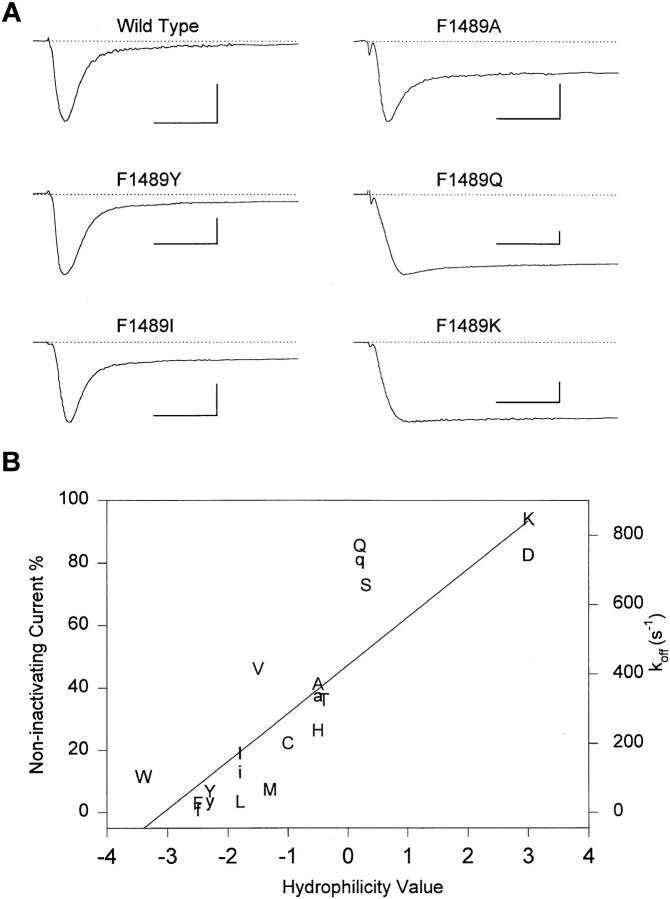
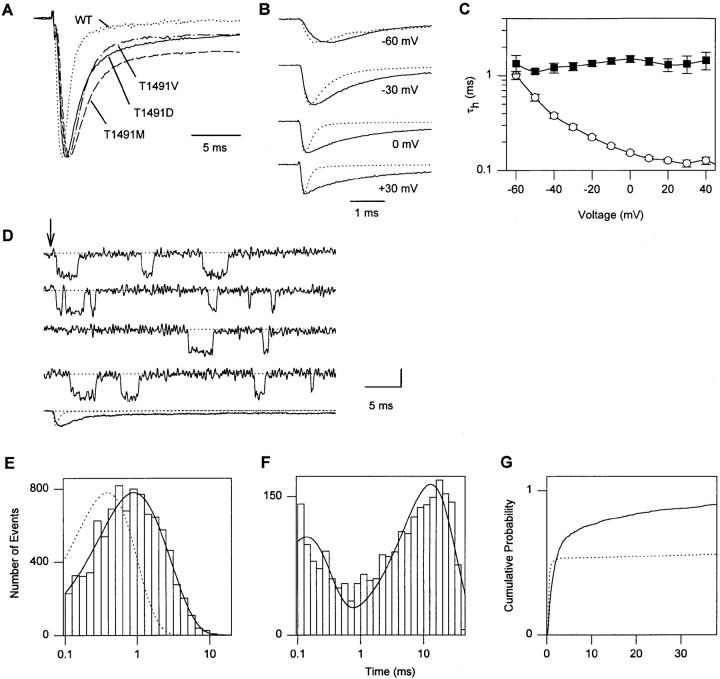
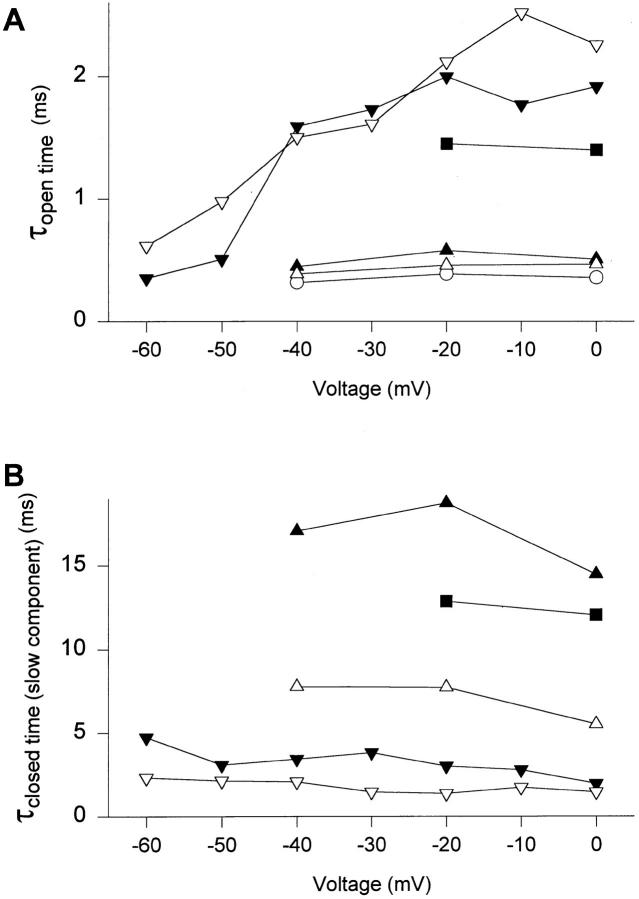
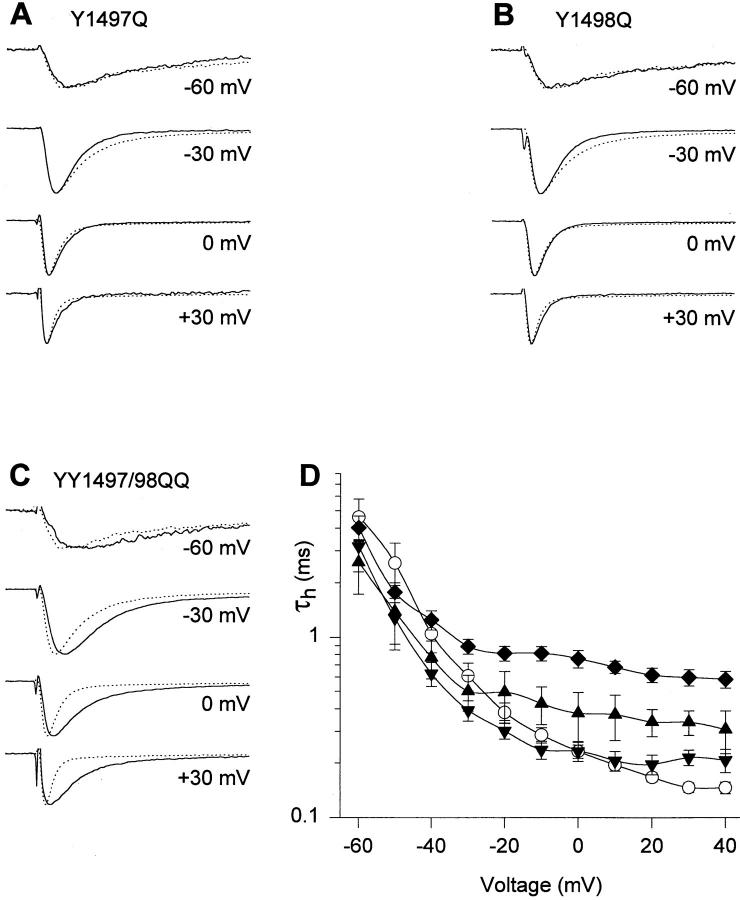
Fast Na+ channel inactivation is thought to involve binding of phenylalanine 1489 in the hydrophobic cluster IFM in L(III-IV) of the rat brain type IIA Na+ channel. We have analyzed macroscopic and single channel currents from Na+ channels with mutations within and adjacent to hydrophobic clusters in L(III-IV). Substitution of F1489 by a series of amino acids disrupted inactivation to different extents. The degree of disruption was closely correlated with the hydrophilicity of the amino acid at position 1489. These mutations dramatically destabilized the inactivated state and also significantly slowed the entry into the inactivated state, consistent with the idea that F1489 forms a hydrophobic interaction with a putative receptor during the fast inactivation process. Substitution of a phe residue at position 1488 or 1490 in mutants lacking F1489 did not restore normal inactivation, indicating that precise location of F1489 is critical for its function. Mutations of T1491 disrupted inactivation substantially, with large effects on the stability of the inactivated state and smaller effects on the rate of entry into the inactivated state. Mutations of several other hydrophobic residues did not destabilize the inactivated state at depolarized potentials, indicating that the effects of mutations at F1489 and T1491 are specific. The double mutant YY1497/8QQ slowed macroscopic inactivation at all potentials and accelerated recovery from inactivation at negative membrane potentials. Some of these mutations in L(III-IV) also affected the latency to first opening, indicating coupling between L(III-IV) and channel activation. Our results show that the amino acid residues of the IFM hydrophobic cluster and the adjacent T1491 are unique in contributing to the stability of the inactivated state, consistent with the designation of these residues as components of the inactivation particle responsible for fast inactivation of Na+ channels.


Figures

Figure 1
Figure 1
Schematic representation of the brain Na+ channel α subunit and the location of the inactivation gate. The amino acid sequence of the inactivation gate is shown for the rat brain IIA α subunit, and amino acids which were mutated in this study are underlined.
Figure 2
Figure 2
Effects of shifting F1489 one amino acid residue in either direction. Two-electrode voltage-clamp recordings from Xenopus oocytes expressing either WT, the single mutant F1489Q, or the double mutants I1488F/F1489Q and F1489Q/M1490F. The currents were elicited by step depolarizations from a holding potential of −90 mV to test potentials of −30 to +10 mV in 10-mV increments. The vertical calibration bars are 1,000 nA; the horizontal calibration bars are 5 ms.
Figure 3
Figure 3
Effects of mutations of F1489 on inactivation. (A) Two-electrode voltage-clamp recordings from WT and the indicated mutant channels during depolarizations to −10 mV. The vertical calibration bars are 1,000 nA; the horizontal calibration bars are 5 ms. (B) Correlation of the fraction of noninactivating current (left hand ordinate) and the hydrophilicity of the amino acid at position 1489 in WT and mutant channels. The substituted amino acid is indicated in upper case single letter code. Hydrophilicity values are from Hopp and Woods (1981). k off values (right hand ordinate) calculated from corrected closed duration time constants in single-channel experiments are plotted in lower case single letter code.
Scheme I
Scheme I
Figure 4
Figure 4
Single-channel records and ensemble averages of WT and F1489 mutant channels. Traces of single-channel activity and ensemble averages (last trace in each column) from cell-attached patches. The arrows indicate the beginning of 40-ms depolarizations to −20 mV from a holding potential of −140 mV. The vertical calibration bar is 1 pA for single-channel traces and 0.5 pA for ensemble averages. The number of channels in the patches for the single-channel traces shown were two for WT and one for each mutant. The dotted ensemble averages are normalized WT data for comparison.
Figure 5
Figure 5
Single-channel properties of WT and F1489 mutant channels. Data are from two patches for WT, F1489Y, F1489I and F1489Q channels, and from three patches for F1489A channels. (A) Single-channel open time histograms at −20 mV. Patches containing one to two channels were used for the open time analysis. The solid lines are fits of single exponentials (WT, F1489Y, F1489I, F1489Q) or the fit to the sum of two exponentials (F1489A) to the log binned data. The time constants derived from the fits are shown in Table IV. The dotted lines are single exponentials with the WT time constant. Mean open times for individual patches at −20 mV were 0.38 and 0.41 ms (WT), 0.65 and 0.51 ms (F1489Y), 0.62 and 0.44 ms (F1489I), 1.54 and 1.11 ms (F1489A), and 2.02 and 1.87 ms (F1489Q). (B) Closed time histograms for depolarizations to −20 mV. Only closed times occurring after the first opening of a depolarization were analyzed to exclude first latencies and only data from single-channel patches were used. The solid lines are single exponential fits (F1489Q) or fits of the sum of two exponentials (WT, F1489Y, F1489I, F1489A) to the log binned data. Time constants derived from the fits are given in Table IV. (C) Cumulative first latency distributions at −20 and −40 mV for the indicated mutants. Distributions were corrected for the channel number (Patlak and Horn, 1982). Data are from patches with one channel (F1489Y, F1489Q), one to two channels (F1489I, F1489A), or two channels (WT). Parameters for fits to the sum of two exponentials (see materials and methods) are shown in Table V.
Figure 6
Figure 6
Effects of mutations of T1491. (A) Two-electrode voltage-clamp recordings from oocytes expressing WT and mutant channels. Normalized current traces in response to depolarizations to 0 mV for the indicated mutants are shown. Panels B–G show experiments with mutant T1491M. (B) Averaged current traces from cell-attached macropatches in response to pulses to the indicated potentials from a holding potential of −140 mV. Each trace is an average of normalized traces from different experiments for WT (dotted line, n = 13 experiments) and T1491M (solid line, n = 4). (C) Voltage-dependence of macroscopic inactivation. τh was determined from single exponential fits to the current decay in macropatch experiments from WT (○; n = 4) and T1491M (▪; n = 3) Na+ channels studied in the same batch of oocytes. (D) Single-channel records and an ensemble average (last trace) from a cell-attached patch containing a single channel. The dotted ensemble average is WT normalized for comparison. The arrow indicates the beginning of 40-ms depolarizations to −20 mV from a holding potential of −140 mV. The vertical calibration bar is 1 pA for single-channel traces and 0.5 pA for the ensemble average. (E) Open time histogram at −20 mV. Three patches containing one to two channels each were used for open time analysis. The solid line is a fit to the sum of two exponentials to the log binned data. The time constants from the fit are 1.45 and 0.565 ms (Table IV). The dotted line is a single exponential with the WT time constant. Mean open times for individual T1491M patches at −20 mV were 1.02, 0.96, and 1.23 ms. (F) Histogram of closed times excluding first latencies at −20 mV. Only single-channel patches were used for closed time analysis. The solid line is the fit of the sum of two exponentials to the log binned data. The time constants derived from the fit are 0.13 and 12.89 ms (Table IV). (G) Cumulative first latency distributions for WT (dotted line) and T1491M (solid line) at −20 mV. Distributions were corrected for the channel number (Patlak and Horn, 1982). Data are from patches with one to two channels (T1491M) or two channels (WT). Parameters for fits to the sum of two exponentials (see materials and methods) are shown in Table V.
Figure 7
Figure 7
Voltage-dependence of open and closed time constants. Time constants from fits to the pooled open times (A) and the slow component of closed times (B) at different voltages, as described for −20 mV in the legend to Figs. 5 and 6. WT (○), F1489Y (▴), F1489I (▵), F1489A (▾), F1489Q (▿), and T1491M (▪). For F1489A, where open time distributions at potentials more positive than −50 mV were best fit with the sum of two exponentials, the time constant of the longer component is shown. Similarly, T1491M open times at −20 mV were fit with the sum of two exponentials, and the time constant of the longer component is shown.
Figure 8
Figure 8
Effects of mutations of hydrophobic amino acids YY1497/8 and MVF1523-5 to Gln. (A) Two-electrode voltage-clamp recordings from Xenopus oocytes expressing either WT, YY1497/ 8QQ, or MVF1523-5QQQ mutant channels. The currents were elicited by step depolarizations from a holding potential of −90 mV to test potentials of −30 to +10 mV in 10-mV increments. (B) Steady-state inactivation curves in response to 100-ms prepulses. Data are averages of three to seven two-electrode voltage-clamp experiments (Table I) with WT (○), Y1497Q (▴), Y1498Q (▾), YY1497/8QQ (♦), and MVF15-23-5QQQ (•). Solid lines are least-square fits of the Boltzmann equation to the data. (C) Voltage-dependence of the time constant of recovery from inactivation, τrec. The recovery time course at each voltage was fitted by one exponential (see materials and methods). Data are from three to four experiments with WT (○), Y1497Q (▴), Y1498Q (▾), YY1497/8QQ (♦), and MVF1523-5QQQ (•).
Figure 9
Figure 9
Time course of macroscopic inactivation of channels with mutations of Y1497 and Y1498. (A–C) Current traces from cell-attached macropatches from Xenopus oocytes. Currents were elicited from a holding potential of −140 mV to the potentials indicated. Each trace shown is an average of normalized traces from different experiments for WT (dotted line, n = 13) and mutants, shown as solid lines, Y1497Q (n = 2), Y1498Q (n = 4), and YY1497/8QQ (n = 9). (D) Voltage dependence of macroscopic inactivation. τh was determined from a single exponential fit to the current decay in macropatch experiments of WT (○), Y1497Q (▴), Y1489Q (▾), YY1497/8QQ (♦).

Similar articles

Cited by

References

    1. Aldrich RW, Corey DP, Stevens CF. A reinterpretation of mammalian sodium channel gating based on single channel recording. Nature (Lond) 1983;306:436–441. - PubMed
    1. Armstrong CM. Sodium channels and gating currents. Physiol Rev. 1981;61:644–683. - PubMed
    1. Armstrong CM, Bezanilla F, Rojas E. Destruction of sodium conductance inactivation in squid axons perfused with pronase. J Gen Physiol. 1973;62:375–391. - PMC - PubMed
    1. Armstrong CM, Bezanilla F. Charge movement associated with the opening and closing of the activation gates of the Na channels. J Gen Physiol. 1974;63:533–552. - PMC - PubMed
    1. Armstrong CM, Bezanilla F. Inactivation of the sodium channel. II. Gating current experiments. J Gen Physiol. 1977;70:567–590. - PMC - PubMed

Publication types

Substances