. 1997 May;109(5):633-46.
doi: 10.1085/jgp.109.5.633.

Separation of gating properties from permeation and block in mslo large conductance Ca-activated K+ channels

Affiliations

Separation of gating properties from permeation and block in mslo large conductance Ca-activated K+ channels

D H Cox et al. J Gen Physiol. 1997 May.

Abstract

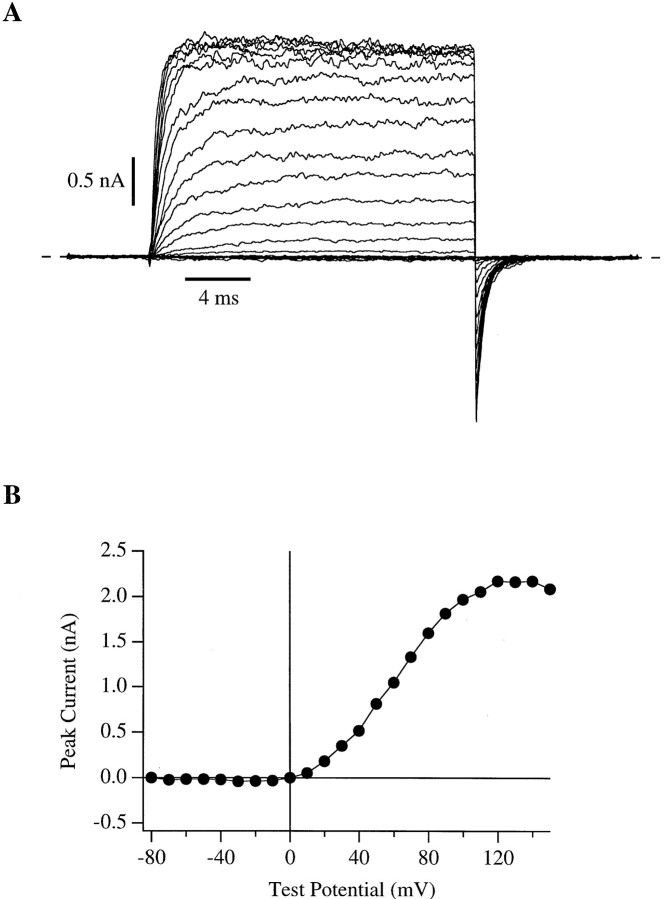
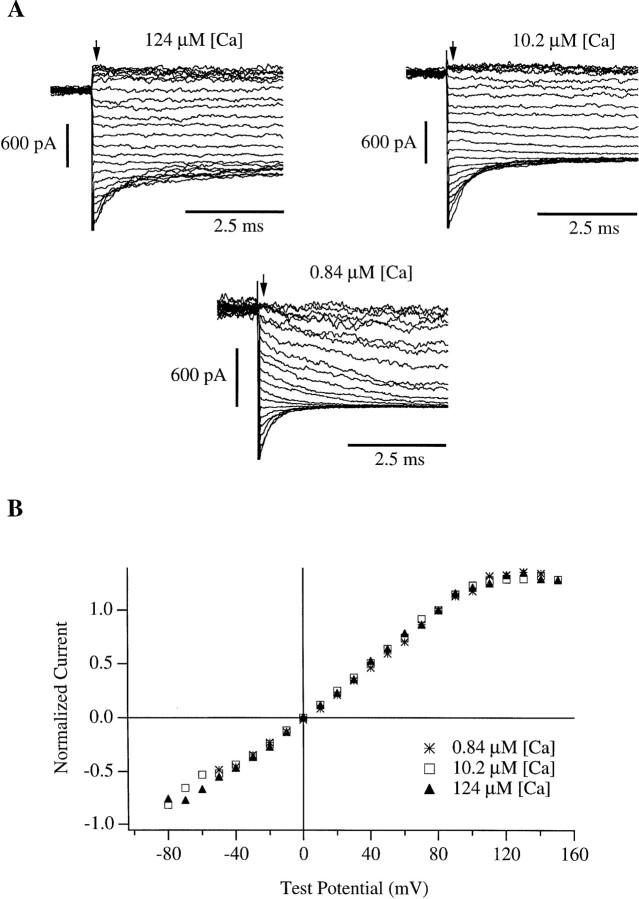
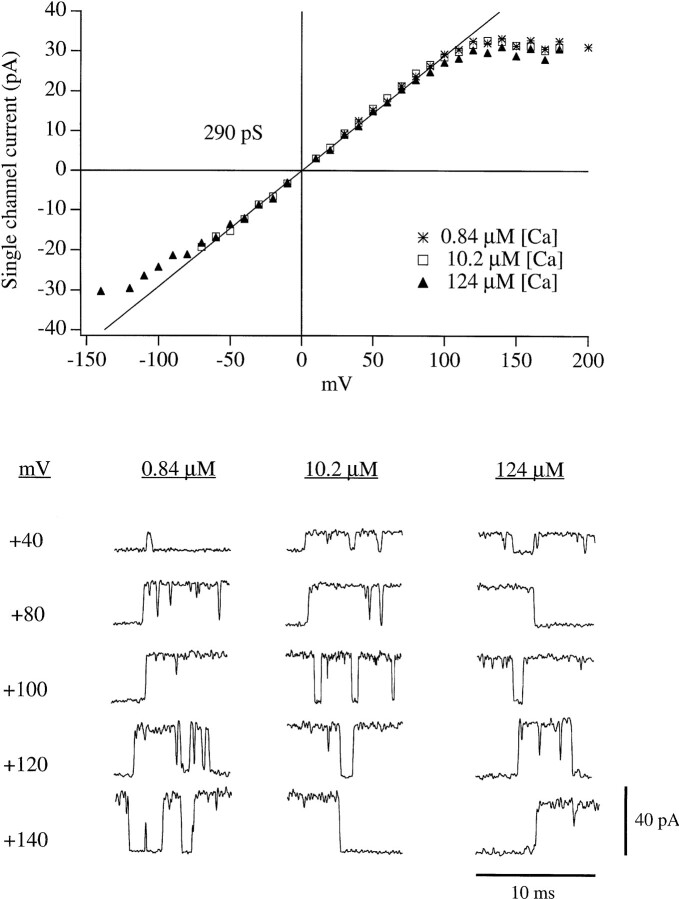
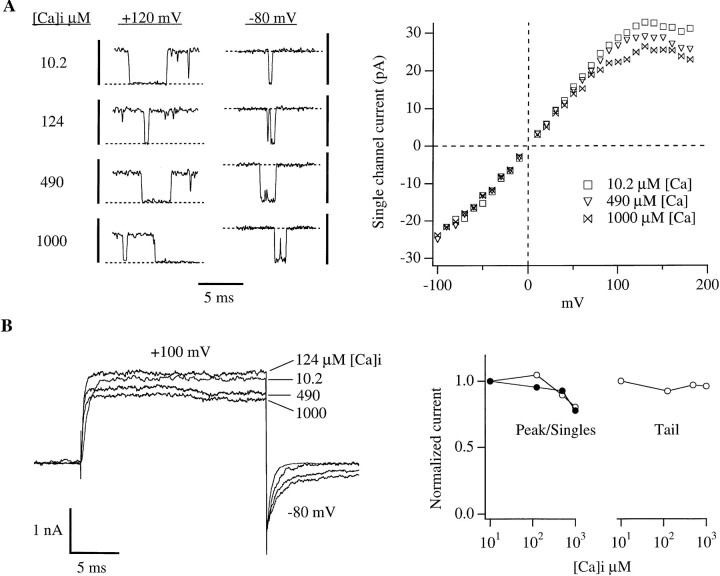
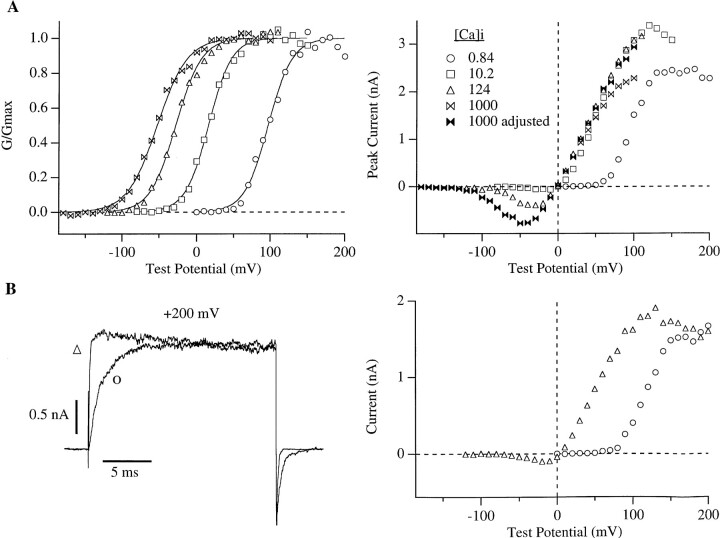
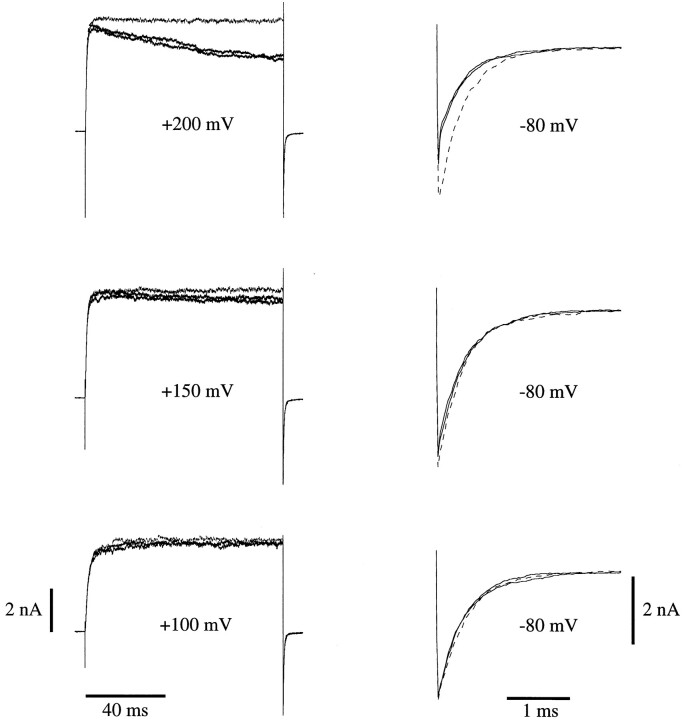
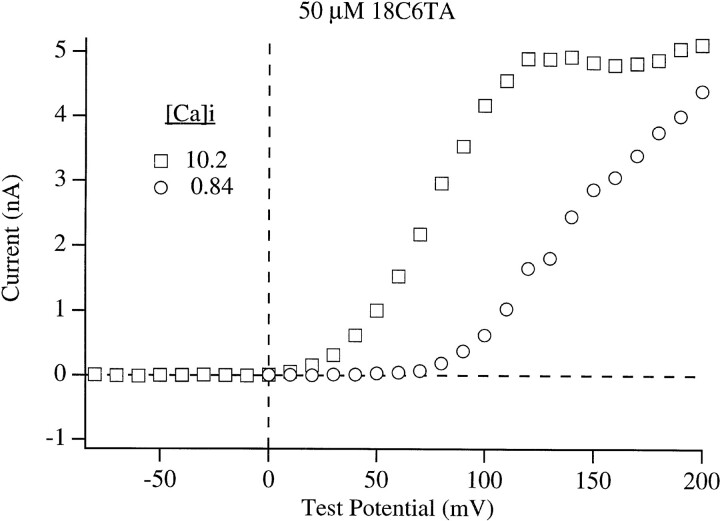
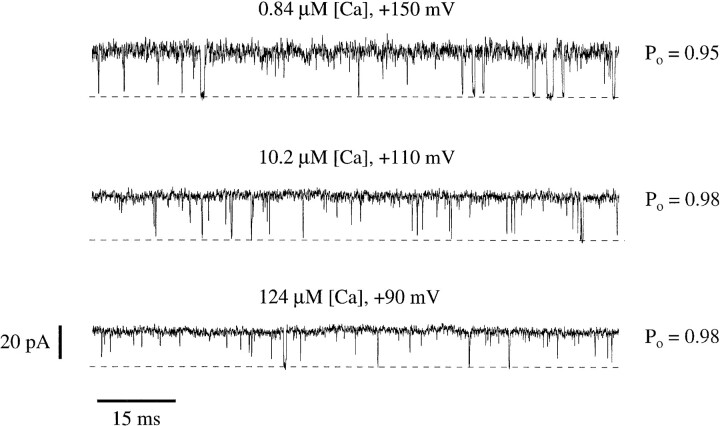
In this and the following paper we have examined the kinetic and steady-state properties of macroscopic mslo Ca-activated K+ currents in order to interpret these currents in terms of the gating behavior of the mslo channel. To do so, however, it was necessary to first find conditions by which we could separate the effects that changes in Ca2+ concentration or membrane voltage have on channel permeation from the effects these stimuli have on channel gating. In this study we investigate three phenomena which are unrelated to gating but are manifest in macroscopic current records: a saturation of single channel current at high voltage, a rapid voltage-dependent Ca2+ block, and a slow voltage-dependent Ba2+ block. Where possible methods are described by which these phenomena can be separated from the effects that changes in Ca2+ concentration and membrane voltage have on channel gating. Where this is not possible, some assessment of the impact these effects have on gating parameters determined from macroscopic current measurements is provided. We have also found that without considering the effects of Ca2+ and voltage on channel permeation and block, macroscopic current measurements suggest that mslo channels do not reach the same maximum open probability at all Ca2+ concentrations. Taking into account permeation and blocking effects, however, we find that this is not the case. The maximum open probability of the mslo channel is the same or very similar over a Ca2+ concentration range spanning three orders of magnitude indicating that over this range the internal Ca2+ concentration does not limit the ability of the channel to be activated by voltage.


Figures

Figure 1
Figure 1
Macroscopic mslo K+ currents recorded from an inside-out membrane patch during superfusion with an internal solution buffered to a free Ca2+ concentration ([Ca]i) of 10.2 μM. (A) Current traces were elicited with 20-ms voltage steps to test potentials between −80 and +150 mV in 10-mV increments from a −100 mV holding potential. After depolarization the membrane potential was repolarized to −80 mV. The traces displayed represent the average of four series recorded in succession. The dashed horizontal line indicates zero current. (B) Peak I-V relation for the data in A. Current amplitudes were measured as the mean current in a 1-ms range straddling the point of maximum outward current.
Figure 2
Figure 2
(A) Macroscopic mslo tail currents recorded after 20-ms depolarizations to +180 mV(0.84 μM [Ca]i), +100 mV(10.2 μM [Ca]i), and +80 mV(124 μM [Ca]i). (B) Tail current amplitudes were measured at the indicated test potentials 200 μs (arrow) after the beginning of the repolarizing step, normalized to their values at +80 mV, and plotted as a function of test potential.
Figure 3
Figure 3
mslo single channel current voltage relations (i-V) determined at 0.84, 10.2, and 124 μM [Ca]i. Symbols represent the average of between two and four experiments. In each experiment i was determined at each potential as the average of the amplitudes of between one and six (typically four) transitions like those displayed in the lower panel. Amplitudes were determined by eye. The traces in the lower panel have been digitally filtered at 5 kHz.
Figure 4
Figure 4
Fast block of mslo currents by Ca2+. (A) (left) Single channel gating transitions recorded at +120 mV and −80 mV at 4 different [Ca]i as indicated. The vertical scale bars represent 40 pA (left, +120 mV) and 30 pA (right, −80 mV). Dashed lines indicate the zero current level. (right) Single channel i-V curves determined as described for Fig. 3 (see legend). (B) (left) Macroscopic current traces recorded with 20 ms steps to +100 mV from holding potentials of −100 mV(10.2 μM [Ca]i), −120 mV(124 μM [Ca]i), and −180 mV(490 and 1,000 μM [Ca]i). Each trace represents the average of 4 consecutive traces recorded under identical conditions. (right) The peak amplitudes of the currents displayed in the left panel (○), as well as tail current amplitudes measured 200 μs after repolarization to −80 mV (○) are plotted as a function of [Ca]i. Also plotted as a function of [Ca]i is the single channel current amplitude at +100 mV (•). In these plots the data have been normalized to their values at 10.2 μM [Ca]i. The differences between currents measured at 10.2 μM and those measured at 1,000 μM [Ca]i (+100 mV) were: 22% peak, 20% single channel, 4% tail.
Figure 5
Figure 5
(A) (left) Macroscopic mslo conductance vs. voltage (G-V) relations determined with 0.84, 10.2, 124, and 1,000 μM [Ca]i. The data are from a single membrane patch. G-V curves were constructed from tail currents amplitudes measured 200 μs after repolarization to −80 mV. These curves were then fitted with the function G = G max(1/(1 + e−(V − V1/2)zF/RT), and each curve was normalized to the maximum of its fit (solid lines). Fit parameters are as follows: [Ca]i 0.84 μM V1/2 = 99 mV, z = 1.80; [Ca]i 10.2 μM V1/2 = 28.2 mV, z = 1.44; [Ca]i 124 μM, V1/2 = −16.7 mV, z = 1.27; [Ca]i 1,000 μM V1/2 = −41.8 mV, z = 1.18. (right) Peak I-V curves determined from the same data as in the left panel. Current values for 1,000 μM [Ca]i (open bow ties) were adjusted to compensate for the fast blocking effect of Ca2+ (filled bow ties) by multiplying each data point by the ratio of the single channel current measured at 10.2 μM [Ca]i to that measured at 1,000 μM [Ca]i (Fig. 4). (B) (left) mslo currents recorded with voltage steps to +200 mV with 0.84 and 124 μM [Ca]i. Holding potentials were −50 and −120 mV, respectively. Repolarizations were to −80 mV. (right) I-V curves determined from the current level at the end of 20 ms voltage steps to membrane potentials ranging between −120 and +200 mV. The data in both panels of B are from the same membrane patch. [Ca]i for each panel of the figure are as designated in the right panel of A.
Figure 6
Figure 6
Effect of (+)-18-crown-6-tetracarboxylic acid (18C6TA) on macroscopic mslo currents. The membrane patch was depolarized from −100 mV to more depolarized voltages as indicated before (black trace), during (gray or dashed trace) and after (black trace) treatment with 50 μM 18C6TA. Depolarizing steps were 100 ms in duration. [Ca]i was 10.2 μM. Repolarizing steps were to −80 mV. On the right tail currents from each experiment on the left have been expanded to show the effect of 18C6TA on tail current amplitudes.
Figure 7
Figure 7
Macroscopic mslo I-V relations recorded in the presence of (+)-18-crown-6-tetracarboxylic acid (18C6TA). Currents were determined at the end of 20-ms depolarizations to the indicated test potentials. [Ca]i are as indicated. Data are from the same membrane patch.
Figure 8
Figure 8
Single mslo channels reach high open probabilities with depolarization over a wide range of [Ca]i. Current traces recorded from a single channel patch with 0.84, 10.2, and 124 μM [Ca]i. Voltages were +150, +110, and +90 mV as indicated. Traces without apparent long shut events were selected. Open probability is indicated to the right of each trace. The channel closes downward. Dashed lines indicate the zero-current level. The data were filtered at 8 kHz.
Figure 9
Figure 9
The effects of (+)-18-crown-6-tetracarboxylic acid (18C6TA) on mslo G-V and Tau-V relations. Normalized conductance vs. voltage relations as well as time constant of activation vs. voltage relations were determined at (A) 0.84, (B) 1.7, and (C) 4.6 μM [Ca]i before (○), during (•), and after (▵) treatment with 50 μM 18C6TA. (left) Normalized conductance vs. voltage relations were determined from the amplitude of tail currents measured 200 μs after repolarization to −80 mV from the indicated test potentials. Each curve was fitted with a Boltzmann function of the form G = G max(1/(1 + e−(V − V1/2)zF/RT), and then normalized to the maximum of the fit. (right) The time course of activation at each test potential was fitted with a single exponential function and the time constants from these fits are plotted as a function of test potential. Parameters for the Boltzmann fits were as follows: A {(○) solid curve V1/2 = +130 mV, z = 1.27; (•) dashed curve V1/2 = +142 mV, z = 1.11; (▵) solid curve V1/2 = +141 mV, z = 1.24}; B {(○) solid curve V1/2 = +122 mV, z = 1.34; (•) dashed curve V1/2 = +120 mV, z = 1.19; (▵) solid curve V1/2 = +122 mV, z = 1.25}; C {(○) solid curve V1/2 = +96.8 mV, z = 1.23; (•) dashed curve V1/2 = +87.4 mV, z = 1.24; (▵) solid curve V1/2 = +88.3 mV, z = 1.29}.

References

    1. Adelman JP, Shen KZ, Kavanaugh MP, Warren RA, Wu YN, Lagrutta A, Bond CT, North RA. Calcium-activated potassium channels expressed from cloned complementary DNAs. Neuron. 1992;9:209–216. - PubMed
    1. Andersen OS. Ion movement through gramicidin A channels. Interfacial polarization effects on single-channel current measurements. Biophys J. 1983a;41:135–146. - PMC - PubMed
    1. Andersen OS. Ion movement through gramicidin A channels. Single-channel measurements at very high potentials. Biophys J. 1983b;41:119–133. - PMC - PubMed
    1. Andersen OS. Ion movement through gramicidin A channels. Studies on the diffusion-controlled association step. Biophys J. 1983c;41:147–165. - PMC - PubMed
    1. Andersen OS, Procopio J. Ion movement through gramicidin A channels. On the importance of the aqueous diffusion resistance and ion-water interactions. Acta Physiol Scand (Suppl) 1980;481:27–35. - PubMed

Publication types