. 1997 May;109(5):647-73.
doi: 10.1085/jgp.109.5.647.

Intrinsic voltage dependence and Ca2+ regulation of mslo large conductance Ca-activated K+ channels

Affiliations

Intrinsic voltage dependence and Ca2+ regulation of mslo large conductance Ca-activated K+ channels

J Cui et al. J Gen Physiol. 1997 May.

Abstract

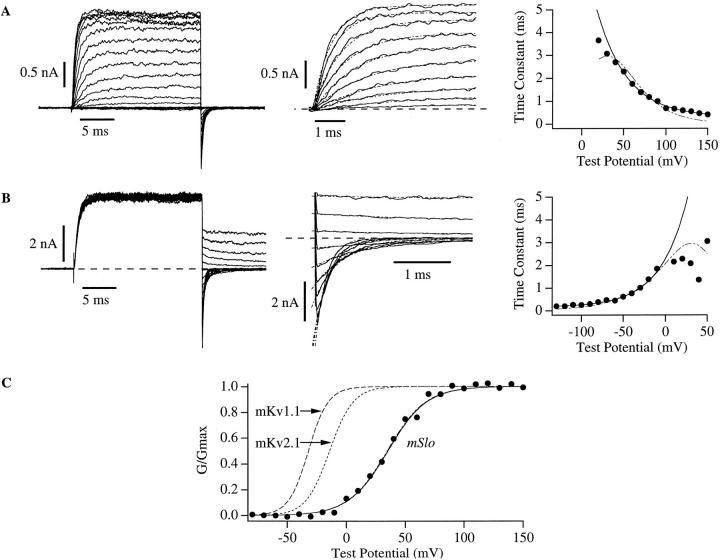
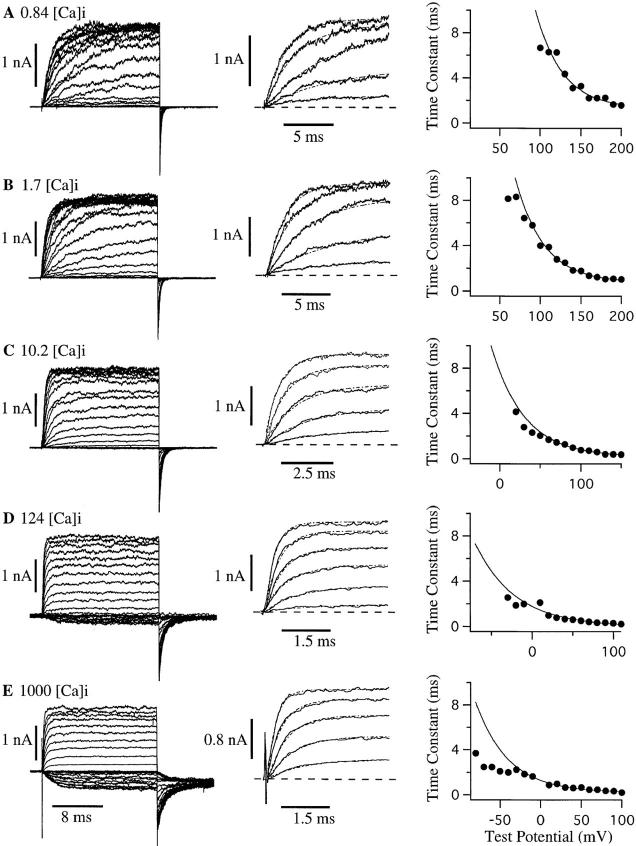
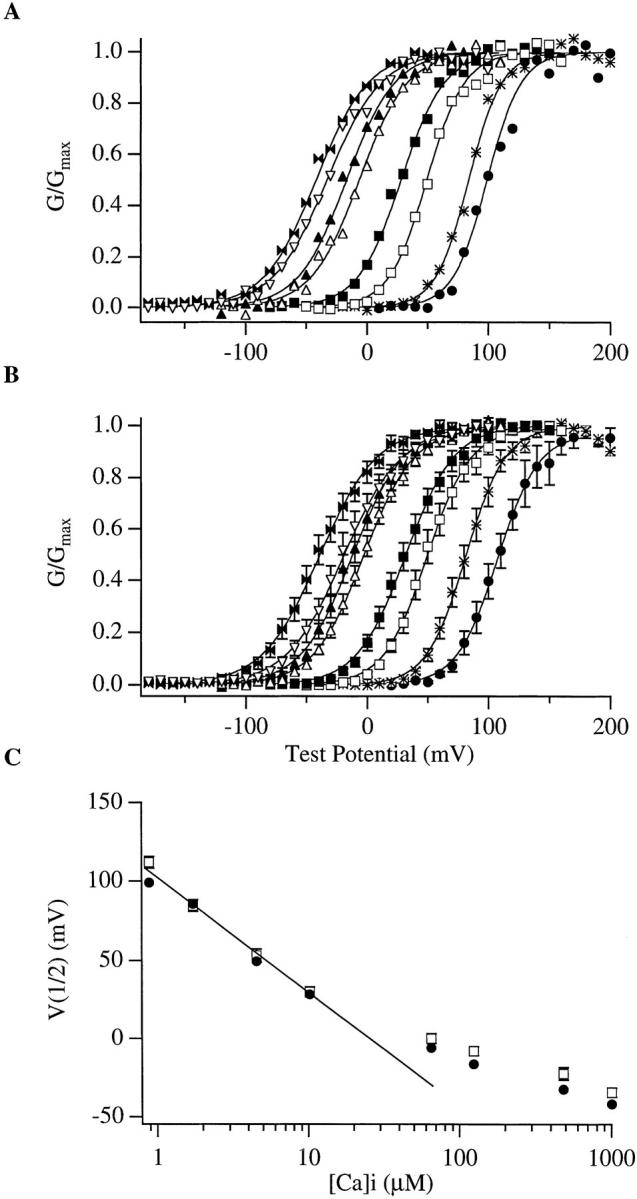
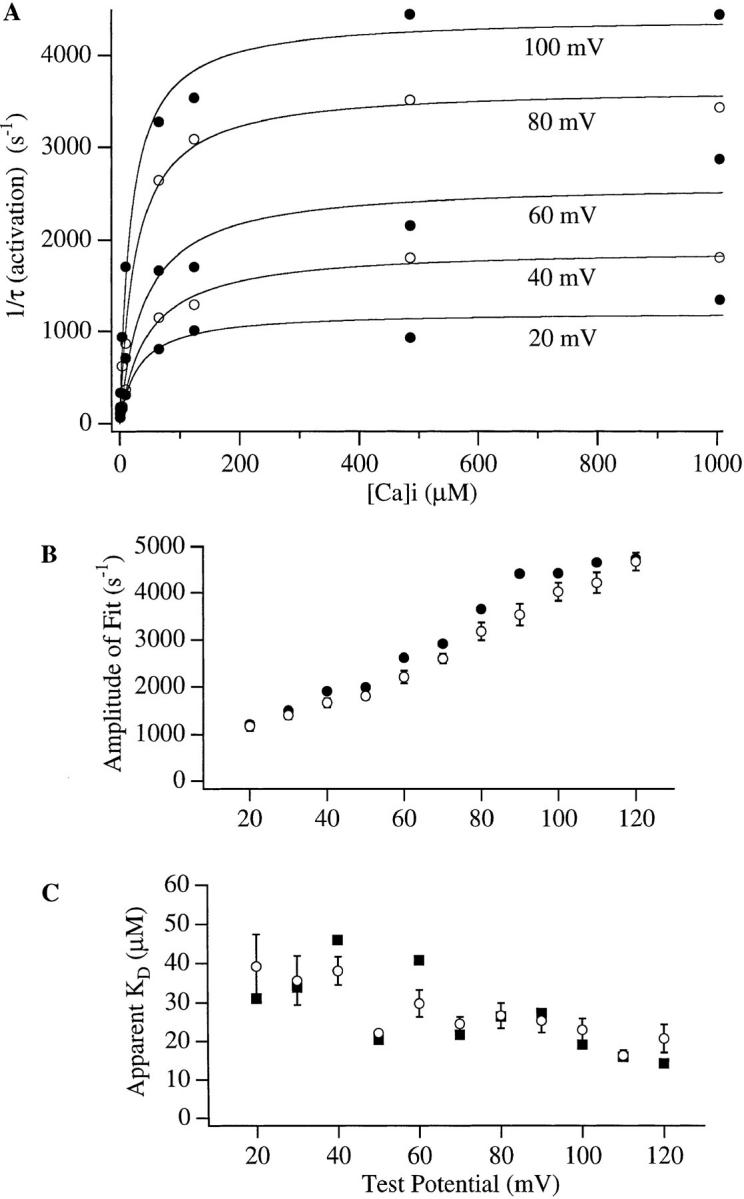
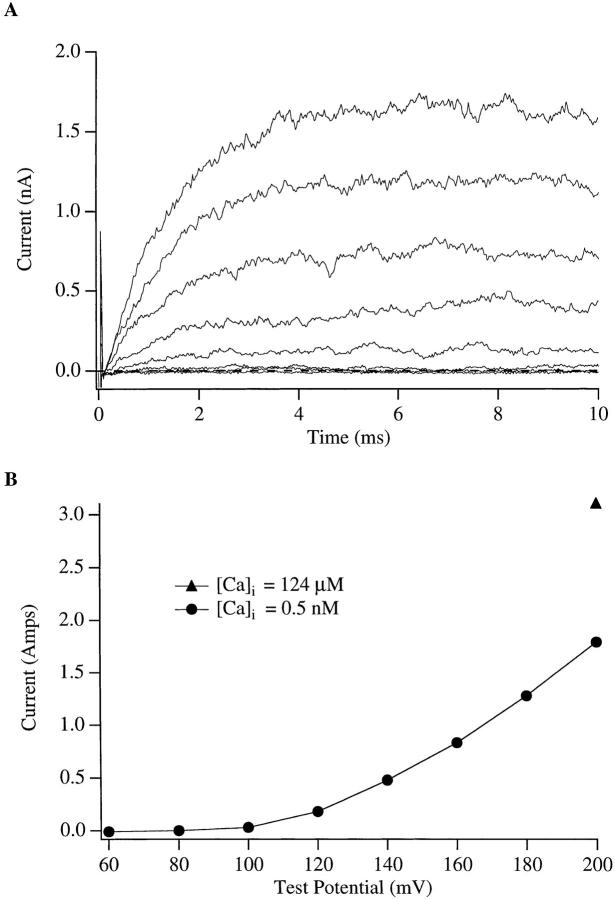
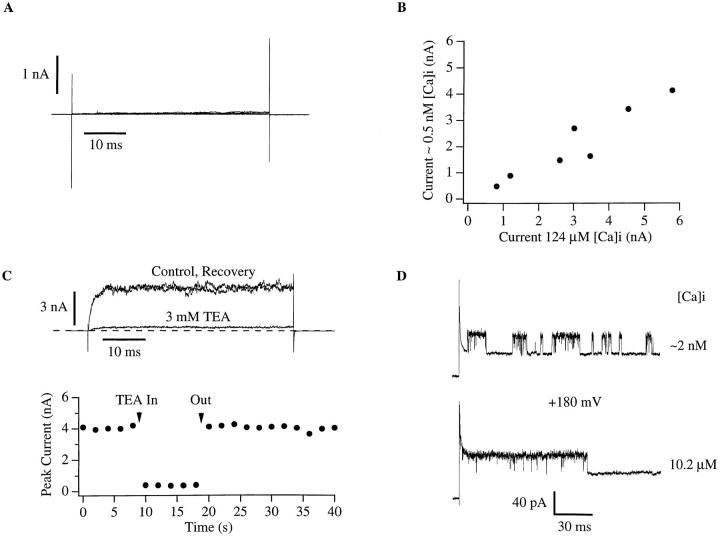
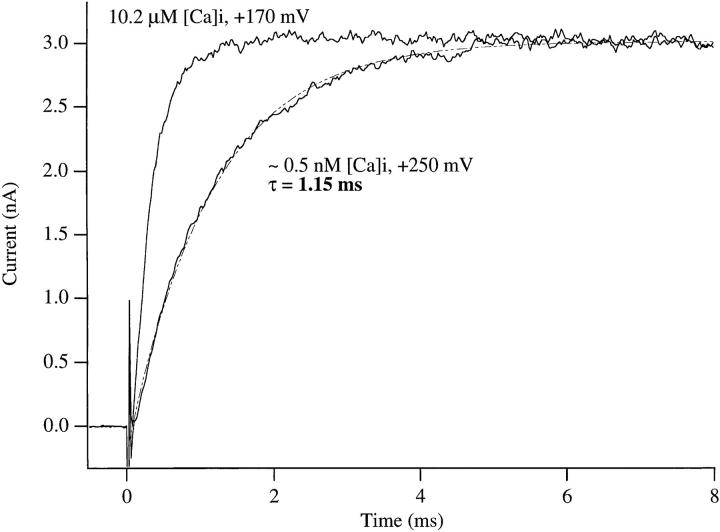
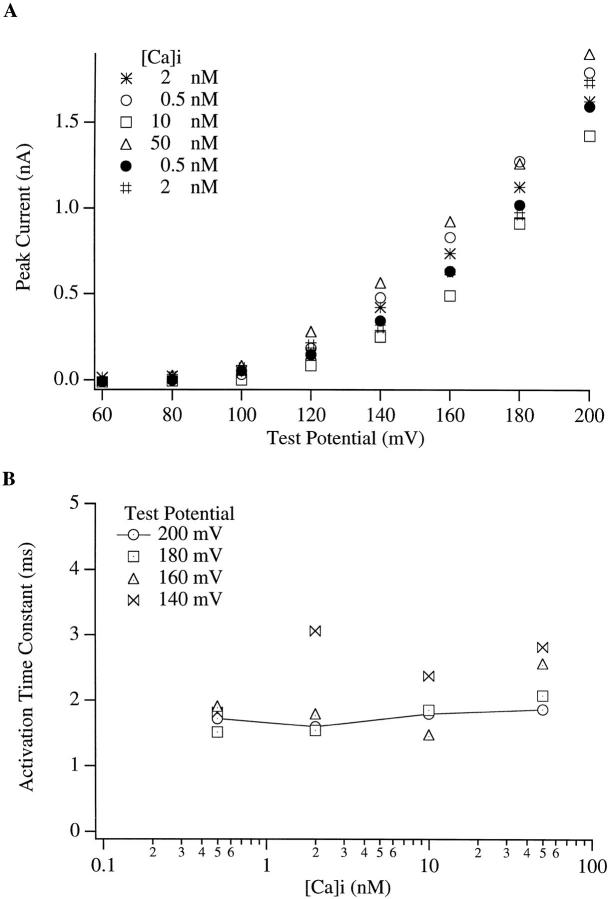
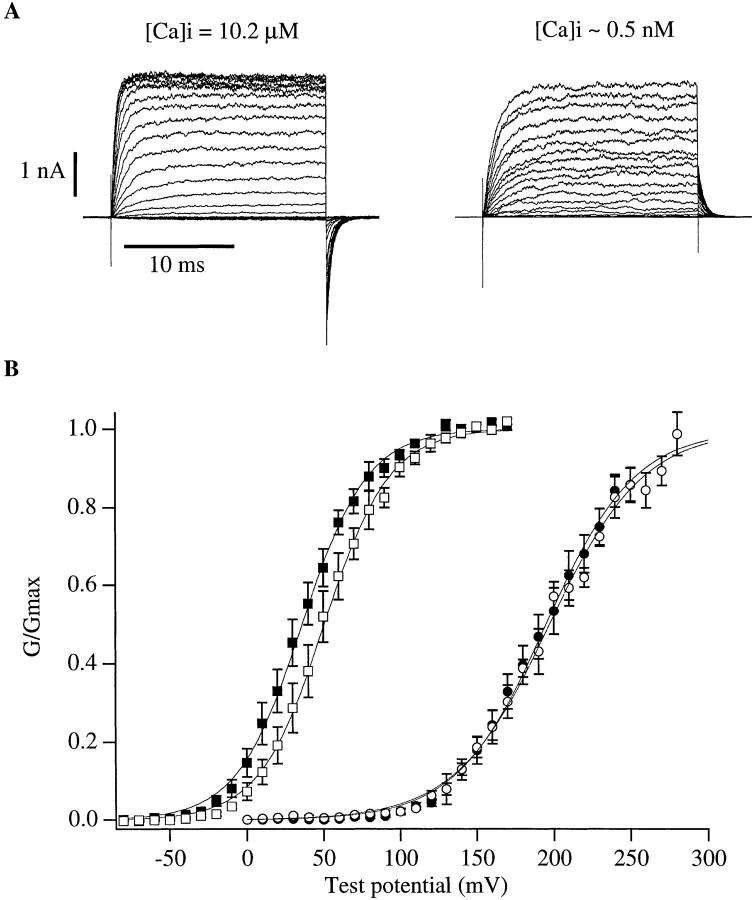
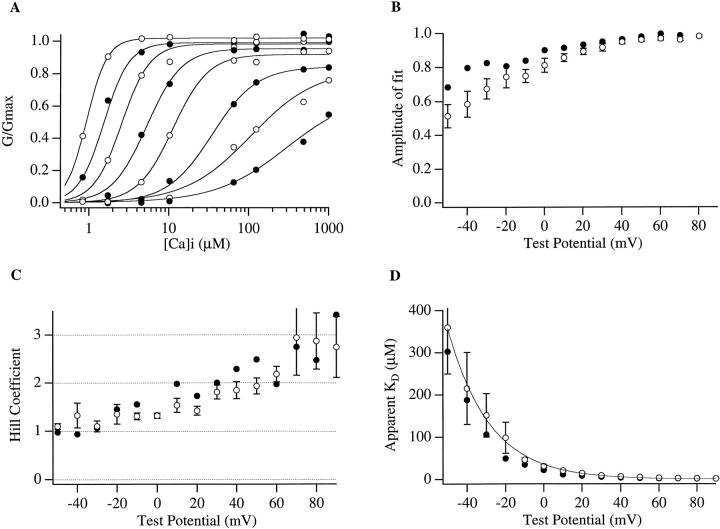
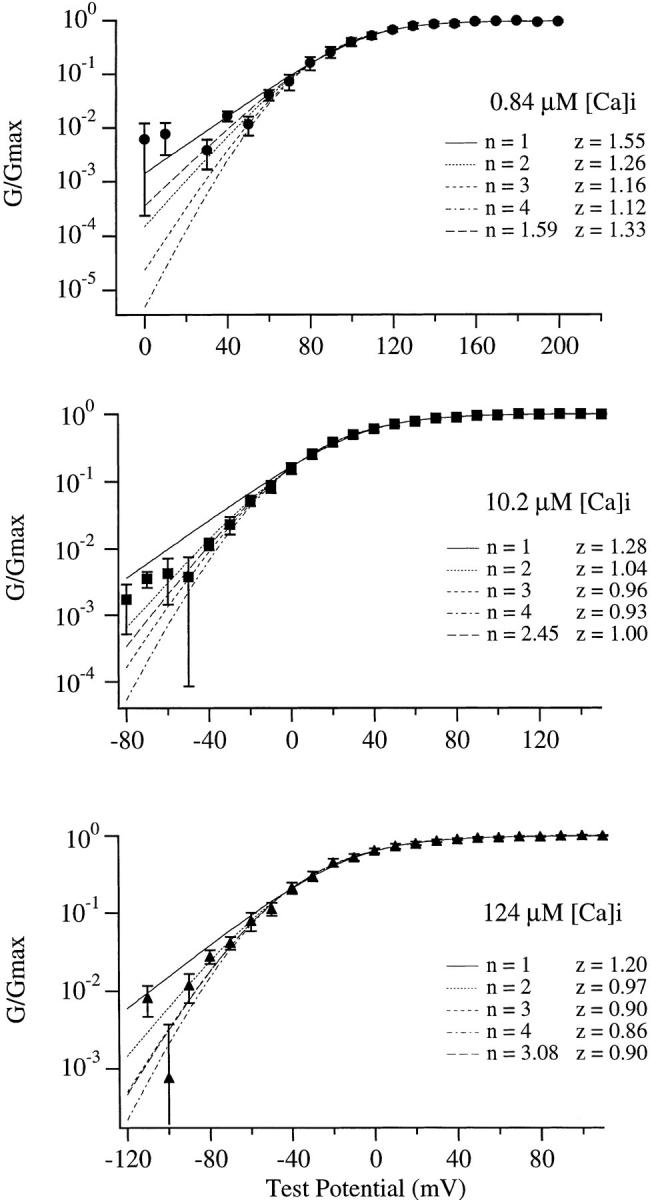
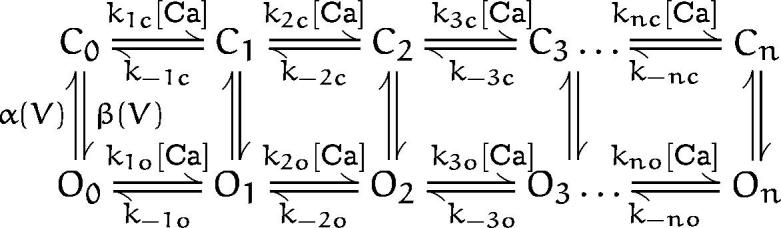
The kinetic and steady-state properties of macroscopic mslo Ca-activated K+ currents were studied in excised patches from Xenopus oocytes. In response to voltage steps, the timecourse of both activation and deactivation, but for a brief delay in activation, could be approximated by a single exponential function over a wide range of voltages and internal Ca2+ concentrations ([Ca]i). Activation rates increased with voltage and with [Ca]i, and approached saturation at high [Ca]i. Deactivation rates generally decreased with [Ca]i and voltage, and approached saturation at high [Ca]i. Plots of the macroscopic conductance as a function of voltage (G-V) and the time constant of activation and deactivation shifted leftward along the voltage axis with increasing [Ca]i. G-V relations could be approximated by a Boltzmann function with an equivalent gating charge which ranged between 1.1 and 1.8 e as [Ca]i varied between 0.84 and 1,000 microM. Hill analysis indicates that at least three Ca2+ binding sites can contribute to channel activation. Three lines of evidence indicate that there is at least one voltage-dependent unimolecular conformational change associated with mslo gating that is separate from Ca2+ binding. (a) The position of the mslo G-V relation does not vary logarithmically with [Ca]i. (b) The macroscopic rate constant of activation approaches saturation at high [Ca]i but remains voltage dependent. (c) With strong depolarizations mslo currents can be nearly maximally activated without binding Ca2+. These results can be understood in terms of a channel which must undergo a central voltage-dependent rate limiting conformational change in order to move from closed to open, with rapid Ca2+ binding to both open and closed states modulating this central step.


Figures

Figure 1
Figure 1
Macroscopic mslo K+ currents recorded from inside out membrane patches during superfusion with 10.2 μM [Ca]i. (A) (left) Current traces were elicited with 20-ms voltage steps to test potentials ranging from −80 to +150 mV in 10-mV increments. Vhold = −100 mV. After depolarization the membrane potential was repolarized to −80 mV. (middle) A subset of traces shown on the left have been expanded (+20 to +110 mV), and their activation time courses fitted with a single exponential function (dashed lines). (right) Plotted are the time constants of fits to the time course of activation as a function of test potential. Data points from +70 mV and more depolarized voltages were fitted with the function τ = Ae −qFV/RT + b (solid line) with q = 0.71 and b = 0.31 ms. (B) (left) A family of tail current traces recorded in response to repolarizations to potentials ranging from −130 and +50 mV in 10 mV increments after 20 ms predepolarizations to +100 mV. (middle) A subset of traces from the left have been expanded (potentials −130 to +50 mV) and fitted with a single exponential function (dashed lines). (right) Time constants of fits to the time course of deactivation as a function of repolarization potential. Data points from −40 mV and more hyperpolarized voltages were fitted with the function τ = Ae qFV/RT + b (solid curve) with q = 0.79 and b = 0.163. In A and B the currents displayed represent the averages of 4 and 2 families recorded in succession respectively. (C) Plotted is relative conductance (G/Gmax) as a function of test potential for the data in A. Relative conductance was determined for each potential by measuring the tail current amplitude 200 μs after repolarization to −80 mV. The data were fitted (solid curve) with the Boltzmann function G = G max{1/[1 + e −(V−V1/2)zF/RT]} with V1/2 = +34.6 mV, z = 1.54 and then normalized to the maximum of the fit. Also included are the G-V relations for the mouse Kv1.1 and Kv2.1 K+ channels. These curves were drawn according to published parameters for single Boltzmann fits (Kv1.1, Grissmer et al., 1994; Kv2.1, Pak et al., 1991). The broken curves in the right most panels of A and B represent fits to scheme SI with α(V) = α(0)e   q f  FV/RT, α(0) = 53 s −1 qf = 0.86; β(V) = β(0)e −qbFV/RT, β(0) = 428 s −1, qb = 0.68. In modeling the parameters were constrained so as to maintain the best fit to the G-V relation (broken curve superimposed on solid curve in C) The data in A and B are from separate patches. In this and subsequent figures dashed horizontal lines represent zero current.
Scheme I
Scheme I
Figure 2
Figure 2
Activation of mslo currents. (A–E) Current traces from a single membrane patch recorded after a series of depolarizations to increasingly more positive membrane voltages. [Ca]i were as indicated (top to bottom) 0.84, 1.7, 10.2, 124, and 1,000 μM. Each series displayed is the average of 4 series recorded consecutively under identical conditions. Depolarizations were for 20 ms. Repolarizations were to −80 mV. In the left panels complete series are displayed. The voltage increment is 10 mV. In the middle panels a subset of traces have been expanded and fitted with single exponential functions (dashed curves). The voltage increment is 20 mV. In the right panels are shown plots of activation time constants as a function of test potential. The later portions of these curves are fitted with the function τ = Ae −qFV/RT + b (solid curves). (A) 0.84 μM [Ca]i, Vhold = −50 mV: (left) depolarizations ranged from 0 to +200 mV. (middle) Depolarizations ranged from +80 to +160 mV; (right) fit parameters: range +130 to 200 mV, q = 0.77, b = 1.3 ms. (B) 1.7 μM [Ca]i, Vhold = −80 mV: (left) depolarizations ranged from −40 to +200 mV in 10-mV increments; (middle) depolarizations ranged from +60 to +140 mV; (right) fit parameters: range +120 to 200 mV, q = 0.76, b = 0.76 ms. (C) 10.2 μM [Ca]i, Vhold = −100 mV: (left) depolarizations ranged from −80 to +150 mV; (middle) depolarizations ranged from +30 to +110 mV; (right) fit parameters: range +90 to +150 mV, q = 0.63, b = 0.16 ms (D) 124 μM [Ca]i, Vhold = −120 mV: (left) depolarizations ranged from −120 to +110 mV; (middle) depolarizations ranged from +10 to +110 mV; (right) fit parameters: range −10 to +110 mV, q = 0.52, b = 0.01 ms. (E) 1,000 μM [Ca]i, Vhold = −180 mV: (left) depolarizations ranged from −180 to +100 mV; (middle) depolarizations ranged from +20 to +100 mV; (right) fit parameters: range −10 to +100 mV q = 0.64, b = 0.23 ms.
Figure 3
Figure 3
Deactivation of mslo currents. (A–E) Tail current families recorded from a single membrane patch. [Ca]i were as indicated (top to bottom): 0.84, 1.7, 10.2, 124, and 1,000 μM. Each family displayed is the average of 4 series recorded consecutively under identical conditions. Depolarizations are for 20 ms. Repolarizations are for 10 ms. In the left panels complete series are displayed. The voltage increment is 10 mV. In the middle panels subsets of traces from the left have been expanded and fitted with single exponential functions (dashed curves). The voltage increment is 20 mV. In the right panels are displayed plots of the deactivation time constant as a function of test potential. The most hyperpolarized portions of these curves are fitted with the function τ = Ae   qF   V/RT+ b (solid curves). (A) 0.84 μM [Ca2+]i: prepulse potential: 180 mV. Test potentials: −50 to 100 mV, q = 0.62, b = 0.069. (B) 1.7 μM [Ca2+]i: prepulse potential: 160 mV. Test potentials: −80 to 70 mV, q = 0.74, b = 0.223. (C) 10.2 μM [Ca2+]i: prepulse potential: 100 mV. Test potentials: −130 to 30 mV, q = 0.67, b = 0.176. (D) 124 μM [Ca2+]i: prepulse potential: 80 mV. Test potentials: −150 to 20 mV, q = 0.68, b = 0.226. (E) 1,000 μM [Ca2+]i: prepulse potential: 50 mV. Test potentials: −200 to −50 mV, q = 0.67, b = 0.163.
Figure 4
Figure 4
Mean activation and deactivation time constant as a function of both voltage and [Ca]i. Displayed are semi-log plots of activation (A) and deactivation (B) time constants. Each curve represents the mean of between 4 and 10 experiments. Error bars indicate standard errors of the mean. Solid lines represent fits to the function τ = Ae −qFV/RT. Fits were done by eye. Fit parameters: (A) [Ca]i = 0.84 μM (•), n = 4, q = 0.46; [Ca]i = 1.7 μM (*), n = 10, q = 0.44; [Ca]i = 4.5 μM (□), n = 9, q = 0.51; [Ca]i = 10.2 μM (▪), n = 7, q = 0.50; [Ca]i = 124 μM (▴), n = 7, q = 0.45; [Ca]i = 1,000 μM (▸◂), n = 5, q = 0.45. (B) [Ca]i = 0.84 μM (•), n = 7, q = −0.48; [Ca]i = 1.7 μM (*), n = 6, q = −0.46; [Ca]i = 4.5 μM (□), n = 7, q = −0.42; [Ca]i = 10.2 μM (▪), n = 10, q = −0.46; [Ca]i = 124 μM (▴), n = 9, q = −0.43; [Ca]i = 1,000 μM (▸◂), n = 10, q = −0.38.
Figure 5
Figure 5
Normalized conductance vs. voltage relations from a single membrane patch (A) and the average of several patches (B) are displayed for the following [Ca]i: 0.84 (•), 1.7 (*), 4.6 (□), 10.2 (▪), 65 (▵), 124 (▴), 490 (▿), 1,000 μM (▸◂). Relative conductance was determined for each test potential by measuring the tail current amplitude 200 μs after repolarization to −80 mV. The data were fitted (solid curve) with the Boltzmann function G = G max(1/(1+e −(V−V1/2)zF/RT)) and then normalized to the maximum of the fit. Curves plotted with filled symbols represent approximately 10-fold increases in [Ca]i, as do curves plotted with open symbols. (C) Plot of the voltage at half maximal activation V1/2 vs. [Ca]i as determined from fits to the data in A (•). Also plotted are the mean V1/2 values from several individual experiments (□). Error bars represent standard error of the mean with n = 11, 13, 11, 16, 10, 15 14, 13 for [Ca]i = 0.84, 1.7, 4.6, 10.2, 65, 124, 490, 1,000 μM, respectively. In A and B the parameters of the fits were as follows: (A) [Ca]i = 0.84 μM, V1/2 = 99.0 mV, z = 1.8; [Ca]i = 1.7 μM, V1/2 = 85.6 mV, z = 1.88; [Ca]i = 4.6 μM, V1/2 = 49.4 mV, z = 1.62; [Ca]i = 10.2 μM, V1/2 = 28.2 mV, z = 1.44; [Ca]i = 65 μM, V1/2 = −6.2 mV, z = 1.27; [Ca]i = 124 μM, V1/2 = −16.7 mV, z = 1.27; [Ca]i = 490 μM, V1/2 = −32.7, z = 1.13; [Ca]i = 1,000 μM, V1/2 = −41.8 mV, z = 1.18. (B) [Ca]i = 0.84 μM, V1/2 = 107 mV, z = 1.52, n = 5; [Ca]i = 1.7 μM, V1/2 = 81.5 mV, z = 1.56, n = 10; [Ca]i = 4.6 μM, V1/2 = 49.6 mV, z = 1.44, n = 9; [Ca]i = 10.2 μM, V1/2 = 32.0 mV, z = 1.27, n = 7; [Ca]i = 65 μM, V1/2 = −2.7 mV, z = 1.24, n = 8; [Ca]i = 124 μM, V1/2 = −11.8 mV, z = 1.20, n = 7; [Ca]i = 490 μM, V1/2 = −19.4, z = 1.09, n = 8; [Ca]i = 1,000 μM, V1/2 = −38.9 mV, z = 1.08, n = 5.
Figure 6
Figure 6
Ca dependence of mslo currents. (A) Current traces recorded during 20-ms depolarizations to +70 mV at a series of [Ca]i. [Ca]i are, in alphabetical order: 0.84, 1.7, 4.5, 10.2, 124, 1,000 μM. In (B) several of the currents from A have been normalized to their maximum and superimposed for comparison. Also displayed are single exponential fits to the time course of activation (dashed lines). (C) Tail currents were recorded at −80 mV after 20-ms voltage steps to +100 mV. These currents were then normalized to their minimums and superimposed. [Ca]i are as indicated. Also displayed are single exponential fits to the time course of deactivation (dashed lines). In (D) the fraction of channels activated in A is plotted as a function of [Ca]i. Normalized conductances (G/Gmax) were derived from conductance-voltage relations determined at each [Ca]i from tail current measurements as described for Fig. 5. The data are fitted (solid curve) to the equation: G/G max = Amp(1/{1+(K D/[Ca])n}) with the following parameters (Amp = 0.99, K D = 1.44 μM, n = 3.08). In E and F the macroscopic rate constants for current activation E and deactivation F, as determined from single exponential fits, are plotted as a function of [Ca]i. In E the data are fitted with two functions. The solid curve represents a fit to Eq. 3 with α = 2.88 ms−1, k −1/k 1 = 20.8 μM, and β = 0. The dashed curve represents a fit to Eq. 4 with α = 2.89 ms−1, k −1/k 1 = 20 μM, β = 0.3, and k −3/k 3 = 10 μM. In F the data are fitted with Eq. 4 with α = 0.74 ms−1, k −1/k 1 = 20 μM, β = 3.40, and k −3/k 3 = 10 μM.
Scheme II
Scheme II
Scheme III
Scheme III
Scheme IV
Scheme IV
Figure 7
Figure 7
(A) The mslo macroscopic activation rate constant (1/ time constant) is plotted as a function of [Ca]i for several different membrane voltages. Data are from a single membrane patch. Macroscopic rate constants were determined from exponential fits to the time course of activation. Voltages descend from top to bottom as indicated. Alternating open and closed markers have been used for ease of distinguishing data at differing voltages. Each data set has been fitted (solid curve) with the function 1/τ = Amp/{1+(K D/ [Ca]i)}. To minimize the effects of outlying points an absolute, sum of squares criteria was used in fitting. The parameters from these fits, Amp (maximum macroscopic rate constant), and K D (apparent Ca2+ dissociation constant) are plotted as a function of membrane voltage in B and C (•). Also included in B and C are mean values from 5 experiments (○). Error bars represent standard errors of the mean.
Figure 8
Figure 8
mslo currents at very low [Ca]i. (A) Currents were elicited with depolarizing steps to test potentials ranging from +60 to +200 mV in 20-mV increments. Vhold = −50 mV. Included in the internal solution was 5 mM EGTA. No HEDTA or Ca2+ was added. The calculated free [Ca]i in this solution was ∼0.5 nM assuming contaminant Ca2+ of 10 to 20 μM (see materials and methods). The traces displayed are the average from 5 series recorded consecutively. (B) Peak current values from the data in A are plotted as a function of membrane voltage (•). Also included is the peak current measured from the same patch with a step to +200 mV while the patch was superfused with 124 μM [Ca]i (▴).
Figure 9
Figure 9
Currents recorded at high voltage and very low [Ca]i are passing through mslo channels. (A) Control currents recorded from an oocyte not injected with RNA. Currents shown were elicited with 50-ms voltage steps to potentials ranging from +60 to +200 mV in 20-mV increments. Vhold = −50 mV. (B) Correlation between the amplitudes of mslo currents recorded from the same patches with ∼0.5 nM (ordinate) or 124 μM (abscissa) [Ca]i. Each symbol represents an individual experiment. Amplitudes were measured at the end of 50-ms depolarizations to +200 mV. Vhold = −50 mV (0.5 nM [Ca]i); Vhold = −120 mV (124 μM [Ca]i). (C) Current traces recorded from an outside out membrane patch with voltage steps to from −50 to +200 mV before (control), during (3 mM TEA), and after (recovery) exposure of the external surface of the patch to 3 mM TEA. In the lower panel the time course of TEA block is displayed. Data points were recorded at 2-s intervals. (D) Single channel current traces recorded from inside out membrane patches pulled from oocytes injected with a low concentration of mslo RNA, at ∼2 and 10.2 μM [Ca]i. Voltage steps were to +180 mV.
Figure 10
Figure 10
Rapid activation of mslo currents at very low [Ca]i. The two current traces displayed were recorded from the same membrane patch with 10.2 μM and ∼0.5 nM [Ca]i (5 mM EGTA no added Ca2+) as indicated. The traces shown represent the average of 5 (10.2 μM [Ca]i) and 8 (∼0.5 nM [Ca]i) traces recorded in consecutive current families. Voltage steps were from −100 to +170 mV at 10.2 μM [Ca]i, and from 0 to +250 mV at ∼0.5 nM [Ca]i. The ∼0.5 nM [Ca]i trace was fitted with a single exponential function with a time constant of 1.15 ms. The fit is superimposed on the data (dashed line).
Figure 11
Figure 11
mslo currents are insensitive to changes in [Ca]i in the low nanomolar range. (A) mslo currents recorded from a single membrane patch at the indicated [Ca]i. Internal solutions were prepared from the standard solution as follows: 0.5 nM (no added Ca2+, 5 mM EGTA), 2 nM (no added Ca2+, 1 mM EGTA), 10 nM (0.28 mM added CaCl2, 5 mM EGTA), 50 nM (1.18 mM added CaCl2, 5 mM EGTA). The order of solution presentation was as follows 2 nM (*), 0.5 nM (○), 10 nM (□), 50 nM (▵), 0.5 nM again (•), 2 nM again (#). (B) Time constants of activation for currents in A are plotted as a function [Ca]i. Each symbol represents data from a different test potential as indicated. The data points at +200 mV have been connected (solid line). Time constants were determined by fitting the time course of activation with a single exponential function.
Figure 12
Figure 12
(A) mslo current families recorded from the same membrane patch at 10.2 μM and ∼0.5 nM [Ca]i. Each family displayed is the average of 5 (10.2 μM) and 8 (∼0.5 nM) families recorded in succession. (B) Mean mslo G-V curves recorded from 6 membrane patches with 10.2 μM [Ca]i before (▪) and after (□) superfusion with ∼0.5 nM [Ca]i (•). In three patches current families were determined with ∼0.5 nM [Ca]i with voltages up to +280 mV (○). Error bars represent standard errors of the mean. G-V curves were fit with the Boltzmann function G = G max(1/ {1+e −(V−V1/2)zF/RT}) and then normalized to the maximum of the fit. Fit parameters were as follows: (▪) V1/2 = 36 mV, z = 1.18; (□) V1/2 = 50 mV, z = 1.19; (•) V1/2 = 195 mV, z = 0.87; (○) V1/2 = 197 mV, z = 0.83.
Figure 13
Figure 13
Ca-dependence of mslo currents. (A) Conductance vs. voltage (G-V) relations at the following [Ca]i: 0.84, 1.7, 4.5, 10.2, 65, 124, 490, 1,000 μM where constructed from tail current amplitudes measured 0.2-ms after repolarization from the appropriate test potential to −80 mV. Each G-V curve was then fitted with a Boltzmann function and normalized to the maximum of the fit. These data were transformed to dose-response form for each voltage and displayed in A. Smooth curves represent fits to the Hill equation G/G max = Amp/{1+(K D/[Ca])n}, were n = Hill coefficient, and K D = apparent Ca2+ dissociation constant. Voltages descend from left to right starting at +90 mV and ending at −50 mV in 20-mV increments. Alternating open and closed markers have been used for ease of distinguishing data at differing voltages. The data are from the same membrane patch. In (B ) the amplitudes of each fit in A are plotted as a function of voltage. In (C) Hill coefficients, and in (D) apparent dissociation constants determined from the curves in A are also plotted as a function of voltage. In B, C, and D closed circles represent parameters determined from the fits in A. Open circles represent the mean values from 5 experiments. The mean data in D have been fitted (solid line) with the function K D(V) = K D(0)e −zFV/RT with KD(0) = 35.2 μM and z = 1.18. Error bars indicate standard errors of the mean.
Figure 14
Figure 14
mslo G-V relations fitted with Boltzmann functions raised to powers between 1 and 4. Displayed are semi-log plots of the mslo G-V relation determined with 0.84 (A), 10.2 (B), and 124 (C) μM [Ca]i. Each data set represents the mean of from 5 to 8 experiments. These data are the same as that displayed in Fig. 5 B. Each curve has been fitted with the function G/G max = A[1/ (1+e −(V−V1/2)zF/RT)]n . Curves corresponding to the best fit with n = 1, 2, 3, and 4 have been superimposed on the data. For each [Ca]i a fit with n varying freely is also displayed. The line type indicating n, as well as the fit parameter z, are as indicated on the figure.
Scheme VI
Scheme VI
Scheme V
Scheme V

References

    1. Adair GS. The hemoglobin system. VI. The oxygen dissociation curve of hemoglobin. J Biol Chem. 1925;63:529–545.
    1. Adelman JP, Shen KZ, Kavanaugh MP, Warren RA, Wu YN, Lagrutta A, Bond CT, North RA. Calcium-activated potassium channels expressed from cloned complementary DNAs. Neuron. 1992;9:209–216. - PubMed
    1. Aggarwal SK, MacKinnon R. Contribution of the S4 segment to gating charge in the shaker K+channel. Neuron. 1996;16:1169–1177. - PubMed
    1. Art JJ, Wu YC, Fettiplace R. The calcium-activated potassium channels of turtle hair cells. J Gen Physiol. 1995;105:49–72. - PMC - PubMed
    1. Atkinson NS, Robertson GA, Ganetzky B. A component of calcium-activated potassium channels encoded by the Drosophila slolocus. Science (Wash DC) 1991;253:551–555. - PubMed

Publication types