. 1997 May 27;94(11):5691-6.
doi: 10.1073/pnas.94.11.5691.

Developmental parameters of cell death in the wing disc of Drosophila

Affiliations

Developmental parameters of cell death in the wing disc of Drosophila

M Milán et al. Proc Natl Acad Sci U S A. .

Abstract

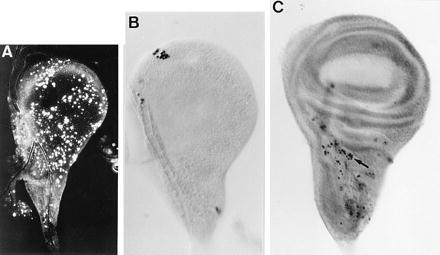
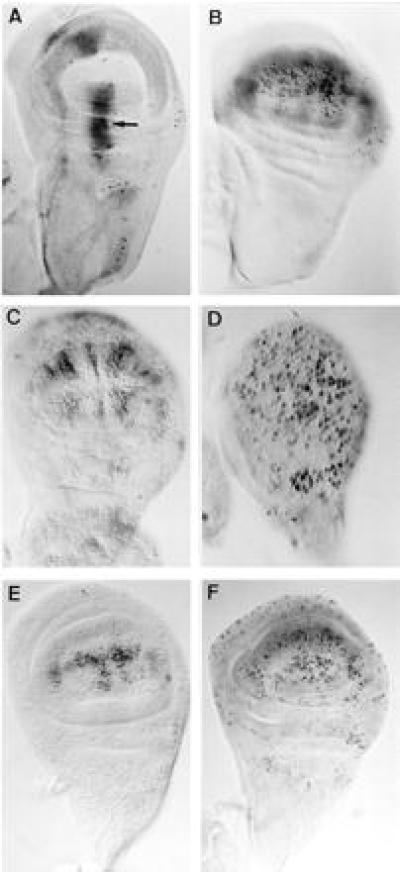
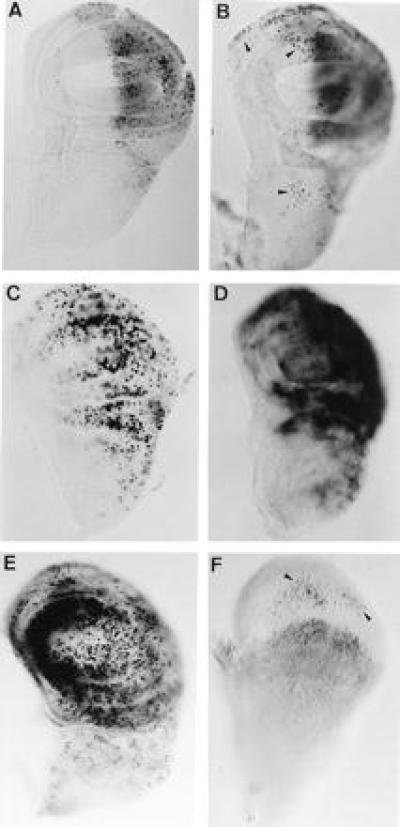
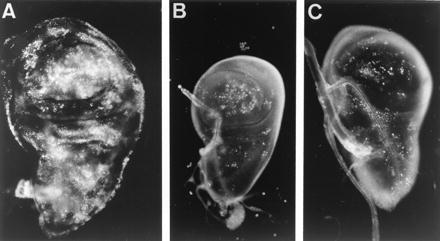
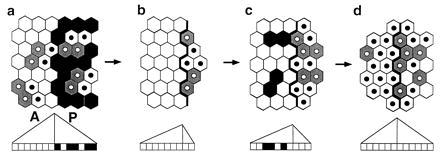
Apoptotic cell death in wing imaginal discs takes place in single cells or small clusters of neighboring cells. These cells are distributed throughout the anlage at early stages and in recognizable territories at late larval and pupal stages. Apoptotic cells remain in the epithelium 2-4 h, prior to being engulfed in place by hemolymph cells. Experimentally induced apoptosis in single cells or territories is accompanied by nonautonomous death of adjacent cells and of cells further away in adjacent territories. These effects are followed by changes in cell proliferation in both territories. Apogenetic mosaics in mutant discs show cell death throughout the anlage. Apoptosis provides a mechanism, in addition to cell proliferation control, for matching territories with different positional values or different genetic specifications.


Figures

Figure 1
Figure 1
Patterns of apoptotic cells in wild-type wing discs. Apoptotic cells were identified by acridine orange staining (A) and TUNEL method (B and C). (A) High frequency of apoptotic cells in a wing disc from an early third instar larva immediately after the second molt. (B) Imaginal wing disc from early third instar larva. Note the cluster of apoptotic cells. (C) Distribution of apoptotic cells in late third instar wing disc. Arrow points to a cluster of apoptotic cells at the wing/notum border region. All discs are reproduced at the same magnification. In all figures anterior is to the left and ventral is up.
Figure 2
Figure 2
(A and B) Targeted induction of cell death in GAL4; UAS-lacZ; UAS-RAcs wing discs. Larvae were grown at 31°C during 8 h and labeled by 4-bromo-3-chloro-2-indolyl β-d-galactoside staining (light gray staining) and TUNEL (black dots). (A) 734-GAL4; UAS-lacZ; UAS-RAcs. (B) Sd-GAL4; UAS-lacZ; UAS-RAcs. Arrow in A points to a cluster of dead cells. (C–F) Response of imaginal disc cells to induction of apoptosis. (C) Imaginal wing disc from a late third instar HS-hid larva stained with TUNEL 45 min after a pulse of 30 min at 37°C. (D–F) T(2, 3) SM6a-TM6b/+ early third instar (D) and late third instar (E, F) wing discs irradiated at a dose of 1,000 rads and stained by TUNEL 8 h (D and E) or 24 h (F) thereafter. (D is twice magnified.)
Figure 3
Figure 3
Autonomous and nonautonomous induction of cell death and subsequent cell proliferation recovery. Imaginal wing discs from en-GAL4/UAS-lacZ; UAS-RAcs (A–E) and ap-GAL4; UAS-lacZ; UAS-RAcs (F) larvae. Larvae grown at 31°C during 24 h were stained with TUNEL and 4-bromo-3-chloro-2-indolyl β-d-galactoside immediately after a switch to 17°C (A) or after 24 h at 17°C (B and F). Note in B and F the presence of apoptotic cells (some of them are indicated by arrowheads) in the region not expressing lacZ (gray staining). (C and E) BrdUrd incorporation and (D) in situ hybridization with a stg probe in larvae grown at 31°C during 24 h and stained immediately after the switch (C and D) or after 8 h at 17°C (E).
Figure 4
Figure 4
Apoptosis, visualized by acridine orange staining, in late third instar CbxM1/+ (A) and dppd5 (C) wing discs, and bx34e haltere disc (B).
Figure 5
Figure 5
Apoptosis and cell proliferation patterns during accommodation. Ricin induced apoptosis (black cells in a) in the P compartment of the wing disc is followed (b–d) by increased cell proliferation in this territory and nonautonomous proliferation arrest in G1 (white cells) and cell death (black cells) in the A compartment. Gray cells and black nuclei correspond to stg expressing and S-phase cells, respectively. Below each figure, a representation of positional values in a gradient with relative maxima at the compartment borders is shown. Notice the change of slope of positional values during the accommodation process in both compartments.

References

    1. Jacobson M D, Weil M, Raff M C. Cell. 1997;88:347–354. - PubMed
    1. Raff M C. Nature (London) 1992;356:397–400. - PubMed
    1. Wolff T, Ready F. Development (Cambridge, UK) 1991;113:825–839. - PubMed
    1. White K, Grether M E, Abrams J M, Young L, Farrell K, Steller H. Science. 1994;264:677–683. - PubMed
    1. Grether M E, Abrams J M, Agapite J, White K, Steller H. Genes Dev. 1995;9:1694–1708. - PubMed

Publication types

LinkOut - more resources