. 1997 May 27;94(11):5917-22.
doi: 10.1073/pnas.94.11.5917.

Neurotrophin regulation of ionic currents and cell size depends on cell context

Affiliations

Neurotrophin regulation of ionic currents and cell size depends on cell context

N T Sherwood et al. Proc Natl Acad Sci U S A. .

Abstract

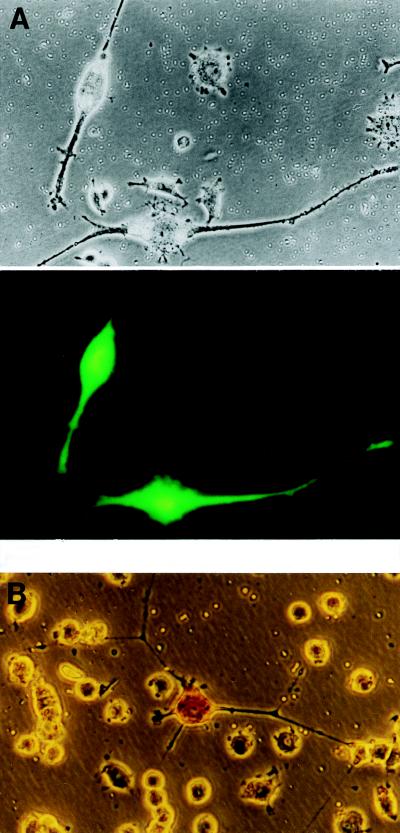
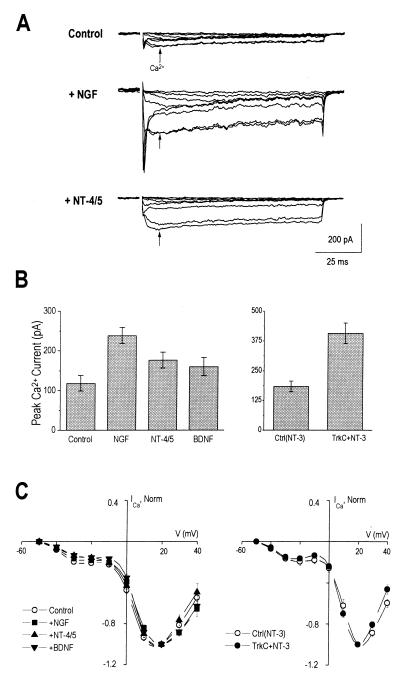
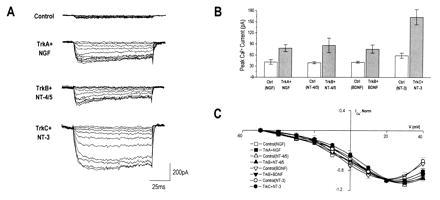
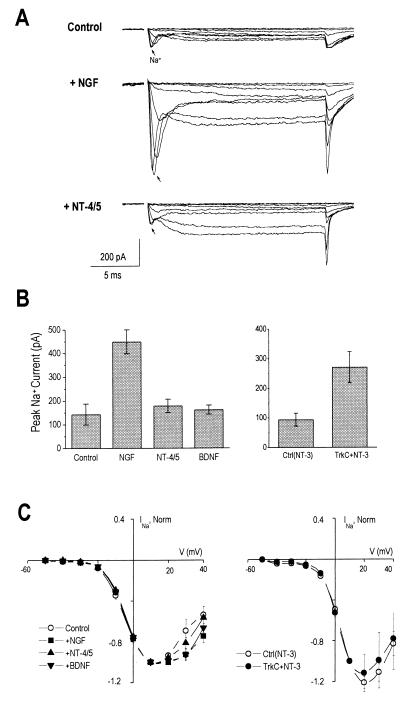
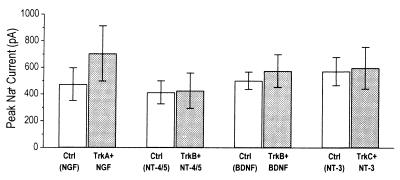
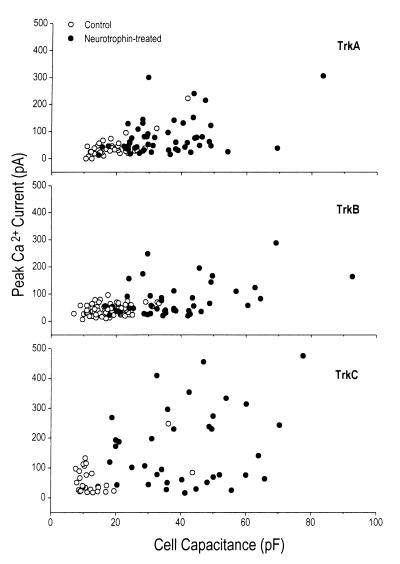
Trk receptor activation by neurotrophins is often considered to have a defined set of actions on target neurons, including supporting neuronal survival, inducing morphological differentiation, and regulating a host of target genes that specify neuronal phenotype. It is not known if all such regulatory effects are obligatory, or if some may vary depending on the cell context in which the receptors are expressed. We have examined this issue by comparing neurotrophin effects on the regulation of electrical excitability and morphological differentiation in two strains of PC12 cells. We found that while neurotrophins induced neurite extension and increased calcium currents in both PC12 cell types, sodium current levels were regulated in only one of these strains. Moreover, we found little correlation between calcium current levels and the extent of morphological differentiation when compared in individual cells of a single strain. Thus, the regulatory effects of neurotrophins on cell phenotype are not fully determined by the Trk receptors that they activate; rather, they can vary with differences in cell context that arise not only between different cell lineages, but also between individual cells of clonal relation.


Figures

Figure 1
Figure 1
trkC transfection confers NT-3 responsiveness to PC12trkB and PC12nnr5 cells. (A) (Upper) NT-3 treatment caused extensive neurite and cell body growth in PC12trkB cells transfected with trkC. Untransfected cells in the field were unable to respond to NT-3, remaining small and spherical. (Lower) Cotransfection with GFP confirmed that only trkC-transfected cells responded to NT-3 treatment. (B) PC12nnr5 cells transfected with trkC extend long neurites in response to NT-3. Transfected cells stained with an antibody to TrkC (note dark cell body of the neurite-bearing cell), while nontransfected cells remained small and round.
Figure 2
Figure 2
Neurotrophins increase voltage-gated calcium currents in PC12trkB cells, but do not affect the relative contribution of different calcium current subtypes. (A) Whole-cell calcium currents (arrows) were easily distinguished from sodium currents by their slow activation kinetics and little inactivation. Representative traces show increased calcium currents in neurotrophin-treated cells compared to controls. Currents were elicited by voltage steps to between −50 and +20 mV in 10 mV increments from a prepulse of −120 mV. Traces were digitally filtered at 400 Hz. (B) Average peak calcium currents increased following treatment with (Left) NGF, NT-4/5, and (Right) NT-3. NGF increased peak calcium currents 2.0-fold over controls (NGF-treated, 0.24 ± 0.02 nA, n = 31; controls, 0.12 ± 0.02, n = 22; P < 5 × 10⁻⁴). NT-4/5 increased calcium currents by 1.5-fold (0.18 ± 0.02, n = 18, P < 0.05), but BDNF had no significant effect (0.16 ± 0.02, n = 20, P > 0.15). NT-3 also increased calcium currents in trkC-transfected cells, by 2.2-fold (0.41 ± 0.04, n = 33) compared to controls (0.18 ± 0.02, n = 19, P < 5 × 10⁻⁴). (C) Normalized current–voltage (I–V) relations for calcium currents were indistinguishable between control and neurotrophin-treated groups. Superposition of NGF- and NT-4/5 with BDNF-treated groups and controls (Left), as well as trkC plus NT-3 cells with their associated controls (Right) indicated that although neurotrophins increased current amplitude, overall voltage dependence of calcium currents were unchanged. The estimated contribution of low voltage activated (LVA)-type calcium current relative to total current, measured by the ratio of current at −20 mV to +20 mV, was 0.2 in all cases. Averaged I–V relations for each group were normalized to peak current levels at +20 mV; mean ± SE are shown.
Figure 3
Figure 3
Neurotrophins regulate the level, but not the voltage dependence, of calcium currents in trk-transfected PC12nnr5 cells. (A) PC12nnr5 cells were transfected with trkA, trkB, or trkC and treated with NGF, NT-4/5 or BDNF, or NT-3, respectively. Representative calcium currents are shown for control and neurotrophin-treated cells, elicited by voltage steps to between −50 and +40 mV in 10 mV increments from a prepulse of −120 mV. (B) Average peak calcium currents increased 2- to 3-fold in response to all of the neurotrophins. Mean currents (±SE, pA): TrkA plus NGF, 79 ± 9 (n = 53), controls 41 ± 6 (n = 38); TrkB plus NT-4/5, 86 ± 20 (n = 15), controls, 39 ± 3 (n = 30); TrkB plus BDNF, 76 ± 11 (n = 28), controls, 41 ± 3 (n = 56); TrkC plus NT-3, 162 ± 20 (n = 39), controls, 59 ± 7 (n = 46). All paired P values <0.005. (C) Averaged calcium I–V relations (normalized to peak current at +20 mV) revealed no significant differences between control (open symbols) and transfected, neurotrophin-treated cells (filled symbols). As in PC12trkB cells, the estimated contribution of LVA-type calcium current at −20 mV, relative to total calcium current at +20 mV, was ≈0.2 for all groups.
Figure 4
Figure 4
NGF and NT-3 increase sodium currents in PC12trkB cells, but do not affect the voltage dependence of the currents. (A) Whole-cell currents were recorded on a fast time scale to analyze sodium currents (arrows), elicited as in Fig. 2A. Traces were digitally filtered at 2 kHz. (B Left) NGF increased average peak sodium currents by 3.1-fold (mean ± SE, nA: 0.45 ± 0.05, n = 32) relative to untreated cells (0.14 ± 0.04, n = 21, P < 10−4). Neither NT-4/5 (0.18 ± 0.03, n = 16) nor BDNF (0.16 ± 0.02, n = 22), however, affected sodium current levels significantly (p > 0.5). (Right) NT-3 increased peak sodium currents by 2.9-fold in trkC-transfected PC12trkB cells (0.27 ± 0.05, n = 21), relative to controls (0.09 ± 0.02, n = 18, P < 5 × 10⁻³). (C) Averaged I–V relations for sodium currents (normalized to peak current at +10 mV) were not affected by neurotrophin treatment.
Figure 5
Figure 5
Sodium currents are not regulated by neurotrophins in PC12nnr5 cells. No significant differences in average peak sodium currents were observed between any of the trk-transfected, neurotrophin-treated PC12nnr5 cells (filled bars) and their controls (open bars). Mean currents ± SE (nA) are as follows: TrkA plus NGF, 0.71 ± 0.21 (n = 23), controls, 0.47 ± 0.12 (n = 17); TrkB plus NT-4/5, 0.43 ± 0.13 (n = 14), controls, 0.41 ± 0.09 (n = 10); TrkB plus BDNF, 0.58 ± 0.12 (n = 24), controls, 0.50 ± 0.07 (n = 24); TrkC plus NT-3, 0.60 ± 0.16 (n = 21), controls, 0.57 ± 0.11 (n = 14). All paired P values >0.4.
Figure 6
Figure 6
Calcium current and cell size are not coregulated by neurotrophins in PC12nnr5 cells. Peak calcium currents were plotted against capacitance for individual cells. Control cells (open symbols) clustered in the lower left portion of the graph, indicating that calcium currents and cell sizes were small and varied minimally. trk-transfected, neurotrophin-treated cells (filled symbols) showed increased calcium currents and cell sizes, but notably, often one increased without the other. (Top) trkA plus NGF and associated controls. (Middle) trkB plus NT-4/5 or trkB plus BDNF, and controls. (Bottom) trkC plus NT-3 cells and controls.

References

    1. Temple S, Qian X. Neuron. 1995;15:249–252. - PubMed
    1. McConnell S K. Neuron. 1995;15:761–768. - PubMed
    1. Ghosh A, Greenberg M E. Neuron. 1995;15:89–103. - PubMed
    1. Vicario-Abejon C, Johe K K, Hazel T G, Collazo D, McKay R D G. Neuron. 1995;15:105–114. - PubMed
    1. Davis A A, Temple S. Nature (London) 1994;372:263–266. - PubMed

Publication types

MeSH terms

LinkOut - more resources