. 1997 Jun 15;17(12):4612-22.
doi: 10.1523/JNEUROSCI.17-12-04612.1997.

Calcium homeostasis and reactive oxygen species production in cells transformed by mitochondria from individuals with sporadic Alzheimer's disease

Affiliations

Calcium homeostasis and reactive oxygen species production in cells transformed by mitochondria from individuals with sporadic Alzheimer's disease

J P Sheehan et al. J Neurosci. .

Abstract

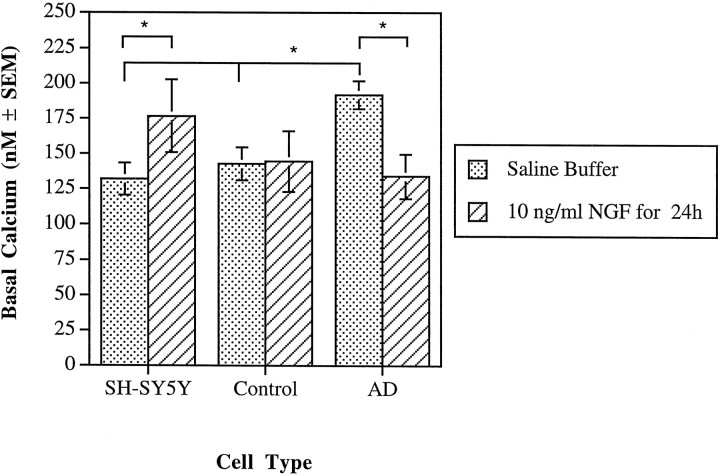
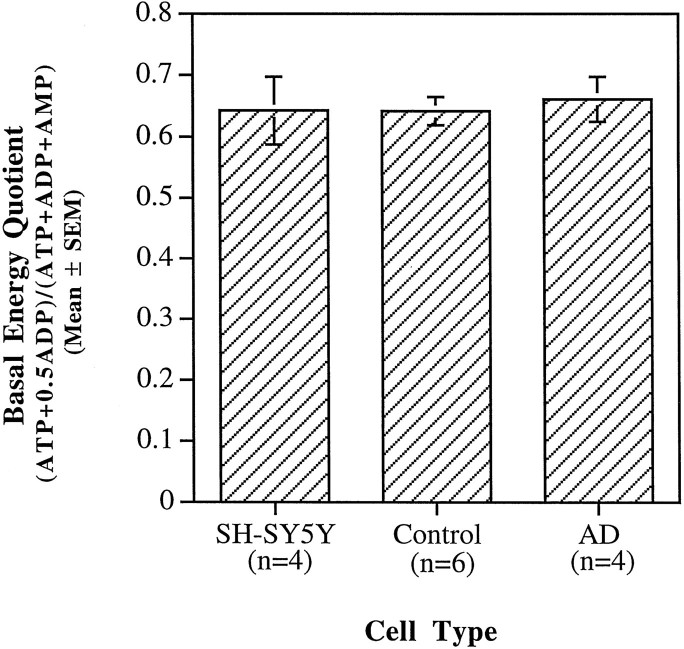
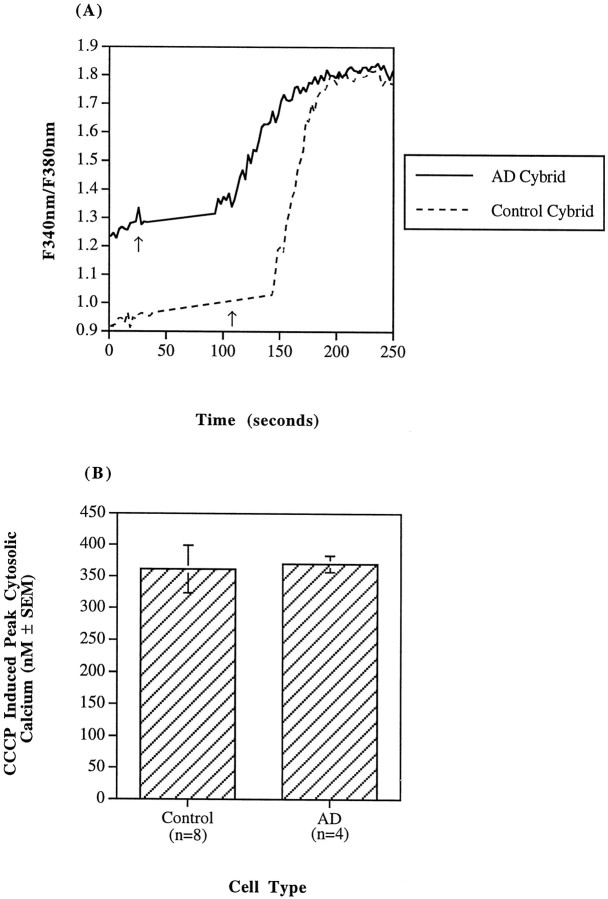
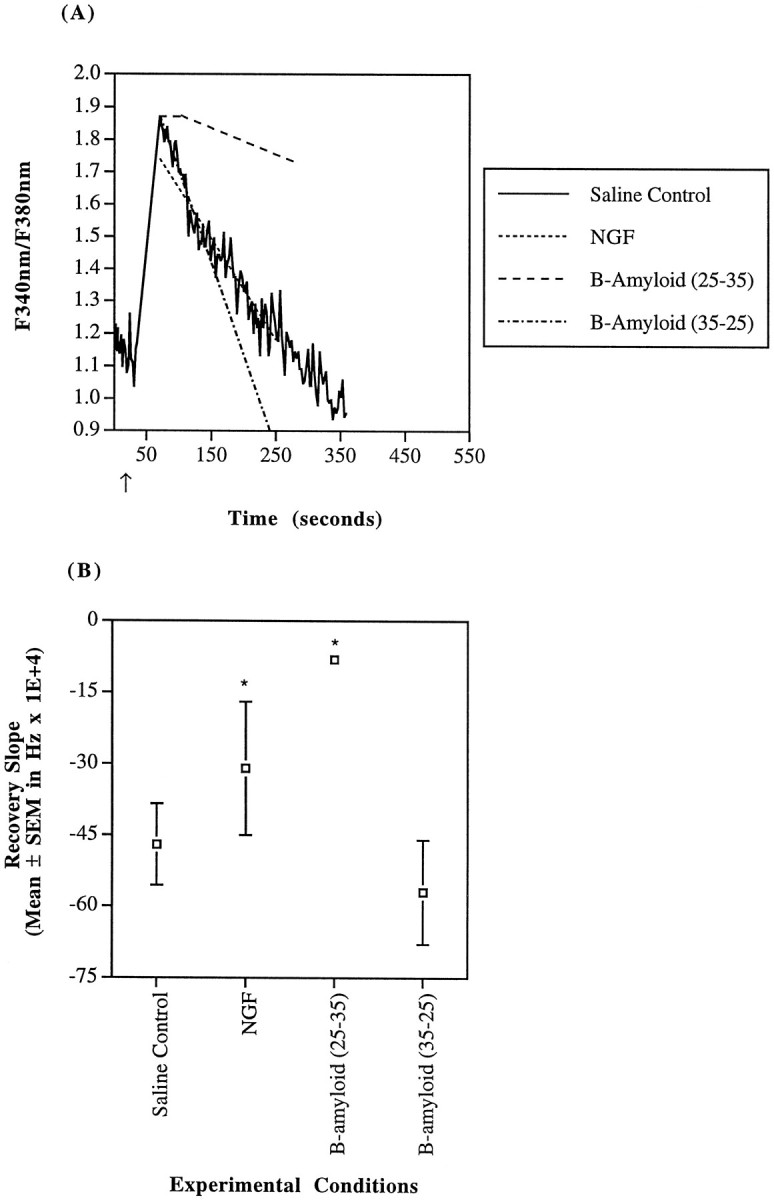
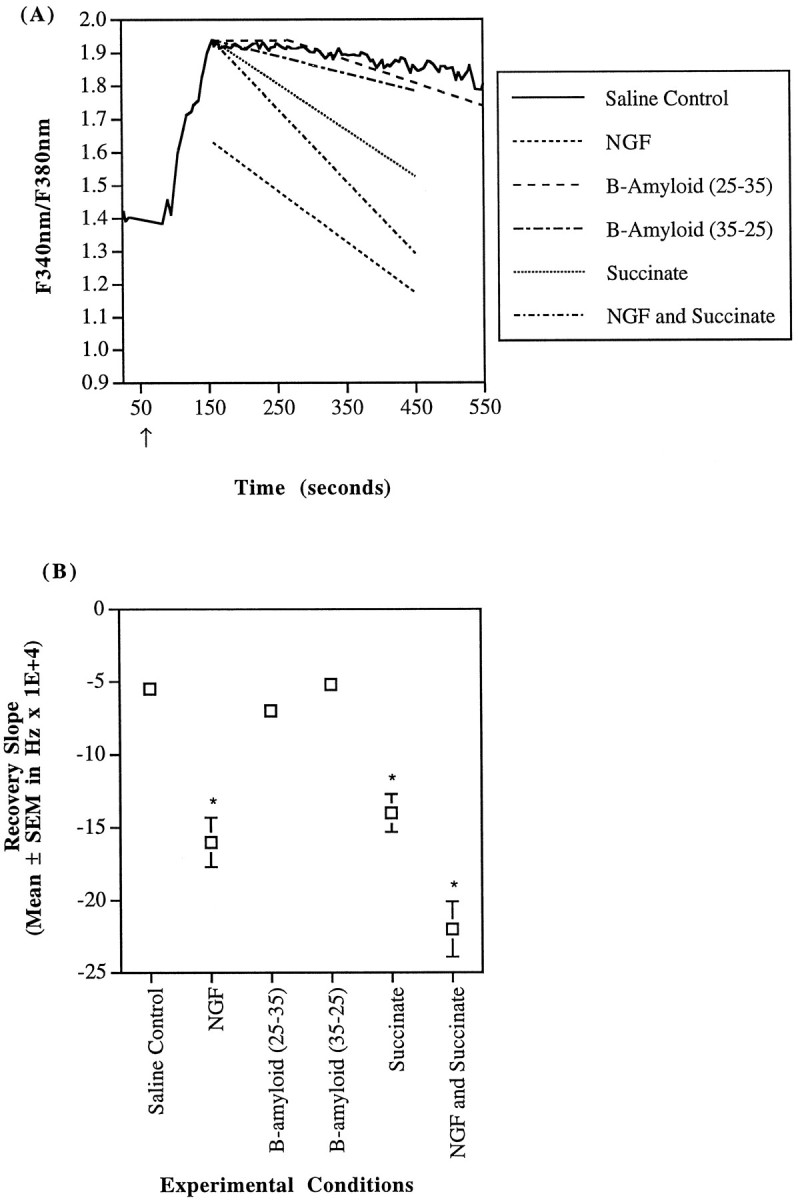
Alzheimer's disease (AD) is associated with defects in mitochondrial function. Mitochondrial-based disturbances in calcium homeostasis, reactive oxygen species (ROS) generation, and amyloid metabolism have been implicated in the pathophysiology of sporadic AD. The cellular consequences of mitochondrial dysfunction, however, are not known. To examine these consequences, mitochondrially transformed cells (cybrids) were created from AD patients or disease-free controls. Mitochondria from platelets were fused to rho0 cells created by depleting the human neuroblastoma line SH-SY5Y of its mitochondrial DNA (mtDNA). AD cybrids demonstrated a 52% decrease in electron transport chain (ETC) complex IV activity but no difference in complex I activity compared with control cybrids or SH-SY5Y cells. This mitochondrial dysfunction suggests a transferable mtDNA defect associated with AD. ROS generation was elevated in the AD cybrids. AD cybrids also displayed an increased basal cytosolic calcium concentration and enhanced sensitivity to inositol-1,4, 5-triphosphate (InsP3)-mediated release. Furthermore, they recovered more slowly from an elevation in cytosolic calcium induced by the InsP3 agonist carbachol. Mitochondrial calcium buffering plays a major role after this type of perturbation. beta-amyloid (25-35) peptide delayed the initiation of calcium recovery to a carbachol challenge and slowed the recovery rate. Nerve growth factor reduced the carbachol-induced maximum and moderated the recovery kinetics. Succinate increased ETC activity and partially restored the AD cybrid recovery rate. These subtle alterations in calcium homeostasis and ROS generation might lead to increased susceptibility to cell death under circumstances not ordinarily toxic.


Figures

Fig. 1.
Fig. 1.
Basal cytosolic calcium concentrations for SH-SY5Y cells and control and AD cybrids were measured under two different conditions. Calcium was measured using fura-2, and values represent the mean of the SH-SY5Y cells, four AD cybrid lines, and eight control cybrid lines. An asterisk indicates a statistically significant difference (p < 0.05) between values indicated by the brackets. Under saline buffer conditions, AD cybrids demonstrated elevated cytosolic calcium compared with either the SH-SY5Y line or the control cybrids. NGF caused a reduction in cytosolic calcium for the AD cybrids but an elevation for the SH-SY5Y cells.
Fig. 2.
Fig. 2.
Basal energy quotients (i.e., [(ATP + 0.5 × ADP)/(ATP + ADP + AMP)]) were measured using anion-exchange HPLC. Energy quotients for all cell types were comparable.
Fig. 3.
Fig. 3.
Cellular ROS production was determined as the ratio of DCFDA fluorescence normalized per cell number by the LDH absorbance. Under basal conditions, AD cybrid lines showed an increased production of ROS (*p < 0.05).
Fig. 4.
Fig. 4.
Cytosolic calcium after a CCCP stimulus.A, Both AD and control cybrid lines in a saline buffer were challenged with 10 μm CCCP in HKRB at the point indicated by the arrow. These traces are representative fura-2-based fluorescence ratios as a function of time for single regions of interest. CCCP-induced calcium elevations were transient. Only prestimulus baselines and subsequent stimulated calcium elevations to respective maxima are shown in these truncated traces.B, The CCCP-induced peak calcium levels for the AD (n = 4) and control (n = 8) cybrid lines were comparable; however, the amount of calcium sequestered in the mitochondria is actually the difference between the CCCP-induced calcium maximum and the basal cytosolic calcium concentration. Although CCCP-induced peaks are comparable between AD and control cybrids, the basal calcium concentration of AD cybrids is greater than control. Note the difference in prestimulus fura ratios indicative of the substantial basal cytosolic calcium difference between ADs and controls in A. Thus, under basal conditions, AD cybrid mitochondria sequester less calcium (p < 0.01).
Fig. 5.
Fig. 5.
Cytosolic calcium recovery slopes after a carbachol stimulus. Four AD cybrid lines and eight control lines were stimulated with 100 μm carbachol, and the mean fura fluorescence recovery slope after attainment of peak fluorescence for each cell line is depicted by a circle. Each AD cybrid line indicated by the circle is based on six to eight observations; each control line is the mean of six to seven observations. The error bars indicate ±2 SD from the overall group mean. The recovery slopes of the AD cybrid and control groups differ substantially (*p < 0.01; unpaired t test).
Fig. 6.
Fig. 6.
SH-SY5Y calcium recovery kinetics after a carbachol stimulus. A, SH-SY5Y cells were challenged with 100 μm carbachol (indicated by arrow) in a saline buffer (—). As noted, cells were uninhibited (actualsolid line trace), pretreated with NGF (10 ng/ml of 2.5S for 24 hr), or exposed to β-amyloid (25–35) or its control (35–25) peptide at 40 μm for 1 hr before stimulus. The trace was recorded during carbachol stimulation of a single region of interest incubated in saline buffer (i.e., 1–3 cells) and is representative of the whole. Both average recovery slope and calcium maximum for NGF-treated cells (- - -) were reduced. β-amyloid (25–35)-exposed cells (– – –) demonstrated delayed onset of recovery (note the initial plateau) and a decreased recovery slope. β-amyloid (35–25) incubation (– · – · –) had no significant effect compared with saline control. B, Mean recovery derivatives of the fura-2 fluorescence ratio (d(Fbound at 340nm/Funbound at 380nm)/dt) until attainment of a stable baseline are depicted. Recovery in the presence of either NGF or β-amyloid (25–35) was significantly slowed (*p < 0.05).
Fig. 7.
Fig. 7.
Control cybrid calcium recovery kinetics after a carbachol stimulus. A, Control cybrids were challenged with 100 μm carbachol (indicated by arrow) in a saline buffer, and as noted, some were also exposed to the following before stimulus: 10 ng/ml of 2.5S NGF for 24 hr (- - -), 40 μm β-amyloid (25–35) for 1 hr (– – –), or 40 μm β-amyloid (35–25) for 1 hr (– · – · –). The solid line trace (—) is a representative single region of interest (i.e., 1–3 cells) fura-2 ratio recording of control cybrids incubated in a saline buffer responding to a carbachol stimulus. Thelines are indicative of the mean recovery slopes for the control cybrids under particular pharmacological conditions. Again, note the decreased calcium peak with NGF treatment and the delayed initiation of recovery in β-amyloid (25–35)-treated control cybrids.B, Recovery derivatives of the fura-2 fluorescence ratio (d(Fbound at 340nm/Funbound at 380nm)/dt) until attainment of a stable baseline are detailed. Control cybrid recovery was reduced with both NGF and β-amyloid (25–35) treatment (*p < 0.05).
Fig. 8.
Fig. 8.
AD cybrid calcium recovery kinetics after a carbachol stimulus. A, AD cybrids with reduced complex IV activity were challenged with 100 μm carbachol in a saline buffer (—), and some were also exposed to other pharmacological agents such as 10 ng/ml of NGF (- - -), 40 μmβ-amyloid (25–35) (– – –), 40 μm β-amyloid (35–25) (– · – · –), 5 mm succinate (· · ·), or NGF and succinate (– · – · –). The trace represents fura fluorescence ratio measurements of a single region of interest (i.e., 1–3 cells) stimulated with carbachol. The other lines are indicative of the mean recovery slopes for the AD cybrids under particular pharmacological conditions. Again, NGF treatment alone significantly reduced the carbachol-induced calcium peak, and β-amyloid (25–35) exposure delayed the initiation of recovery (note the initial plateau recovery response). The carbachol-induced peak calcium concentration in the AD cybrids is slightly larger than in controls (p < 0.05); AD recovery kinetics are much slower than controls (Fig. 6A) (p < 0.05). B, Recovery derivatives of the fura-2 fluorescence ratio until attainment of a stable baseline are detailed. AD cybrid recovery was not significantly reduced by either β-amyloid (25–35) or β-amyloid (35–25). NGF alone was able to increase the recovery rate by 186%. Similarly, succinate increased the recovery kinetics by 165%. Succinate and NGF combined resulted in a 313% increase in the calcium recovery rate (*p < 0.05).

References

    1. Ankarcrona M, Dypbukt JM, Bonfoco E, Zhivotovsky B, Orrenius S, Lipton SA, Nicotera P. Glutamate-induced neuronal death: a succession of necrosis or apoptosis depending on mitochondrial function. Neuron. 1995;15:961–973. - PubMed
    1. Arispe N, Pollard HB, Rojas E. The ability of amyloid β-protein [AβP (1–40)] to form Ca2+ channels provides a mechanism for neuronal death in Alzheimer’s disease. Ann NY Acad Sci. 1994;747:256–265. - PubMed
    1. Askanas V, McFerrin J, Baque S, Alvarez RB, Sarkozi E, Engel WK. Transfer of beta-amyloid precursor protein gene using adenovirus vector causes mitochondrial abnormalities in cultured normal human muscle. Proc Natl Acad Sci USA. 1996;93:1314–1319. - PMC - PubMed
    1. Babcock DF, Herrington J, Goodwin PC, Park YB, Hille B. Mitochondrial participation in the intracellular Ca2+ network. J Cell Biol. 1997;136:833–844. - PMC - PubMed
    1. Baker DL, Reddy UR, Pleasure D, Thorpe CL, Evens AE, Cohen PS, Ross AH. Analysis of nerve growth factor receptor expression in human neuroblastoma and neuroepithelioma cell lines. Cancer Res. 1989;49:4142–4146. - PubMed

MeSH terms