

Genetic and physical maps of Saccharomyces cerevisiae
Affiliations
- PMID: 9169866
- PMCID: PMC3057085
Item in Clipboard
Genetic and physical maps of Saccharomyces cerevisiae
Nature.
.
Abstract
Genetic and physical maps for the 16 chromosomes of Saccharomyces cerevisiae are presented. The genetic map is the result of 40 years of genetic analysis. The physical map was produced from the results of an international systematic sequencing effort. The data for the maps are accessible electronically from the Saccharomyces Genome Database (SGD: http://genome-www.stanford. edu/Saccharomyces/).
Figures
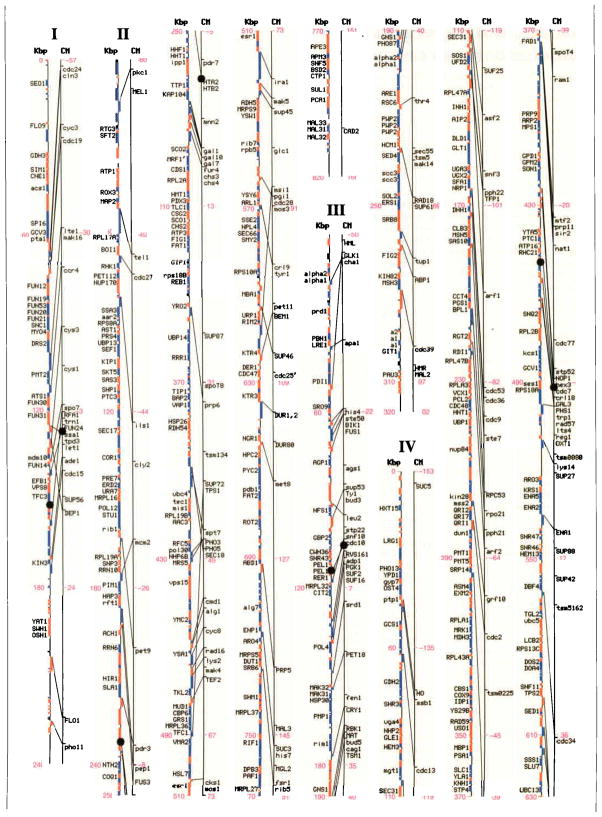
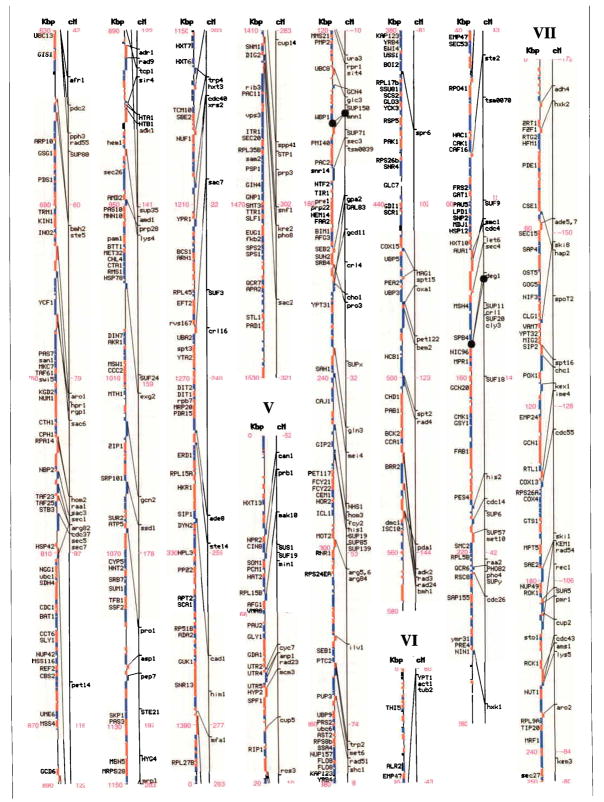
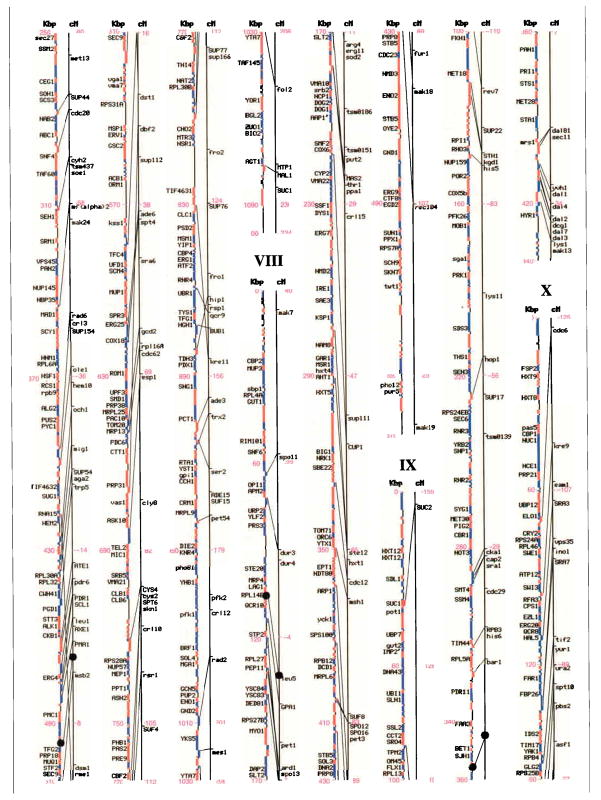
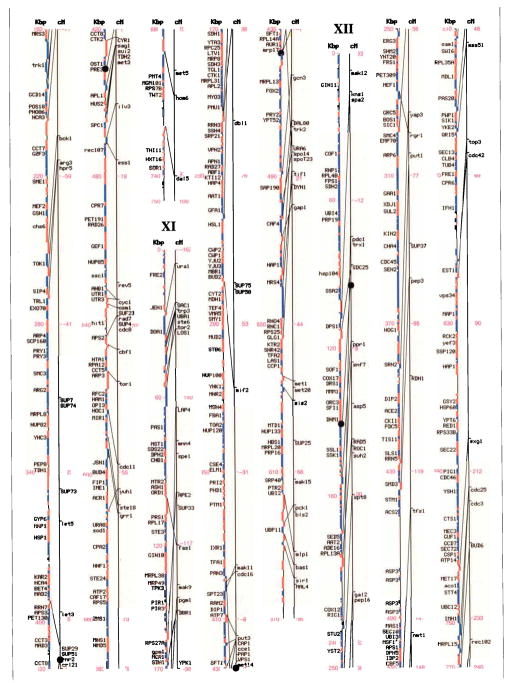
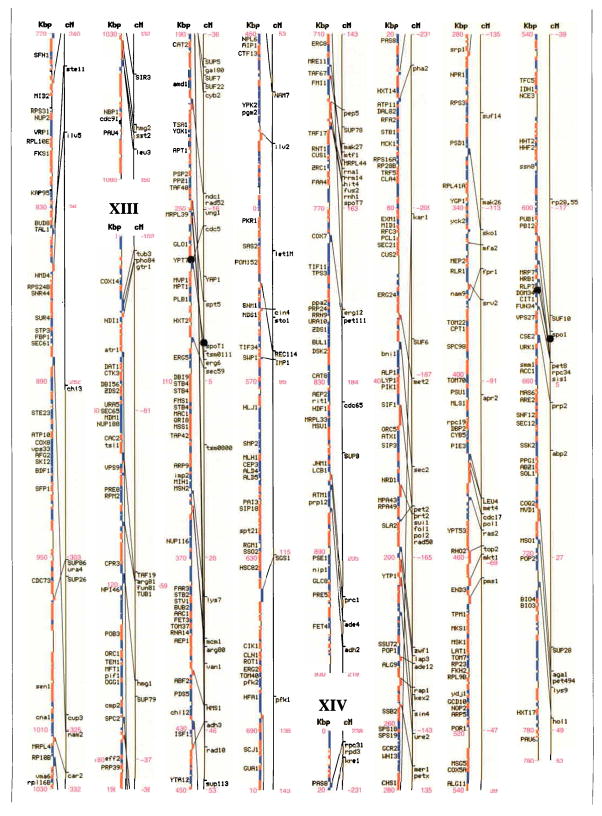
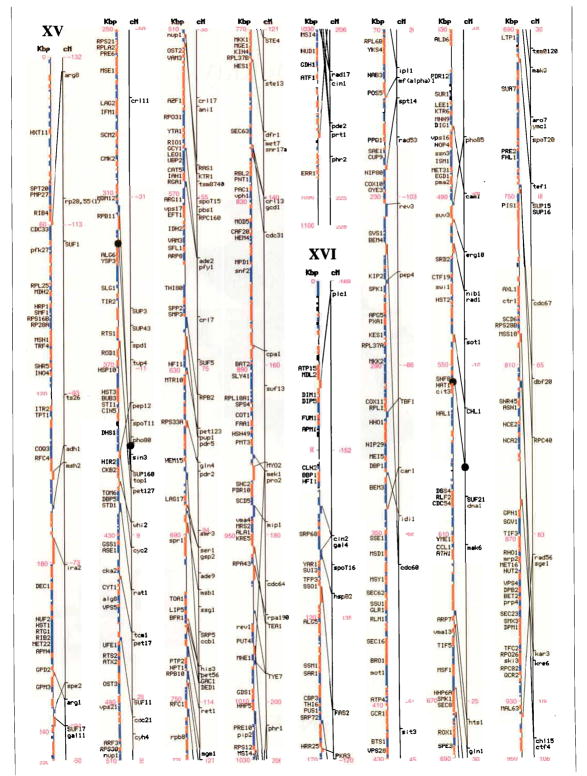
Genetic and physical maps, and their correlations, of the 16 Saccharomyces cerevisiae chromosomes. A parallel comparison of the physical map (left, in kilobase pairs) and the genetic map (right, in centimorgans) of each of the 16 chromosomes is illustrated. The information in this figure is available on the Saccharomyces Genome Database (http://genome-www.stanford.edu/Saccharomyces/ ). The physical map consists of coloured boxes that indicate ORFs. ORFs on the Watson strand (left telomere is the 5′ end of this strand) are shown as red boxes, those on the Crick strand as blue boxes. Where it has been defined, the gene name of an ORF is indicated. The genetic map is based on data collected since 1991 by the SGD project, as well as on earlier data–. Horizontal tick marks on the right of the genetic map line indicate positions of genes. Lines connect genetically mapped genes with their ORF on the physical map. A single name is listed for known synonyms.
Genetic and physical maps, and their correlations, of the 16 Saccharomyces cerevisiae chromosomes. A parallel comparison of the physical map (left, in kilobase pairs) and the genetic map (right, in centimorgans) of each of the 16 chromosomes is illustrated. The information in this figure is available on the Saccharomyces Genome Database (http://genome-www.stanford.edu/Saccharomyces/ ). The physical map consists of coloured boxes that indicate ORFs. ORFs on the Watson strand (left telomere is the 5′ end of this strand) are shown as red boxes, those on the Crick strand as blue boxes. Where it has been defined, the gene name of an ORF is indicated. The genetic map is based on data collected since 1991 by the SGD project, as well as on earlier data–. Horizontal tick marks on the right of the genetic map line indicate positions of genes. Lines connect genetically mapped genes with their ORF on the physical map. A single name is listed for known synonyms.
Genetic and physical maps, and their correlations, of the 16 Saccharomyces cerevisiae chromosomes. A parallel comparison of the physical map (left, in kilobase pairs) and the genetic map (right, in centimorgans) of each of the 16 chromosomes is illustrated. The information in this figure is available on the Saccharomyces Genome Database (http://genome-www.stanford.edu/Saccharomyces/ ). The physical map consists of coloured boxes that indicate ORFs. ORFs on the Watson strand (left telomere is the 5′ end of this strand) are shown as red boxes, those on the Crick strand as blue boxes. Where it has been defined, the gene name of an ORF is indicated. The genetic map is based on data collected since 1991 by the SGD project, as well as on earlier data–. Horizontal tick marks on the right of the genetic map line indicate positions of genes. Lines connect genetically mapped genes with their ORF on the physical map. A single name is listed for known synonyms.
Genetic and physical maps, and their correlations, of the 16 Saccharomyces cerevisiae chromosomes. A parallel comparison of the physical map (left, in kilobase pairs) and the genetic map (right, in centimorgans) of each of the 16 chromosomes is illustrated. The information in this figure is available on the Saccharomyces Genome Database (http://genome-www.stanford.edu/Saccharomyces/ ). The physical map consists of coloured boxes that indicate ORFs. ORFs on the Watson strand (left telomere is the 5′ end of this strand) are shown as red boxes, those on the Crick strand as blue boxes. Where it has been defined, the gene name of an ORF is indicated. The genetic map is based on data collected since 1991 by the SGD project, as well as on earlier data–. Horizontal tick marks on the right of the genetic map line indicate positions of genes. Lines connect genetically mapped genes with their ORF on the physical map. A single name is listed for known synonyms.
Genetic and physical maps, and their correlations, of the 16 Saccharomyces cerevisiae chromosomes. A parallel comparison of the physical map (left, in kilobase pairs) and the genetic map (right, in centimorgans) of each of the 16 chromosomes is illustrated. The information in this figure is available on the Saccharomyces Genome Database (http://genome-www.stanford.edu/Saccharomyces/ ). The physical map consists of coloured boxes that indicate ORFs. ORFs on the Watson strand (left telomere is the 5′ end of this strand) are shown as red boxes, those on the Crick strand as blue boxes. Where it has been defined, the gene name of an ORF is indicated. The genetic map is based on data collected since 1991 by the SGD project, as well as on earlier data–. Horizontal tick marks on the right of the genetic map line indicate positions of genes. Lines connect genetically mapped genes with their ORF on the physical map. A single name is listed for known synonyms.
Genetic and physical maps, and their correlations, of the 16 Saccharomyces cerevisiae chromosomes. A parallel comparison of the physical map (left, in kilobase pairs) and the genetic map (right, in centimorgans) of each of the 16 chromosomes is illustrated. The information in this figure is available on the Saccharomyces Genome Database (http://genome-www.stanford.edu/Saccharomyces/ ). The physical map consists of coloured boxes that indicate ORFs. ORFs on the Watson strand (left telomere is the 5′ end of this strand) are shown as red boxes, those on the Crick strand as blue boxes. Where it has been defined, the gene name of an ORF is indicated. The genetic map is based on data collected since 1991 by the SGD project, as well as on earlier data–. Horizontal tick marks on the right of the genetic map line indicate positions of genes. Lines connect genetically mapped genes with their ORF on the physical map. A single name is listed for known synonyms.
References
-
- Mortimer RK, Hawthorne DC. Methods Cell Biol. 1975;11:221–233. - PubMed
MeSH terms
Grants and funding
LinkOut - more resources
Full Text Sources
Other Literature Sources
Molecular Biology Databases