

Reaction of aflatoxin B1 exo-8,9-epoxide with DNA: kinetic analysis of covalent binding and DNA-induced hydrolysis
- PMID: 9177180
- PMCID: PMC21012
- DOI: 10.1073/pnas.94.12.6121
Reaction of aflatoxin B1 exo-8,9-epoxide with DNA: kinetic analysis of covalent binding and DNA-induced hydrolysis
Abstract
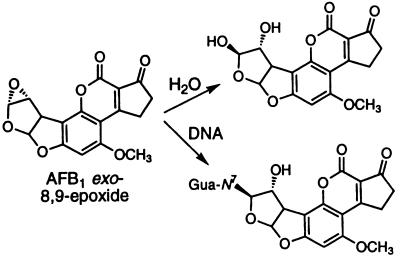
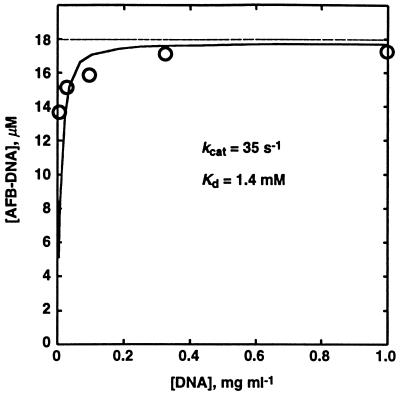
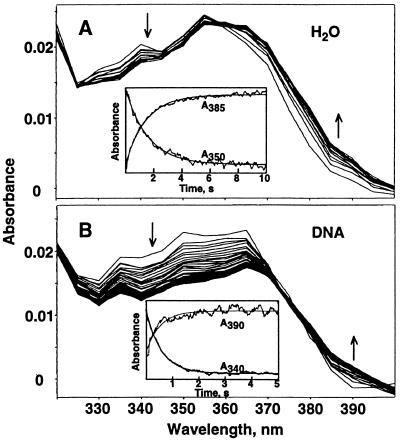
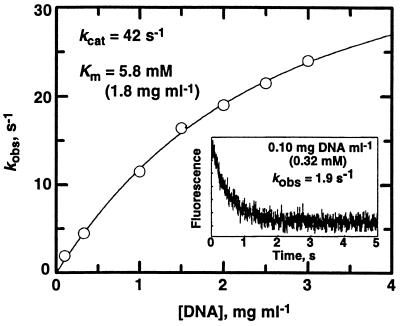
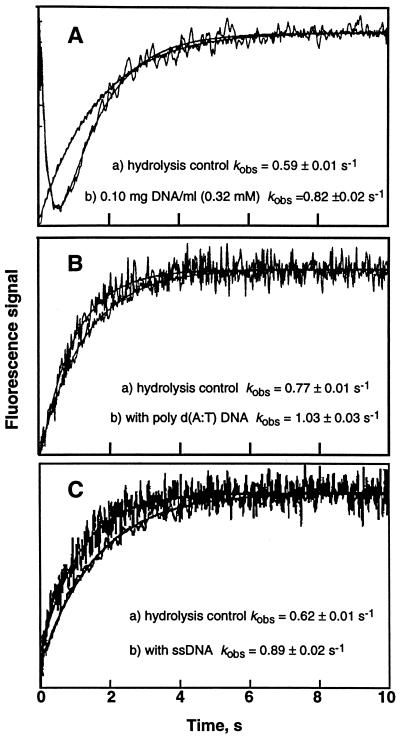
The exo isomer of aflatoxin B1 (AFB1) 8,9-epoxide appears to be the only product of AFB1 involved in reaction with DNA and reacts with the N7 atom of guanine via an SN2 reaction from an intercalated state. Although the epoxide hydrolyzes rapidly in H2O (0.6 s-1 at 25 degrees C), very high yields of DNA adduct result. Experimental binding data were fit to a model in which the epoxide forms a reversible complex with calf thymus DNA (Kd = 0.43 mg ml-1, or 1.4 mM monomer equivalents) and reacts with guanine with a rate of 35 s-1. Stopped-flow kinetic analysis revealed attenuation of fluorescence in the presence of DNA that was dependent on DNA concentration. Kinetic spectral analysis revealed that this process represents conjugation of epoxide with DNA, with an extrapolated rate maximum of 42 s-1 and half-maximal velocity at a DNA concentration of 1.8 mg ml-1 (5.8 mM monomer equivalents). The rate of hydrolysis of the epoxide was accelerated by calf thymus DNA in the range of pH 6-8, with a larger enhancement at the lower pH (increase of 0.23 s-1 at pH 6.2 with 0.17 mg DNA ml-1). The same rate enhancement effect was observed with poly[dA-dT].poly[dA-dT], in which the epoxide can intercalate but not form significant levels of N7 purine adducts, and with single-stranded DNA. The increased rate of hydrolysis by DNA resembles that reported earlier for epoxides of polycyclic hydrocarbons and is postulated to involve a previously suggested localized proton field on the periphery of DNA. The epoxide preferentially intercalates between base pairs, and the proton field is postulated to provide acid catalysis to the conjugation reaction.
Figures
References
-
- Busby W F, Wogan G N. In: Chemical Carcinogens. Searle C E, editor. Washington, DC: Am. Chem. Soc.; 1984. pp. 945–1136.
-
- Ueng Y-F, Shimada T, Yamazaki H, Guengerich F P. Chem Res Toxicol. 1995;8:218–225. - PubMed
-
- Iyer R, Coles B, Raney K D, Thier R, Guengerich F P, Harris T M. J Am Chem Soc. 1994;116:1603–1609.
-
- Johnson W W, Harris T M, Guengerich F P. J Am Chem Soc. 1996;118:8213–8220.
-
- Raney K D, Gopalakrishnan S, Byrd S, Stone M P, Harris T M. Chem Res Toxicol. 1990;3:254–261. - PubMed
Publication types
MeSH terms
Substances
Grants and funding
LinkOut - more resources
Full Text Sources
