. 1997 Jun 16;137(6):1337-54.
doi: 10.1083/jcb.137.6.1337.

Fission yeast dim1(+) encodes a functionally conserved polypeptide essential for mitosis

Affiliations

Fission yeast dim1(+) encodes a functionally conserved polypeptide essential for mitosis

L D Berry et al. J Cell Biol. .

Abstract

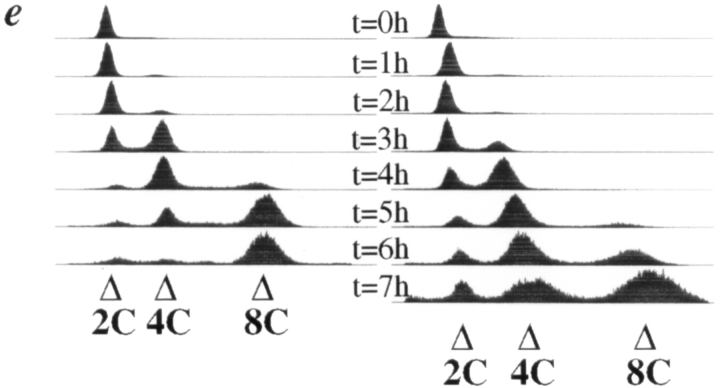
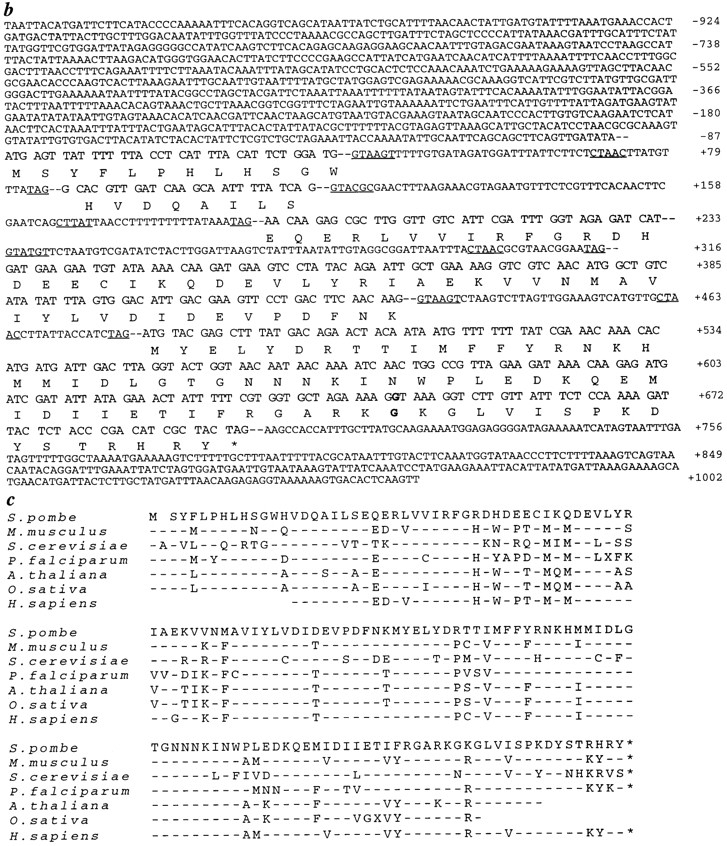
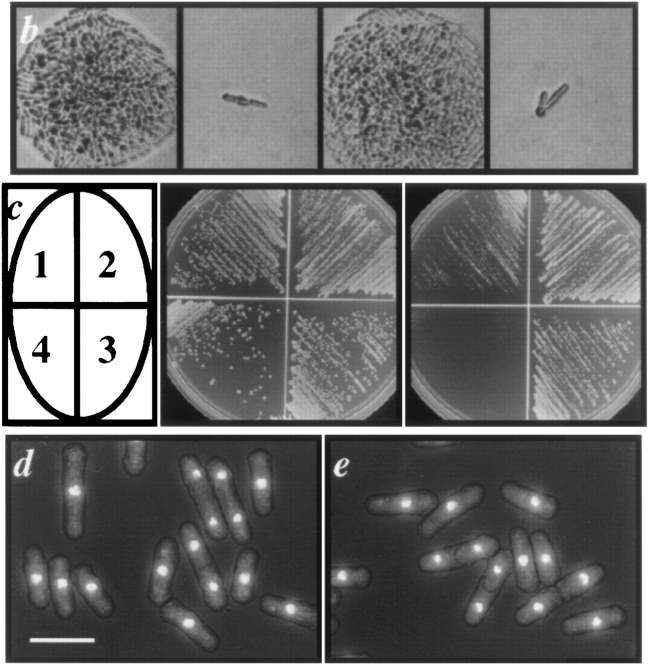
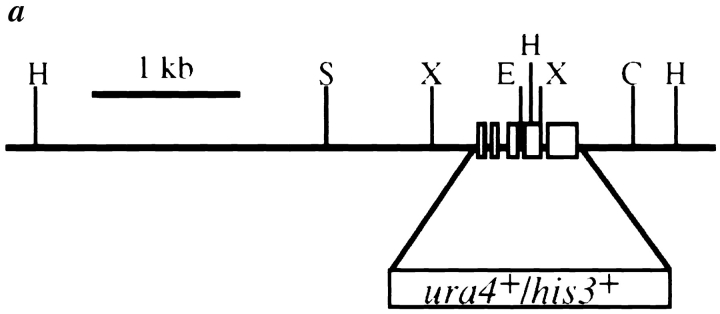
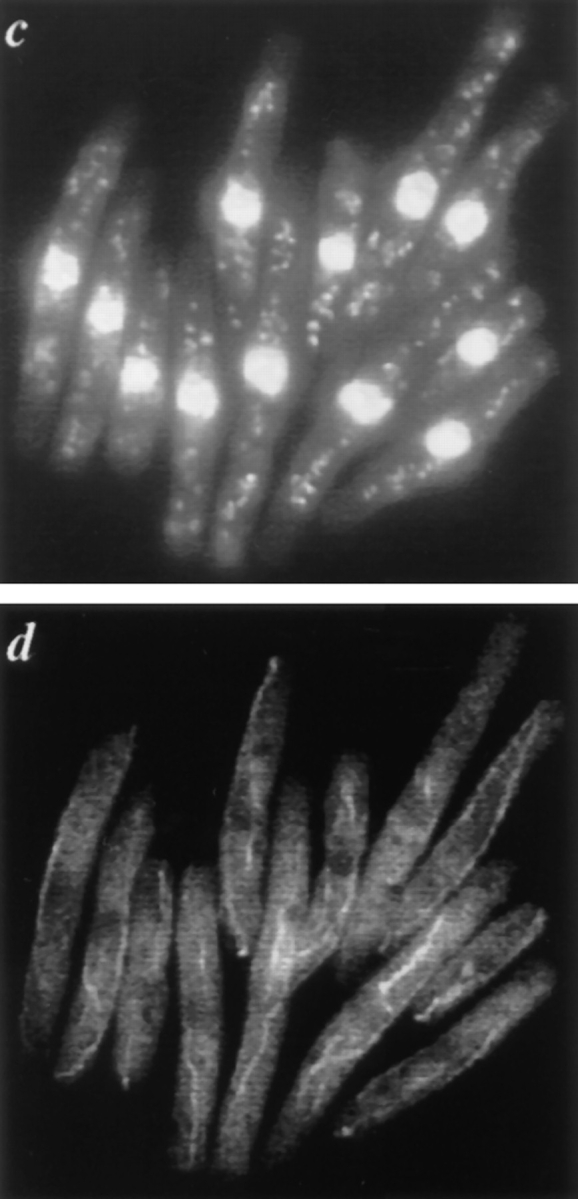
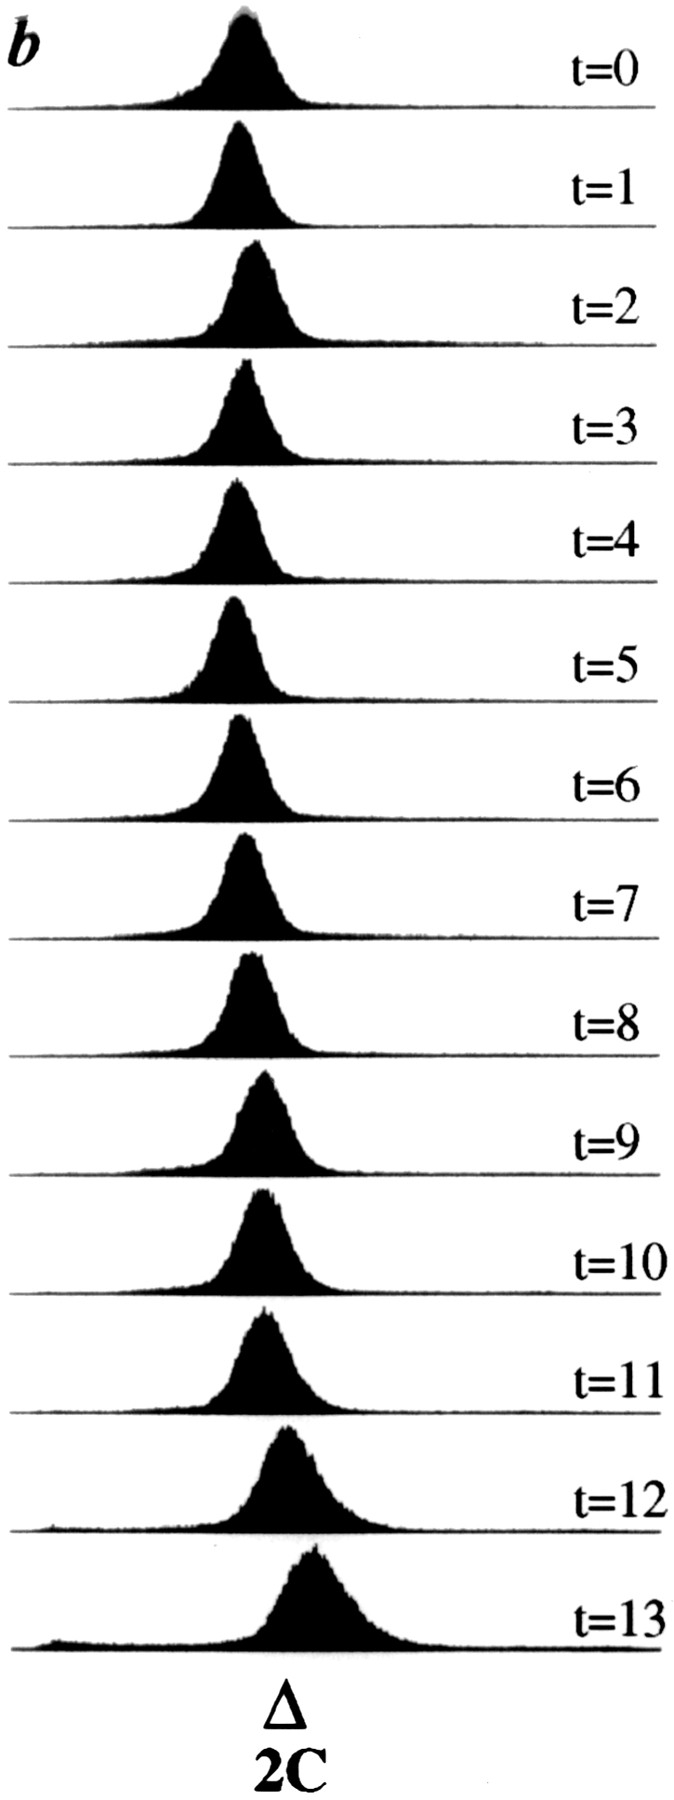
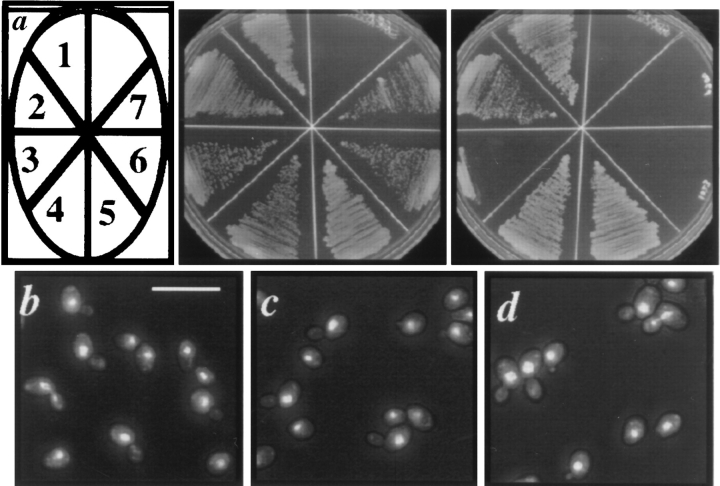
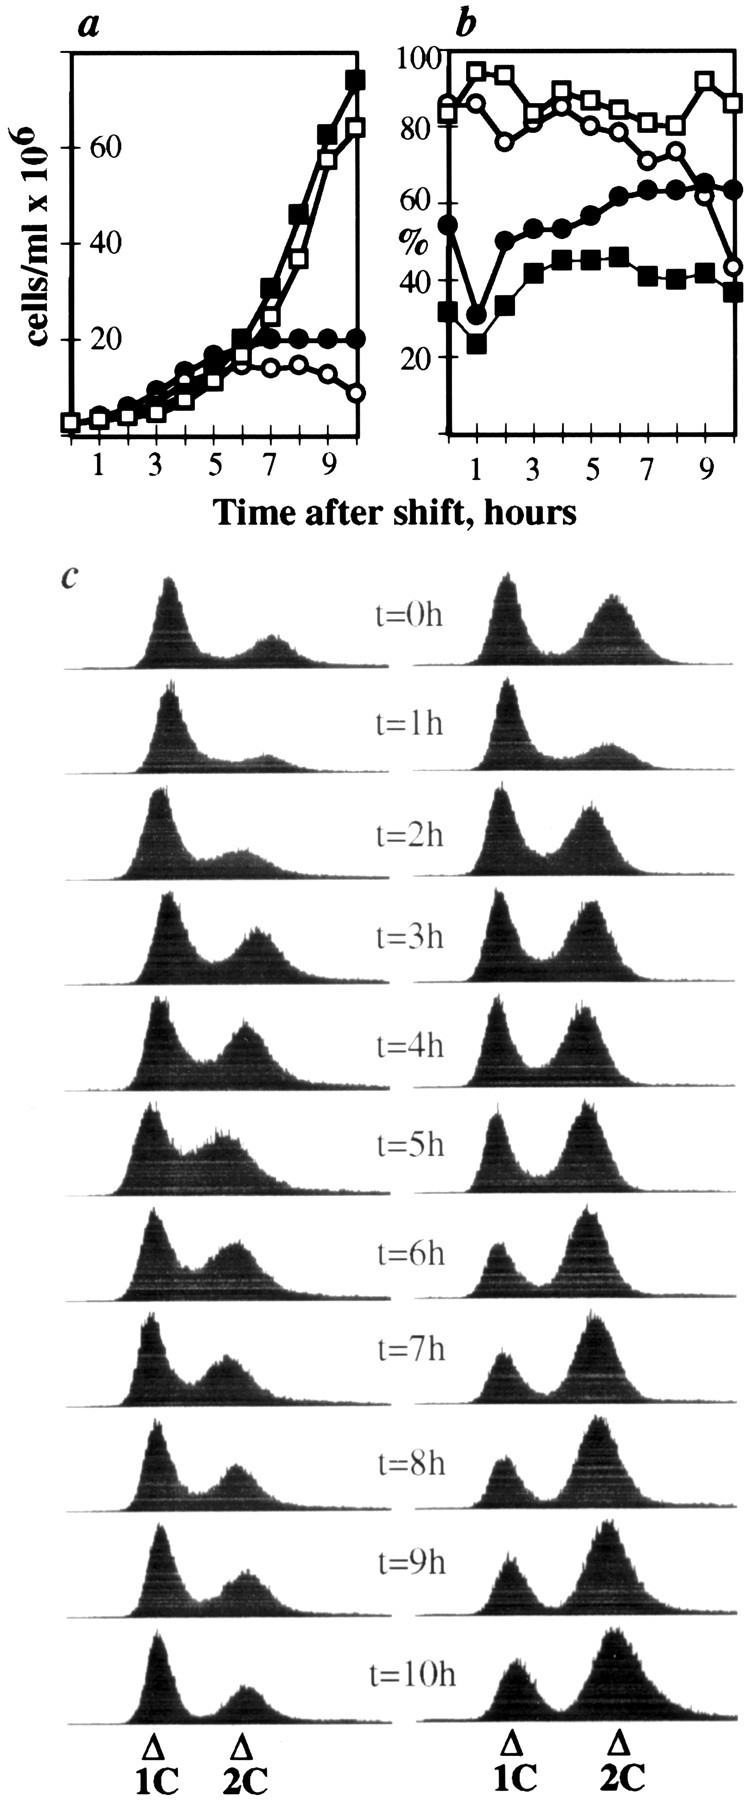
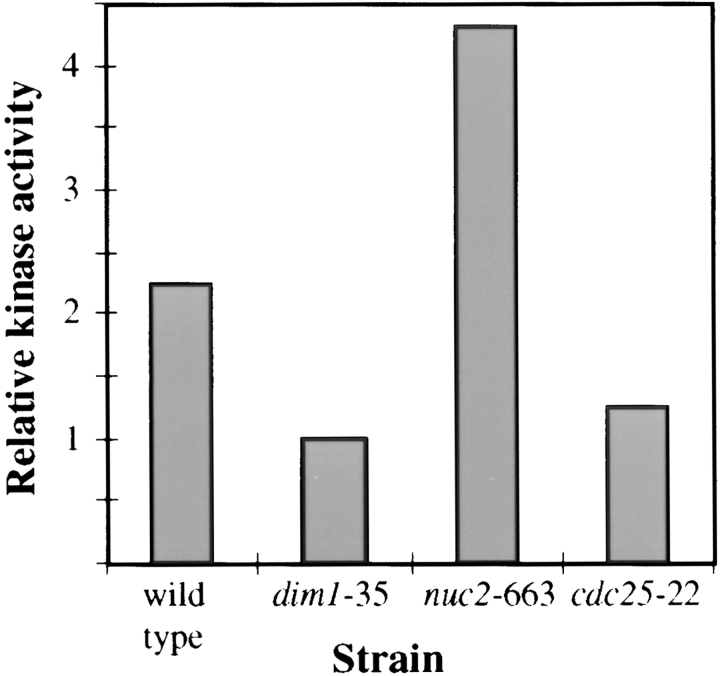
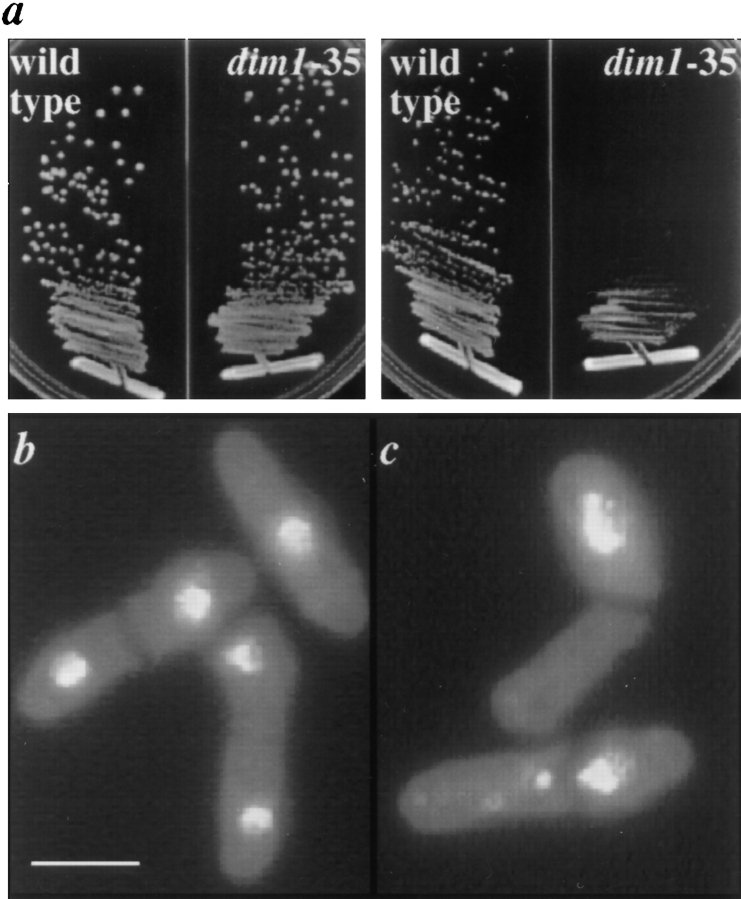
In a screen for second site mutations capable of reducing the restrictive temperature of the fission yeast mutant cdc2-D217N, we have isolated a novel temperature-sensitive mutant, dim1-35. When shifted to restrictive temperature, dim1-35 mutant cells arrest before entry into mitosis or proceed through mitosis in the absence of nuclear division, demonstrating an uncoupling of proper DNA segregation from other cell cycle events. Deletion of dim1 from the Schizosaccharomyces pombe genome produces a lethal G2 arrest phenotype. Lethality is rescued by overexpression of the mouse dim1 homolog, mdim1. Likewise, deletion of the Saccharomyces cerevisiae dim1 homolog, CDH1, is lethal. Both mdim1 and dim1(+) are capable of rescuing lethality in the cdh1::HIS3 mutant. Although dim1-35 displays no striking genetic interactions with various other G2/M or mitotic mutants, dim1-35 cells incubated at restrictive temperature arrest with low histone H1 kinase activity. Morevoer, dim1-35 displays sensitivity to the microtubule destabilizing drug, thiabendazole (TBZ). We conclude that Dim1p plays a fundamental, evolutionarily conserved role as a protein essential for entry into mitosis as well as for chromosome segregation during mitosis. Based on TBZ sensitivity and failed chromosome segregation in dim1-35, we further speculate that Dim1p may play a role in mitotic spindle formation and/or function.


Figures

Figure 3
Figure 3
Upon release from nitrogen starvation, dim1-35 cells incubated at restrictive temperature accumulate 2C DNA but display first cell cycle arrest at or just before entry into mitosis. dim1-35 cells were starved for nitrogen at permissive temperature and then shifted to rich medium at restrictive temperature. Samples were collected for analysis at 30-min intervals. (a) DNA content of dim1-35 cells after shift. (b) Viability (○), 2C DNA content (□), and septation index (•) of dim1-35 cells after shift. Note that viability remains high until the majority of cells have completed S phase (i.e., accumulated 2C DNA) and then begins to decline ∼4 h into the time course, just before septated cells are first observed (at t = 4.5 h). (c) Cut phenotype of septated cells at t = 5 h. Bar, 5 μm.
Figure 3
Figure 3
Upon release from nitrogen starvation, dim1-35 cells incubated at restrictive temperature accumulate 2C DNA but display first cell cycle arrest at or just before entry into mitosis. dim1-35 cells were starved for nitrogen at permissive temperature and then shifted to rich medium at restrictive temperature. Samples were collected for analysis at 30-min intervals. (a) DNA content of dim1-35 cells after shift. (b) Viability (○), 2C DNA content (□), and septation index (•) of dim1-35 cells after shift. Note that viability remains high until the majority of cells have completed S phase (i.e., accumulated 2C DNA) and then begins to decline ∼4 h into the time course, just before septated cells are first observed (at t = 4.5 h). (c) Cut phenotype of septated cells at t = 5 h. Bar, 5 μm.
Figure 1
Figure 1
A synchronized population of dim1-35 mutant cells shifted to restrictive temperature displays a second cell cycle arrest. dim1-35 mutant (KGY392) or wildtype (KGY28) cells were grown to midlog phase in rich medium at permissive temperature (25°C). Cells were synchronized in early G2 by centrifugal elutriation and then inoculated into rich medium at 36.5°C. Samples were collected at 20- to 25min intervals and subjected to various analyses. (a) DNA content of dim1-35 mutant cells after shift to restrictive temperature. Cells were fixed with ethanol, stained with propidium iodide, and subjected to flow cytometric analysis. DNA content, expressed in arbitrary units, is shown on the horizontal axis. Cell number is shown on the vertical axis. (b) Cell and nuclear morphology of dim1-35 cells at the first peak of septation (top), at the second peak of septation (middle), and after the second round of septation (bottom). Cells were fixed with ethanol and stained with DAPI. Arrowheads indicate septa. (c) Septation index of dim1-35 (○) or wild type (•) cells after shift. (d) Percent viability (○), percentage of cells containing 2C DNA (▵), and septation index (□) of dim1-35 mutant cells after shift. Note that viability begins to decline sharply at t = 230 min, just before septated cells are first observed at t = 250 min. (e) Tubulin and SPB staining of dim1-35 mutant cells at second peak of septation after shift to restrictive temperature. (Left) DNA stained with DAPI. (Middle) Tubulin stained with TAT1 antibody. (Right) SPBs stained with α-Sad1p antibody. Note that septation has occurred, bisecting the elongated spindle and producing two daughter cells, one containing the undivided nucleus (*) and one containing no chromatin (**). Arrowheads indicate septa; arrows indicate SPBs. Bars: (b) 5 μm; (e) 3 μm.
Figure 1
Figure 1
A synchronized population of dim1-35 mutant cells shifted to restrictive temperature displays a second cell cycle arrest. dim1-35 mutant (KGY392) or wildtype (KGY28) cells were grown to midlog phase in rich medium at permissive temperature (25°C). Cells were synchronized in early G2 by centrifugal elutriation and then inoculated into rich medium at 36.5°C. Samples were collected at 20- to 25min intervals and subjected to various analyses. (a) DNA content of dim1-35 mutant cells after shift to restrictive temperature. Cells were fixed with ethanol, stained with propidium iodide, and subjected to flow cytometric analysis. DNA content, expressed in arbitrary units, is shown on the horizontal axis. Cell number is shown on the vertical axis. (b) Cell and nuclear morphology of dim1-35 cells at the first peak of septation (top), at the second peak of septation (middle), and after the second round of septation (bottom). Cells were fixed with ethanol and stained with DAPI. Arrowheads indicate septa. (c) Septation index of dim1-35 (○) or wild type (•) cells after shift. (d) Percent viability (○), percentage of cells containing 2C DNA (▵), and septation index (□) of dim1-35 mutant cells after shift. Note that viability begins to decline sharply at t = 230 min, just before septated cells are first observed at t = 250 min. (e) Tubulin and SPB staining of dim1-35 mutant cells at second peak of septation after shift to restrictive temperature. (Left) DNA stained with DAPI. (Middle) Tubulin stained with TAT1 antibody. (Right) SPBs stained with α-Sad1p antibody. Note that septation has occurred, bisecting the elongated spindle and producing two daughter cells, one containing the undivided nucleus (*) and one containing no chromatin (**). Arrowheads indicate septa; arrows indicate SPBs. Bars: (b) 5 μm; (e) 3 μm.
Figure 2
Figure 2
cdc11-119 dim1-35 double mutants shifted to restrictive temperature arrest primarily as binucleates. cdc11-119 (KGY107) or cdc11-119 dim1-35 (KGY942) mutant cells were grown to midlog phase in rich medium at 25°C and then shifted to 37°C. Samples were taken at hourly intervals to monitor progression through the cell cycle after shift. (a) Cell and nuclear morphology of cdc11-119 (left) or cdc11-119 dim1-35 (right) 6 h after shift. Cells were fixed with ethanol and stained with DAPI. (b) Nuclear content of cdc11119 (left) or cdc11-119 dim135 (right) after shift. Horizontal axis shows time after shift. Vertical axis shows percent of cells containing one nucleus (□), two nuclei (▵), three or four nuclei (for cdc11-119 dim1-35; ○), four nuclei (for cdc11-119, ○), or 8 nuclei (▪). (c) DNA content of cdc11-119 (left) or cdc11-119 dim1-35 (right) after shift. Horizontal axis shows time after shift. Vertical axis shows percent of cells containing 2C DNA (□), 4C DNA (▵), or 8C DNA (○). (d) Cell and nuclear morphology of cdc11-119 (left) or cdc11-119 dim1-35 (right) 5 h after shift. (Top) DNA stained with DAPI. (Middle) Tubulin stained with the monoclonal antibody TAT1. (Bottom) SPBs stained with polyclonal α-Sad1p antibodies. (e) Flow cytometric analysis of cdc11-119 (left) or cdc11-119 dim1-35 (right) after shift. Note that DNA content data for cdc11-119 at the 7 h time point were not collected, as most cells had accumulated >8C DNA. (f) cdc11-119 dim1-35, 6 h after shift, showing trinucleate phenotype. Note that this phenotype occurred in only 10% of cells at the 6-h time point. Bars: (a) 10 μm; (d) 5 μm; (f) 5 μm.
Figure 2
Figure 2
cdc11-119 dim1-35 double mutants shifted to restrictive temperature arrest primarily as binucleates. cdc11-119 (KGY107) or cdc11-119 dim1-35 (KGY942) mutant cells were grown to midlog phase in rich medium at 25°C and then shifted to 37°C. Samples were taken at hourly intervals to monitor progression through the cell cycle after shift. (a) Cell and nuclear morphology of cdc11-119 (left) or cdc11-119 dim1-35 (right) 6 h after shift. Cells were fixed with ethanol and stained with DAPI. (b) Nuclear content of cdc11119 (left) or cdc11-119 dim135 (right) after shift. Horizontal axis shows time after shift. Vertical axis shows percent of cells containing one nucleus (□), two nuclei (▵), three or four nuclei (for cdc11-119 dim1-35; ○), four nuclei (for cdc11-119, ○), or 8 nuclei (▪). (c) DNA content of cdc11-119 (left) or cdc11-119 dim1-35 (right) after shift. Horizontal axis shows time after shift. Vertical axis shows percent of cells containing 2C DNA (□), 4C DNA (▵), or 8C DNA (○). (d) Cell and nuclear morphology of cdc11-119 (left) or cdc11-119 dim1-35 (right) 5 h after shift. (Top) DNA stained with DAPI. (Middle) Tubulin stained with the monoclonal antibody TAT1. (Bottom) SPBs stained with polyclonal α-Sad1p antibodies. (e) Flow cytometric analysis of cdc11-119 (left) or cdc11-119 dim1-35 (right) after shift. Note that DNA content data for cdc11-119 at the 7 h time point were not collected, as most cells had accumulated >8C DNA. (f) cdc11-119 dim1-35, 6 h after shift, showing trinucleate phenotype. Note that this phenotype occurred in only 10% of cells at the 6-h time point. Bars: (a) 10 μm; (d) 5 μm; (f) 5 μm.
Figure 4
Figure 4
Cloning of dim1. (a) Restriction map of dim1 genomic locus and identification of minimal rescuing fragment. □, dim1 exon; H, HincII; S, Sac1; X, Xba1; E, EcoRV; C, ClaI. (b) Sequence of minimal rescuing fragment, showing putative coding region, intron/exon structure, and coding potential. Consensus 5′ splice, 3′ splice, and branch site sequences are underlined. The nucleotide and amino acid altered in dim1-35 are indicated in bold. These sequence data are available from GenBank/EMBL/ DDBJ under accession number AF001214. (c) Alignment of S. pombe Dim1p and putative Dim1 homologs. Mus musculus, S. cerevisiase, and partial Homo sapiens cDNAs were obtained and sequenced. The remaining cDNAs represent ESTs available in the databases. For any given Dim1p homolog, only those residues not identical to the corresponding residue in S. pombe Dim1p are indicated by a one letter amino acid code. Conserved residues are indicated by a dash (–). Note that the Arabidopsis thaliana, Orzia sativa, and H. sapiens sequences are incomplete. Blank spaces indicate unknown sequence or stretches of sequence in which a frame shift, likely due to error in the available sequence, results in loss of homology or introduction of a nonsense mutation. Of the full length clones sequenced in this lab, S. pombe and M. musculus dim1 share 79% identity at the amino acid level; S. pombe and S. cerevisiae, 65% identity; and M. musculus and S. cerevisiae, 64% identity.
Figure 4
Figure 4
Cloning of dim1. (a) Restriction map of dim1 genomic locus and identification of minimal rescuing fragment. □, dim1 exon; H, HincII; S, Sac1; X, Xba1; E, EcoRV; C, ClaI. (b) Sequence of minimal rescuing fragment, showing putative coding region, intron/exon structure, and coding potential. Consensus 5′ splice, 3′ splice, and branch site sequences are underlined. The nucleotide and amino acid altered in dim1-35 are indicated in bold. These sequence data are available from GenBank/EMBL/ DDBJ under accession number AF001214. (c) Alignment of S. pombe Dim1p and putative Dim1 homologs. Mus musculus, S. cerevisiase, and partial Homo sapiens cDNAs were obtained and sequenced. The remaining cDNAs represent ESTs available in the databases. For any given Dim1p homolog, only those residues not identical to the corresponding residue in S. pombe Dim1p are indicated by a one letter amino acid code. Conserved residues are indicated by a dash (–). Note that the Arabidopsis thaliana, Orzia sativa, and H. sapiens sequences are incomplete. Blank spaces indicate unknown sequence or stretches of sequence in which a frame shift, likely due to error in the available sequence, results in loss of homology or introduction of a nonsense mutation. Of the full length clones sequenced in this lab, S. pombe and M. musculus dim1 share 79% identity at the amino acid level; S. pombe and S. cerevisiae, 65% identity; and M. musculus and S. cerevisiae, 64% identity.
Figure 5
Figure 5
Deletion of the dim1 coding region from the S. pombe genome. (a) Schematic showing replacement of entire dim1 coding region with the ura4 + or his3 + selectable marker. (b) Tetrad dissected from sporulated KGY833 diploid cell, germinated at 25°C. Viable colonies (first and third images) were UraDim1ts. Inviable cells (presumed dim1::ura4 +; second and fourth images) divided once and then arrested. (c) Rescue of dim1::ura4 + by dim1 + and mdim1. Cells were streaked to minimal medium either lacking (middle) or containing (right) thiamine and then incubated at 32°C for 3 d. (Left) dim1::ura4 + carrying: (1) nmt1-T81:: dim1 + (KGY1091), (2) nmt1-T4::dim1 + (KGY858), (3) nmt1:: dim1 + (KGY842), and (4) nmt1::mdim1 (KGY1092). (d and e) Rescue of dim1::ura4 + by nmt1::dim1 + (d) or nmt1::mdim1 (e). KGY842 (d) or KGY1092 (e) was grown to midlog phase in minimal medium lacking thiamine, fixed with ethanol, and stained with DAPI. Bar, 10 μm.
Figure 5
Figure 5
Deletion of the dim1 coding region from the S. pombe genome. (a) Schematic showing replacement of entire dim1 coding region with the ura4 + or his3 + selectable marker. (b) Tetrad dissected from sporulated KGY833 diploid cell, germinated at 25°C. Viable colonies (first and third images) were UraDim1ts. Inviable cells (presumed dim1::ura4 +; second and fourth images) divided once and then arrested. (c) Rescue of dim1::ura4 + by dim1 + and mdim1. Cells were streaked to minimal medium either lacking (middle) or containing (right) thiamine and then incubated at 32°C for 3 d. (Left) dim1::ura4 + carrying: (1) nmt1-T81:: dim1 + (KGY1091), (2) nmt1-T4::dim1 + (KGY858), (3) nmt1:: dim1 + (KGY842), and (4) nmt1::mdim1 (KGY1092). (d and e) Rescue of dim1::ura4 + by nmt1::dim1 + (d) or nmt1::mdim1 (e). KGY842 (d) or KGY1092 (e) was grown to midlog phase in minimal medium lacking thiamine, fixed with ethanol, and stained with DAPI. Bar, 10 μm.
Figure 6
Figure 6
dim1::his3 + mutant cells arrest in G2. dim1::his3 + or dim1 + cells carrying a single integrated copy of nmt1−T81:: dim1 + (KGY1180 or KGY1216, respectively) were grown in minimal medium lacking thiamine and then shifted to rich medium containing thiamine to repress expression of the nmt1-T81:: dim1 + cassette. Samples were collected for analysis at 1-h intervals after shift. (a) KGY1180 (□) and KGY1216 (•) total cell number after shift to rich medium. (b) KGY1180 DNA content after shift to rich medium. (c and d) DAPI (c) and corresponding tubulin (d) staining of KGY1180 cells 13 h after shift.
Figure 6
Figure 6
dim1::his3 + mutant cells arrest in G2. dim1::his3 + or dim1 + cells carrying a single integrated copy of nmt1−T81:: dim1 + (KGY1180 or KGY1216, respectively) were grown in minimal medium lacking thiamine and then shifted to rich medium containing thiamine to repress expression of the nmt1-T81:: dim1 + cassette. Samples were collected for analysis at 1-h intervals after shift. (a) KGY1180 (□) and KGY1216 (•) total cell number after shift to rich medium. (b) KGY1180 DNA content after shift to rich medium. (c and d) DAPI (c) and corresponding tubulin (d) staining of KGY1180 cells 13 h after shift.
Figure 7
Figure 7
Deletion of CDH1 from the S. cerevisiae genome. (a) Cells were streaked to synthetic complete medium containing 1% galactose/1% raffinose (middle) or 2% glucose (right) and then incubated at 32°C for 2 d. (Left) cdh1::HIS 3 carrying: (1) MET25::CDH1 (KGY 572); (2) GALS::CDH1 (KGY965); (3) GALS::UBCDH1 (KGY1026); (4) MET25::dim1 + (KGY966); (5) GALS::dim1 + (KGY311); (6) GALS::UBdim1 +(KGY1023); (7) GALS::mdim1 (KGY1093). (b–d) Rescue of cdh1::HIS3 by GALS::CDH1 (b), GALS::dim1+ (c), or GALS::mdim1 (d). KGY 965 (b), KGY311 (c), or KGY1093 (d) was grown to midlog phase in SGR, fixed with ethanol, and stained with DAPI. Bar, 10 μM.
Figure 8
Figure 8
Phenotype of the cdh1::HIS3 mutant. (a) Growth of cdh1:: HIS3 GALS::UBdim1 + (KGY1023), and wild type (KGY820) after shift from SGR to SD. ▪, KGY820 total cell number; □, KGY820 viable cell number; •, KGY1023 total cell number; ○, KGY1023 viable cell number. (b) KGY1023 and KGY820 percent viability and percent of cells containing 2C DNA after shift from SGR to SD. □, KGY820 viability; ○, KGY1023 viability; ▪, KGY820 2C DNA; •, KGY1023 2C DNA. (c) Flow cytometric analysis showing DNA content of KGY820 (left) and KGY1023 (right) after shift from SGR to SD.
Figure 9
Figure 9
Relative histone H1 kinase activity in wild-type or temperature-sensitive mutant strains. Strains were grown to midlog phase at 25°C in YE medium and then shifted to 36.5°C for 4.5 h. Cells were collected and lysed. Lysates were subjected to immunoprecipitation using α-Cdc13p antibodies. Immunoprecipitates were assayed for histone H1 kinase activity and Cdc2 protein levels. Relative histone H1 kinase activity is expressed in arbitrary units as detectable histone H1 phosphorylation normalized to corresponding Cdc2p level.
Figure 10
Figure 10
TBZ sensitivity of dim1-35. (a) Wild-type (KGY28) or dim1-35 (KGY392) cells were streaked to YE agar containing 9 μg/ml TBZ dissolved in DMSO (right) or an equivalent amount of DMSO alone (left) and then incubated at 29°C for 3 d. (b and c) Phenotype of wild type cells (b) or dim1-35 cells (c) grown at 29°C for 6 h in YE medium containing 10 μg/ml TBZ. Cells were fixed with ethanol and stained with DAPI. Bar, 5 μm.

References

    1. Al-Khodairy F, Carr AM. DNA repair mutants defining G2 checkpoint pathways in Schizosaccharomyces pombe. . EMBO (Eur Mol Biol Organ) J. 1992;11:1343–1350. - PMC - PubMed
    1. Althoefer H, Schleiffer A, Wassmann K, Nordheim A, Ammerer G. Mcm1 is required to coordinate G2-specific transcription in Saccharomyces cerevisiae. . Mol Cell Biol. 1995;15:5917–5928. - PMC - PubMed
    1. Barbet N, Muriel WJ, Carr AM. Versatile shuttle vectors and genomic libraries for use with Schizosaccharomyces pombe. . Gene (Amst) 1992;114:59–66. - PubMed
    1. Basi G, Schmid E, Maundrell K. TATA box mutations in the Schizosaccharomyces pombe nmt1promoter affect transcription efficiency but not the transcription start point or thiamine repressibility. Gene (Amst) 1993;123:131–136. - PubMed
    1. Baum P, Yip C, Goetsch L, Byers B. A yeast gene essential for regulation of spindle pole duplication. Mol Cell Biol. 1988;8:5386–5397. - PMC - PubMed

Publication types

MeSH terms

Associated data