. 1997 Jun 16;137(6):1355-67.
doi: 10.1083/jcb.137.6.1355.

Amphiphysin II (SH3P9; BIN1), a member of the amphiphysin/Rvs family, is concentrated in the cortical cytomatrix of axon initial segments and nodes of ranvier in brain and around T tubules in skeletal muscle

Affiliations

Amphiphysin II (SH3P9; BIN1), a member of the amphiphysin/Rvs family, is concentrated in the cortical cytomatrix of axon initial segments and nodes of ranvier in brain and around T tubules in skeletal muscle

M H Butler et al. J Cell Biol. .

Abstract

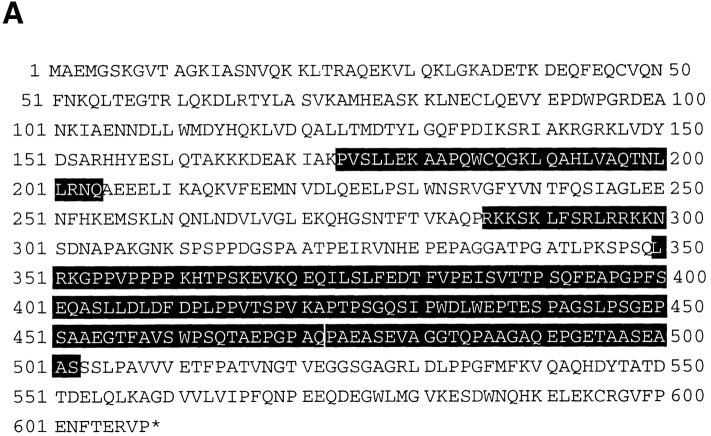
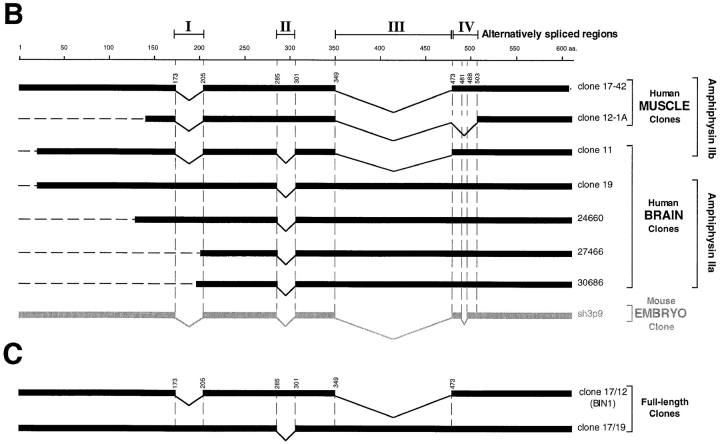
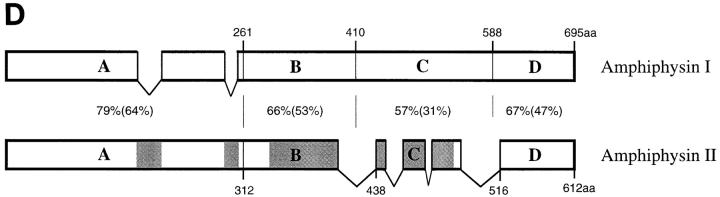
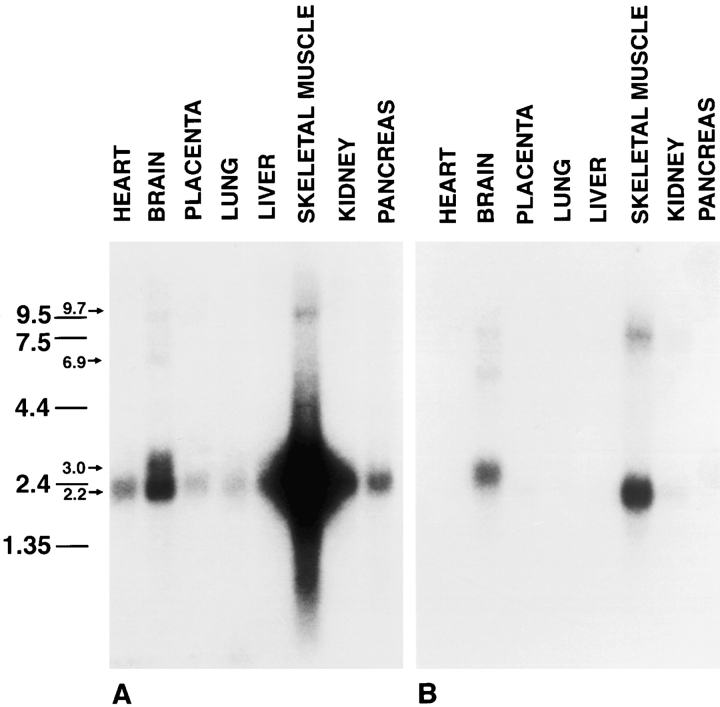
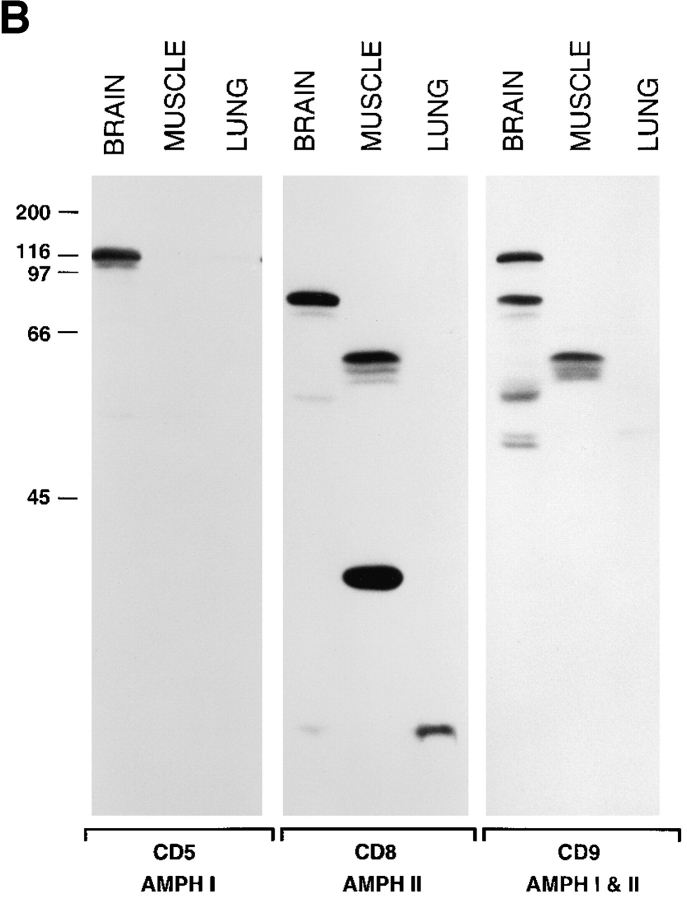
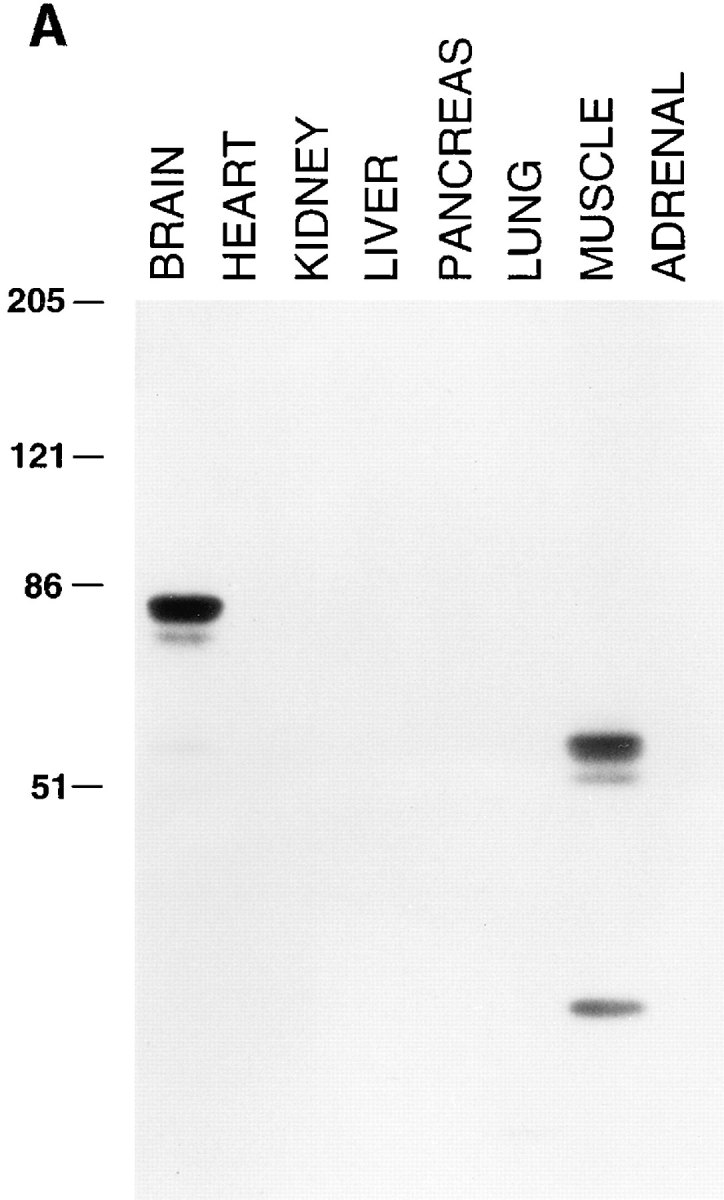
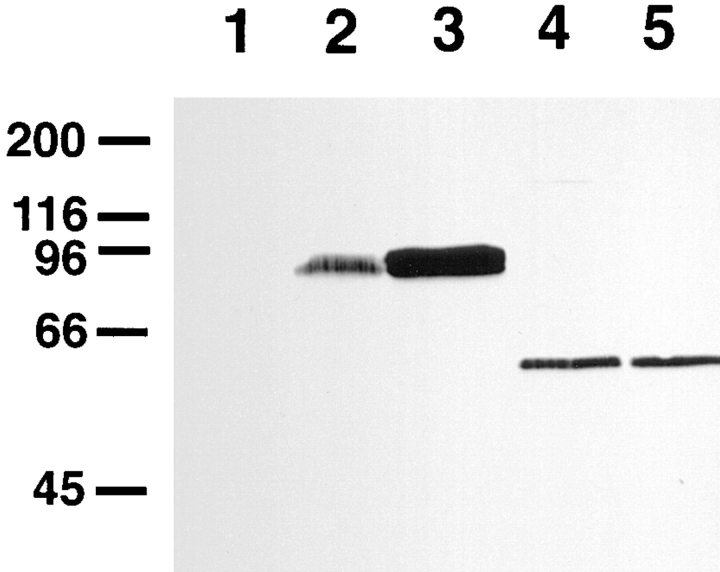
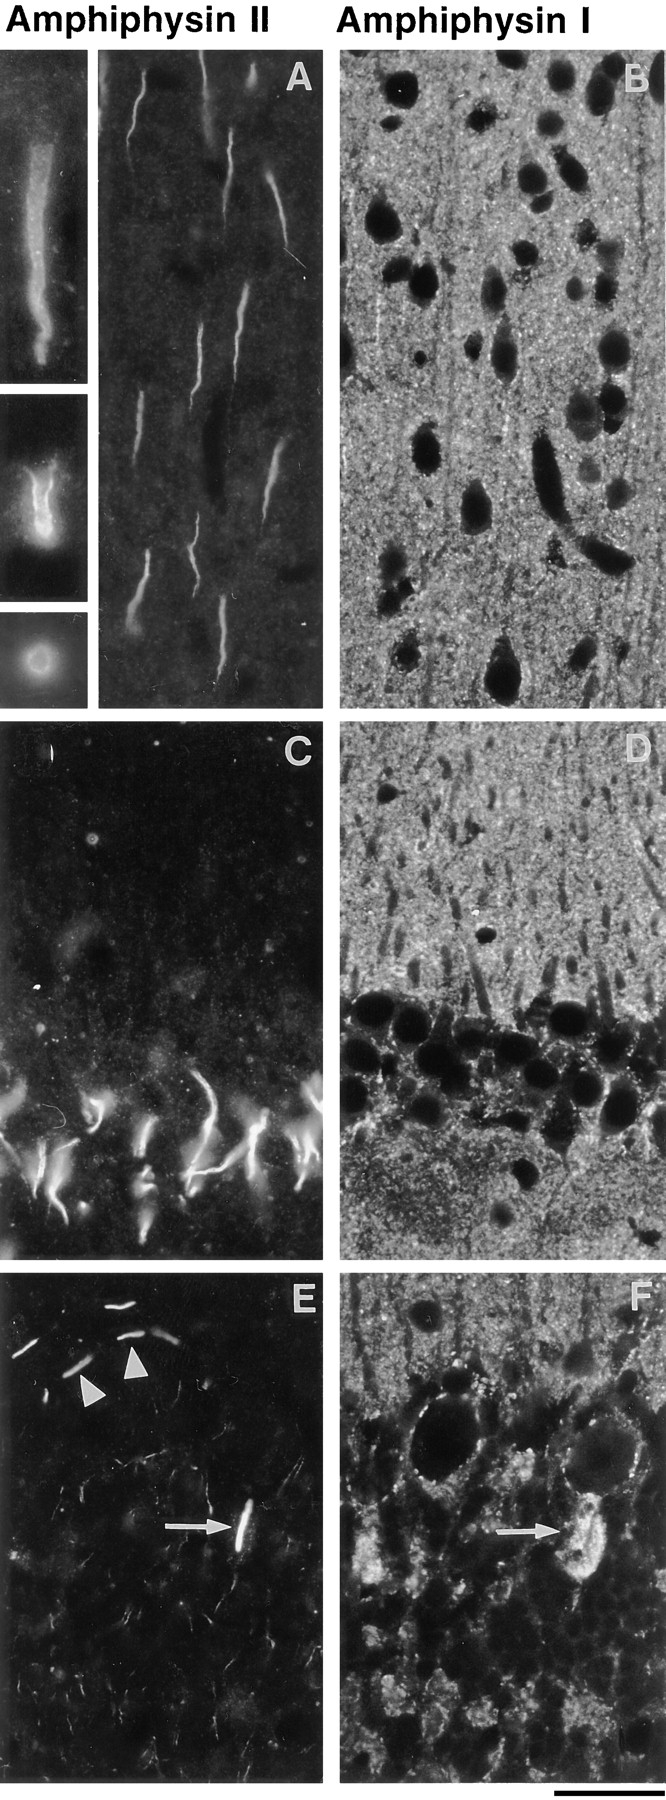
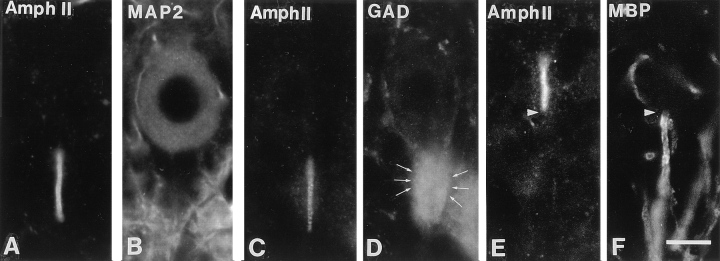
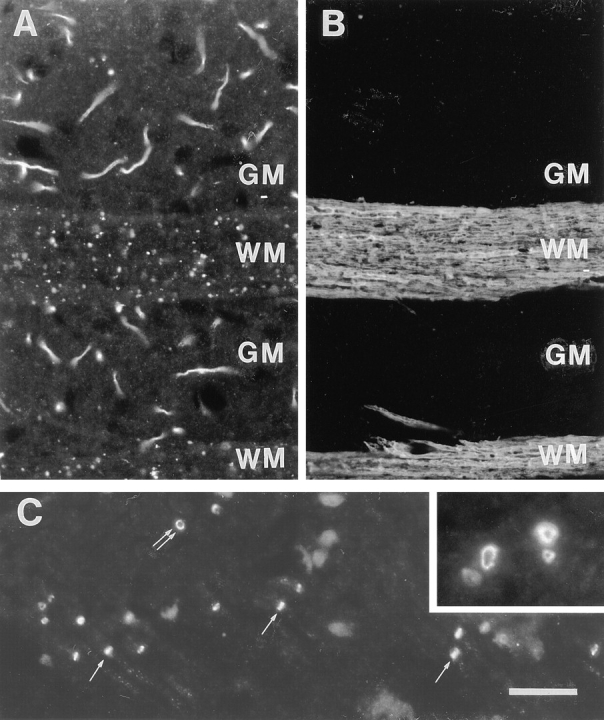
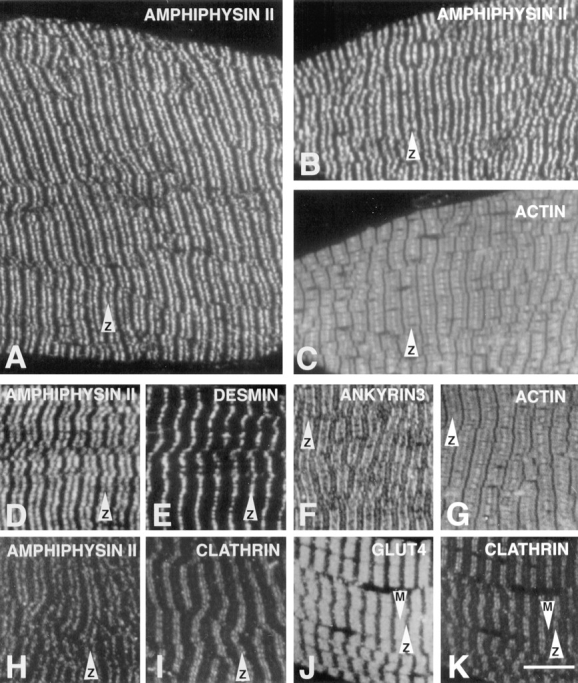
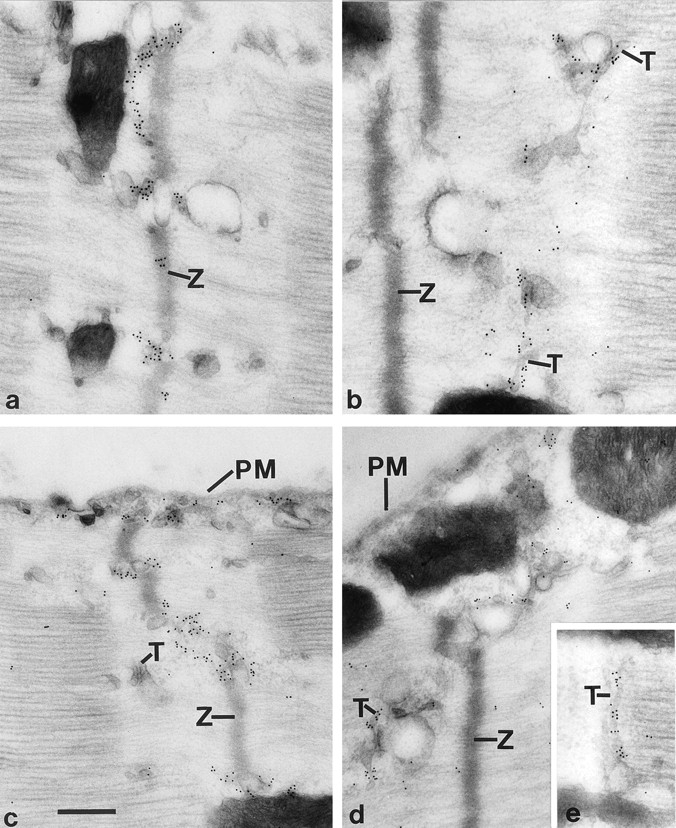
Amphiphysin (amphiphysin I), a dominant autoantigen in paraneoplastic Stiff-man syndrome, is a neuronal protein highly concentrated in nerve terminals, where it has a putative role in endocytosis. The yeast homologue of amphiphysin, Rvs167, has pleiotropic functions, including a role in endocytosis and in actin dynamics, suggesting that amphiphysin may also be implicated in the function of the presynaptic actin cytoskeleton. We report here the characterization of a second mammalian amphiphysin gene, amphiphysin II (SH3P9; BIN1), which encodes products primarily expressed in skeletal muscle and brain, as differentially spliced isoforms. In skeletal muscle, amphiphysin II is concentrated around T tubules, while in brain it is concentrated in the cytomatrix beneath the plasmamembrane of axon initial segments and nodes of Ranvier. In both these locations, amphiphysin II is colocalized with splice variants of ankyrin3 (ankyrinG), a component of the actin cytomatrix. In the same regions, the presence of clathrin has been reported. These findings support the hypothesis that, even in mammalian cells, amphiphysin/Rvs family members have a role both in endocytosis and in actin function and suggest that distinct amphiphysin isoforms contribute to define distinct domains of the cortical cytoplasm. Since amphiphysin II (BIN1) was reported to interact with Myc, it may also be implicated in a signaling pathway linking the cortical cytoplasm to nuclear function.


Figures

Figure 1
Figure 1
(A) Human amphiphysin II contiguous sequence obtained from a Pileup analysis of the human clones shown in B. Alternatively spliced regions are depicted by shaded amino acid residues. (B) Schematic representation of the human amphiphysin II clones analyzed in this study and of the mouse homologue of amphiphysin II previously reported (Sparks et al., 1996). The calibration bar (top) indicates number of amino acid residues. Alternatively spliced regions are indicated by roman numerals (I–IV). (C) Schematic representation of full length amphiphysin II clones assembled from clones 17-42 and 12-1A and from clones 19 and 1742, respectively. Clone 17/12 is identical to the recently reported BIN1 clone with the exception of a K→ E difference at position 434 of BIN1 and the corresponding position 591 of the contiguous sequence shown in Fig. 1 A (Sakamuro et al., 1996). (D) Domain diagram of human amphiphysins I and II showing the homology between the two genes. The boundaries of the A–D domains are delineated by amino acid numbers. A–D domains were previously defined as follows based on comparisons among human and chicken amphiphysin I and yeast Rvs proteins (David et al., 1994). The A, B, and D domains are the regions most highly conserved between chicken and human amphiphysin, while the C domain is poorly conserved. The A domain, within the A and B region, is defined by the yeast proteins Rvs161, which comprises this domain only. The percent similarity and identity (in parenthesis) for each domain is given. The shaded areas in the amphiphysin II gene represent the alternatively spliced regions outlined in Fig. 1 B.
Figure 1
Figure 1
(A) Human amphiphysin II contiguous sequence obtained from a Pileup analysis of the human clones shown in B. Alternatively spliced regions are depicted by shaded amino acid residues. (B) Schematic representation of the human amphiphysin II clones analyzed in this study and of the mouse homologue of amphiphysin II previously reported (Sparks et al., 1996). The calibration bar (top) indicates number of amino acid residues. Alternatively spliced regions are indicated by roman numerals (I–IV). (C) Schematic representation of full length amphiphysin II clones assembled from clones 17-42 and 12-1A and from clones 19 and 1742, respectively. Clone 17/12 is identical to the recently reported BIN1 clone with the exception of a K→ E difference at position 434 of BIN1 and the corresponding position 591 of the contiguous sequence shown in Fig. 1 A (Sakamuro et al., 1996). (D) Domain diagram of human amphiphysins I and II showing the homology between the two genes. The boundaries of the A–D domains are delineated by amino acid numbers. A–D domains were previously defined as follows based on comparisons among human and chicken amphiphysin I and yeast Rvs proteins (David et al., 1994). The A, B, and D domains are the regions most highly conserved between chicken and human amphiphysin, while the C domain is poorly conserved. The A domain, within the A and B region, is defined by the yeast proteins Rvs161, which comprises this domain only. The percent similarity and identity (in parenthesis) for each domain is given. The shaded areas in the amphiphysin II gene represent the alternatively spliced regions outlined in Fig. 1 B.
Figure 2
Figure 2
Northern blot analysis of human tissues demonstrating patterns of expression of amphiphysin II mRNAs. Two identical blots containing Poly(A+) RNA from a variety of tissues were probed with clone 17/12 (A) and a probe corresponding to alternatively spliced segment III (B). Note the different labeling patterns produced by the two probes. Amphiphysin II is expressed primarily in skeletal muscle and brain. Numbers at left indicate molecular weights (kb).
Figure 3
Figure 3
(A) Tissue distribution of amphiphysin II as demonstrated by Western blotting. Amphiphysin II is expressed primarily in brain and skeletal muscle. Equal protein amounts of post nuclear supernatants prepared from rat tissues were loaded in each lane and probed with the CD8 polyclonal rabbit serum specific for amphiphysin II. Bound antibodies were detected by 125Iprotein A. (B) Comparison of amphiphysin I and amphiphysin II expression in rat brain, skeletal muscle, and lung. Extracts of the three tissues were probed with an antibody specific for amphiphysin I (CD5), for amphiphysin II (CD8), and with an antibody that recognizes both amphiphysin I and II (CD9). Bound antibodies were detected by 125I-protein A. The low molecular weight bands labeled by the CD8 antibody are not visible in the brain and lung lanes of Fig. 3 A because they had migrated at the gel front. Numbers at left indicate molecular weights (kD).
Figure 3
Figure 3
(A) Tissue distribution of amphiphysin II as demonstrated by Western blotting. Amphiphysin II is expressed primarily in brain and skeletal muscle. Equal protein amounts of post nuclear supernatants prepared from rat tissues were loaded in each lane and probed with the CD8 polyclonal rabbit serum specific for amphiphysin II. Bound antibodies were detected by 125Iprotein A. (B) Comparison of amphiphysin I and amphiphysin II expression in rat brain, skeletal muscle, and lung. Extracts of the three tissues were probed with an antibody specific for amphiphysin I (CD5), for amphiphysin II (CD8), and with an antibody that recognizes both amphiphysin I and II (CD9). Bound antibodies were detected by 125I-protein A. The low molecular weight bands labeled by the CD8 antibody are not visible in the brain and lung lanes of Fig. 3 A because they had migrated at the gel front. Numbers at left indicate molecular weights (kD).
Figure 4
Figure 4
Comparison of the electrophoretic mobility of amphiphysin II expressed in COS-7 cells with the electrophoretic mobilities of muscle and brain amphiphysin II. Triton X-100 extracts of tissues and COS-7 cells were probed by Western blotting with the amphiphysin II specific antibody, CD7. Lanes are as follows: 1, control untransfected COS-7 cells; 2, rat brain; 3, COS-7 cells transfected with clone 17/19; 4, COS-7 cells transfected with clone 17/12; 5, skeletal muscle. Immunoreactive bands were detected by using alkaline phosphatase-conjugated anti–rabbit IgG. Numbers at left indicate molecular weights (kD).
Figure 5
Figure 5
Comparison of the localization of amphiphysin I (mouse polyclonal serum) and amphiphysin II (rabbit antibody CD8) in rat brain. Double immunofluorescence micrographs. In all fields, amphiphysin I immunoreactivity (B, D, and F) has a typical nerve terminal pattern represented by small puncta throughout the gray matter. Amphiphysin II (A, C, and E) is primarily localized at initial axon segments. (A and B) cerebral cortex. The inset of A shows high power views of two longitudinal sections and one transverse section of initial axon segments. Note the concentration of immunoreactivity in the cortical region of the cytoplasm. (C and D) CA1 region of the hippocampus demonstrating in C the initial axon segments of pyramidal neurons visible in D as negative images. (E and F) Cerebellar cortex. Arrows point to the amphiphysin II positive initial segment of a Purkinje cell axon, which is surrounded by amphiphysin I positive nerve terminals of basket cells. Arrowheads in E point to initial axon segments of stellate cells. Bar, 63 μm; inset, 126 μm.
Figure 6
Figure 6
Double immunofluorescence micrographs demonstrating the selective localization of amphiphysin II at axon initial segments. (A and B) Amphiphysin II-MAP2 immunostaining demonstrating the emergence of the amphiphysin II positive segment from the Purkinje cell body. (C and D) Amphiphysin II-GAD immunostaining demonstrating that the immunoreactive region of the axon corresponds to its region enclosed by the GABAnergic nerve terminals (arrows) of basket cells. (E and F) Amphiphysin II-myelin basic protein immunostaining demonstrating that amphiphysin II immunostaining terminates abruptly (arrowhead) at the site where the myelin sheath begins. Bar, 126 μm.
Figure 7
Figure 7
Localization of amphiphysin II at nodes of Ranvier. (A and B) Double immunofluorescence for amphiphysin II and myelin basic protein. Field shown is from the forebrain including two longitudinally sectioned white matter tracts. (A) Amphiphysin II positive axon initial segments are visible in the gray matter (GM). Small spots of amphiphysin II immunoreactivity visible on white matter tracts (WM) represent nodes of Ranvier. (C) White matter region in the brain stem demonstrating front (double arrows) and side (single arrows) views of nodes of Ranvier. The inset shows at high power a bundle of cross-sectioned axons demonstrating the localization of amphiphysin II in the cortical cytoplasm of nodes of Ranvier. Bar: (A and B) 27 μm; inset, 135 μm.
Figure 8
Figure 8
Immunofluorescence localization of amphiphysin II and other proteins of the sarcomere in skeletal muscle. Immunofluorescence of semithin frozen sections. Amphiphysin II immunoreactivity (A, B, D, and H) forms transverse bands that flank the Z line. B–K show pairs of double-fluorescence micrographs. (B and C) Amphiphysin II and actin (phalloidin staining); (D and E) amphiphysin II and desmin, a marker of the Z line; (F and G) ankyrin (ankyrin3) and actin; (H and I) amphiphysin II and clathrin heavy chain (antibody X22); (J and K) glut4 and clathrin. Arrows equal Z and M lines, as indicated. Bar, 7.9 μm.
Figure 9
Figure 9
Comparison of the localizations of desmin and amphiphysin II in skeletal muscle by electron microscopy immunocytochemistry. Ultrathin frozen sections were labeled by immunogold for desmin (A and C) and amphiphysin II (B, D and E). Desmin immunoreactivity is localized on a network of filamentous structures that are in register with Z lines. Amphiphysin is selectively localized at the T system and is present on T tubules (E). Z, Z lines; T, T tubules; PM, plasmalemma. Bar: (A, B, and E) 300 nm; (C and D) 378 nm.
Figure 10
Figure 10
Immunofluorescence localization of amphiphysin II in transfected cells. (A) COS-7 cells transfected with clone 17-12 and examined by conventional epifluorescence light microscopy. (B and C) HepG2 cells transfected with clone 17/12 and examined by confocal microscopy. The slight fluorescence visible in A over the nuclei is out of the nuclei focal plane. Bar, (A) 12.6 μm; (B and C) 9.0 μm.

References

    1. Amberg DC, Basart E, Botstein D. Defining protein interactions with yeast actin in vivo. Nat Struct Biol. 1995;2:28–35. - PubMed
    1. Bauer F, Urdaci M, Aigle M, Crouzet M. Alteration of a yeast SH3 protein leads to conditional viability with defects in cytoskeletal and budding patterns. Mol Cell Biol. 1993;13:5070–5084. - PMC - PubMed
    1. Bogue CW, Gross I, Vasavada H, Dynia DW, Wilson CM, Jacobs HD. Identification of Hox genes in newborn lung and effects of gestational age and retinoic acid on their expression. Am J Physiol. 1994;266:L448–454. - PubMed
    1. Brodsky FM. Clathrin structure characterized with monoclonal antibodies. I. Analysis of multiple antigenic sites. J Cell Biol. 1985;101:2047–2054. - PMC - PubMed
    1. Campos-Ortega JA, Glees P, Neuhoff V. Ultrastructural analysis of individual layers in the lateral geniculate body of the monkey. Z Zellforsch Mikrosk Anat. 1968;87:82–100. - PubMed

Publication types

MeSH terms

Associated data