. 1997 Jun 16;185(12):2133-41.
doi: 10.1084/jem.185.12.2133.

In vivo detection of dendritic cell antigen presentation to CD4(+) T cells

Affiliations

In vivo detection of dendritic cell antigen presentation to CD4(+) T cells

E Ingulli et al. J Exp Med. .

Abstract

Although lymphoid dendritic cells (DC) are thought to play an essential role in T cell activation, the initial physical interaction between antigen-bearing DC and antigen-specific T cells has never been directly observed in vivo under conditions where the specificity of the responding T cells for the relevant antigen could be unambiguously assessed. We used confocal microscopy to track the in vivo location of fluorescent dye-labeled DC and naive TCR transgenic CD4(+) T cells specific for an OVA peptide-I-Ad complex after adoptive transfer into syngeneic recipients. DC that were not exposed to the OVA peptide, homed to the paracortical regions of the lymph nodes but did not interact with the OVA peptide-specific T cells. In contrast, the OVA peptide-specific T cells formed large clusters around paracortical DC that were pulsed in vitro with the OVA peptide before injection. Interactions were also observed between paracortical DC of the recipient and OVA peptide-specific T cells after administration of intact OVA. Injection of OVA peptide-pulsed DC caused the specific T cells to produce IL-2 in vivo, proliferate, and differentiate into effector cells capable of causing a delayed-type hypersensitivity reaction. Surprisingly, by 48 h after injection, OVA peptide-pulsed, but not unpulsed DC disappeared from the lymph nodes of mice that contained the transferred TCR transgenic population. These results demonstrate that antigen-bearing DC directly interact with naive antigen-specific T cells within the T cell-rich regions of lymph nodes. This interaction results in T cell activation and disappearance of the DC.


Figures

Figure 1
Figure 1
Visualization of OVA peptide–MHC-bearing DC and CD4+ T cell interactions in situ. CMFDA-labeled DO11.10 T cells (green) and CMTMR-labeled DC (red) were purified, dye-labeled and injected into recipient mice as described in Materials and Methods. Draining popliteal lymph nodes were harvested 24 h after DC injections. Tissue was processed and analyzed by confocal microscopy as described in Materials and Methods. The full-width half peak resolution of the sampling volume was 4.5–5.0 μm; in other words, the optical thickness of each image is 4.5–5 μm. Images were taken from lymph nodes of mice injected with (A) OVA peptidepulsed DC or (B) unpulsed DC. Follicular regions, defined on adjacent sections as areas rich in B220+ cells, are indicated (*). Bar, 150 μm.
Figure 2
Figure 2
In vivo clustering of OVA peptide–MHC-bearing DC and DO11.10 T cells. DO11.10 T cells (green) and DC (red) were purified, dye-labeled and injected into recipient mice as described in Materials and Methods. Draining popliteal lymph nodes were harvested 4, 8, 24, and 48 h after DC injections. Tissue was processed and analyzed by confocal microscopy as described in Materials and Methods. The optical thickness of each image is 4.5–5 μm. Images were taken from paracortical regions of lymph nodes of mice injected with (A) OVA peptidepulsed DC or (B) unpulsed DC. Bar, 100 μm.
Figure 3
Figure 3
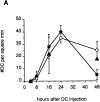
Kinetics of DC appearance and cluster formation in draining lymph nodes. CMFDAlabeled DO11.10 (circles) or polyclonal BALB/c (triangles) CD4+ T cells were injected intravenously into BALB/c recipient mice the day before CMTMRlabeled OVA peptide-pulsed (closed symbols) or unpulsed (open symbols) DC were injected subcutaneously into the hind foot pads. Draining popliteal lymph nodes were harvested at the indicated times after DC injection and analyzed with two-color confocal immunofluorescent microscopy as described in Materials and Methods. One image was collected per 24-μm section to ensure that individual fluorescent cells were only counted once. An interaction was defined as two or more green T cells overlapping a red DC such that a yellow area was produced. The number of DC (A) and DC engaged in T cell interactions (B) were quantified per unit area (mm2) of lymph node. The results represent the mean values ± SD of 2–3 mice/group (except for the results from the polyclonal BALB/c T cell group, which came from a single animal) derived from a single experiment. Similar values were obtained in two other independent experiments.
Figure 3
Figure 3
Kinetics of DC appearance and cluster formation in draining lymph nodes. CMFDAlabeled DO11.10 (circles) or polyclonal BALB/c (triangles) CD4+ T cells were injected intravenously into BALB/c recipient mice the day before CMTMRlabeled OVA peptide-pulsed (closed symbols) or unpulsed (open symbols) DC were injected subcutaneously into the hind foot pads. Draining popliteal lymph nodes were harvested at the indicated times after DC injection and analyzed with two-color confocal immunofluorescent microscopy as described in Materials and Methods. One image was collected per 24-μm section to ensure that individual fluorescent cells were only counted once. An interaction was defined as two or more green T cells overlapping a red DC such that a yellow area was produced. The number of DC (A) and DC engaged in T cell interactions (B) were quantified per unit area (mm2) of lymph node. The results represent the mean values ± SD of 2–3 mice/group (except for the results from the polyclonal BALB/c T cell group, which came from a single animal) derived from a single experiment. Similar values were obtained in two other independent experiments.
Figure 4
Figure 4
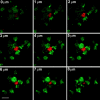
Detailed analysis of a DC–T cell cluster. A series of optical sections was taken at 1-μm intervals through a dendritic cell that appeared to be surrounded by T cells 24 h after the injection of OVA peptide-pulsed DC. At this magnification, the optical thickness of each image is ∼0.6 μm. Bar, 10 μm.
Figure 5
Figure 5
Flow cytometric detection of intracellular IL-2. DO11.10 recipient mice were injected subcutaneously in the hind foot pads with OVA peptide-pulsed or unpulsed DC. Draining popliteal lymph node cells were harvested 8 and 24 h later, and stained for intracellular IL-2 protein as described in Materials and Methods. A gate was drawn on the CD4+, KJ1-26+ (R2), or CD4+, KJ1-26 (R3) cells from each group based on a dot plot of the type shown in A. The amount of IL-2 staining is expressed as a histogram for CD4+, KJ1-26+ (B) or CD4+, KJ1-26 (C) cells from mice injected 24 h previously with OVA peptide-pulsed (thick line) or unpulsed (dashed line) DC. The mean percentage of IL-2+ cells (± range) in the M1 gate (see B and C) from two individual mice/group is shown in D. Similar results were obtained in an independent experiment.
Figure 5
Figure 5
Flow cytometric detection of intracellular IL-2. DO11.10 recipient mice were injected subcutaneously in the hind foot pads with OVA peptide-pulsed or unpulsed DC. Draining popliteal lymph node cells were harvested 8 and 24 h later, and stained for intracellular IL-2 protein as described in Materials and Methods. A gate was drawn on the CD4+, KJ1-26+ (R2), or CD4+, KJ1-26 (R3) cells from each group based on a dot plot of the type shown in A. The amount of IL-2 staining is expressed as a histogram for CD4+, KJ1-26+ (B) or CD4+, KJ1-26 (C) cells from mice injected 24 h previously with OVA peptide-pulsed (thick line) or unpulsed (dashed line) DC. The mean percentage of IL-2+ cells (± range) in the M1 gate (see B and C) from two individual mice/group is shown in D. Similar results were obtained in an independent experiment.
Figure 6
Figure 6
Kinetics of clonal expansion induced by injection of OVA peptide-pulsed or unpulsed DC. BALB/c recipients of DO11.10 T cells were injected subcutaneously in the hind foot pad with 0.5 × 10⁶ OVA peptide-pulsed DC (closed circles), 0.5 × 10⁶ unpulsed DC (open circles), or nothing (open squares). The draining popliteal lymph nodes were harvested at various time points after injection. Flow cytometric analysis was performed on 10,000 lymph node cells from each group after staining to obtain the percentage of CD4+, KJ1-26+ cells present at each time point. The total number of CD4+, KJ1-26+ cells was calculated by multiplying the percentage of CD4+, KJ1-26+ cells by the total number of lymph node cells obtained from a viable cell count. The results represent the mean values ± range of two mice from a single experiment. Similar values were obtained from three other independent experiments.
Figure 7
Figure 7
DTH response. DO11.10 recipient mice were injected subcutaneously in the hind foot pad with 0.5 × 10⁶ OVA peptide-pulsed or unpulsed DC. In addition, normal BALB/c mice were injected with 0.5 × 10⁶ OVA peptide-pulsed DC. 7 d after the initial injection, all mice were rechallenged with an intradermal injection of soluble intact OVA (10 μg) in the ears. The results represent the mean ear swelling values ± SD of 2–4 ears/group derived from a single experiment. Similar values were obtained from three other independent experiments.
Figure 8
Figure 8
Endogenous DC cluster DO11.10 T cells in the presence of antigen. DO11.10 SCID T cells were purified, CMFDA-labeled (green), and injected into recipient mice as described in Materials and Methods. The next day recipient mice were injected subcutaneously with 45 μg of OVA–hen egg lysozyme conjugate (A) or nothing (B). 24 h later, draining popliteal lymph nodes were harvested, sectioned, fixed in acetone, and stained sequentially with biotin-labeled DC-specific mAb N418, biotin-labeled goat anti–hamster IgG and Cy 3–labeled SA to detect endogenous paracortical DC (red). Tissue was analyzed by confocal microscopy as described in Materials and Methods. The optical thickness of each image is 2–3 μm. Images shown were from paracortical regions of the lymph nodes. Bar, 100 μm.

References

    1. Steinman RM. The dendritic cell system and its role in immunogenicity. Annu Rev Immunol. 1991;9:271–296. - PubMed
    1. Luther SA, Gulbranson-Judge A, Acha-Orbea H, MacLennan I. Viral superantigen drives extrafollicular and follicular B cell differentiation leading to virus-specific antibody production. J Exp Med. 1997;185:551–562. - PMC - PubMed
    1. Kudo S, Matsuno K, Ezaki T, Ogawa M. A novel migration pathway for rat dendritic cells from the blood: hepatic sinusoids-lymph translocation. J Exp Med. 1997;185:777–784. - PMC - PubMed
    1. Tse HY, Schwartz RH, Paul WE. Cell-cell interactions in the T cell proliferative response. J Immunol. 1980;125:401–500. - PubMed
    1. Kearney ER, Pape KA, Loh DY, Jenkins MK. Visualization of peptide-specific T cell immunity and peripheral tolerance induction in vivo. Immunity. 1994;1:327–339. - PubMed

Publication types