. 1997 Jun 16;185(12):2157-70.
doi: 10.1084/jem.185.12.2157.

On the key role of secondary lymphoid organs in antiviral immune responses studied in alymphoplastic (aly/aly) and spleenless (Hox11(-)/-) mutant mice

Affiliations

On the key role of secondary lymphoid organs in antiviral immune responses studied in alymphoplastic (aly/aly) and spleenless (Hox11(-)/-) mutant mice

U Karrer et al. J Exp Med. .

Abstract

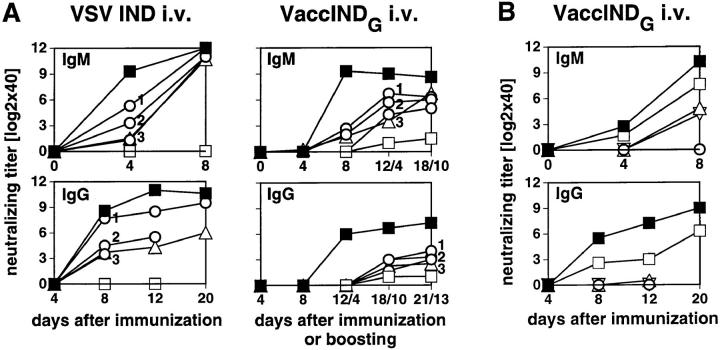
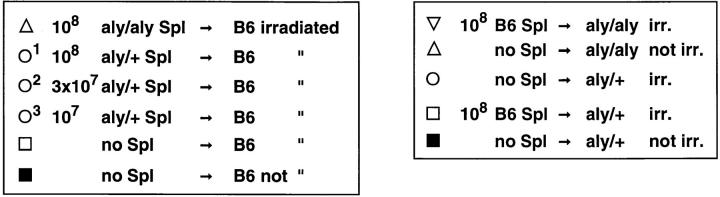
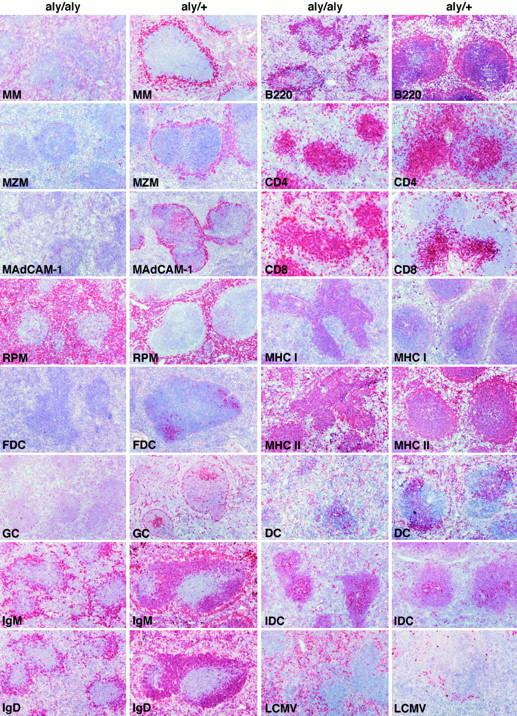
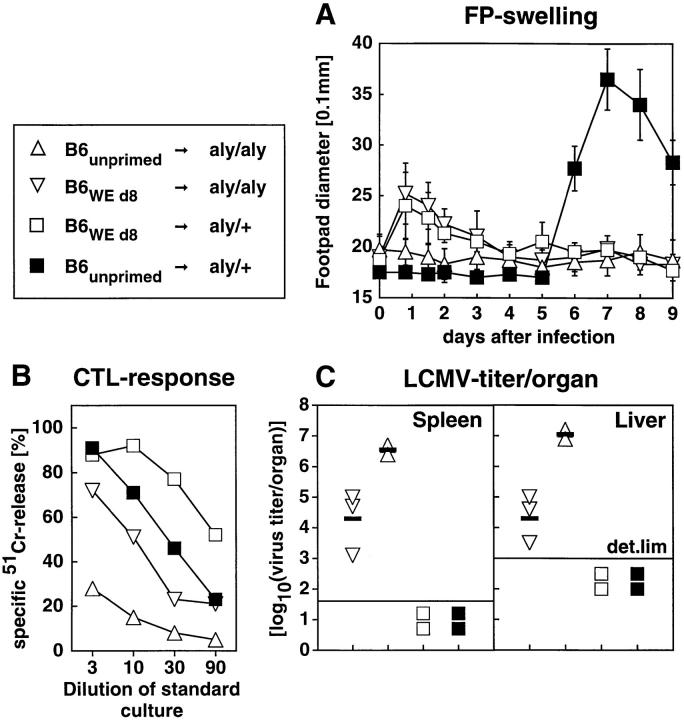
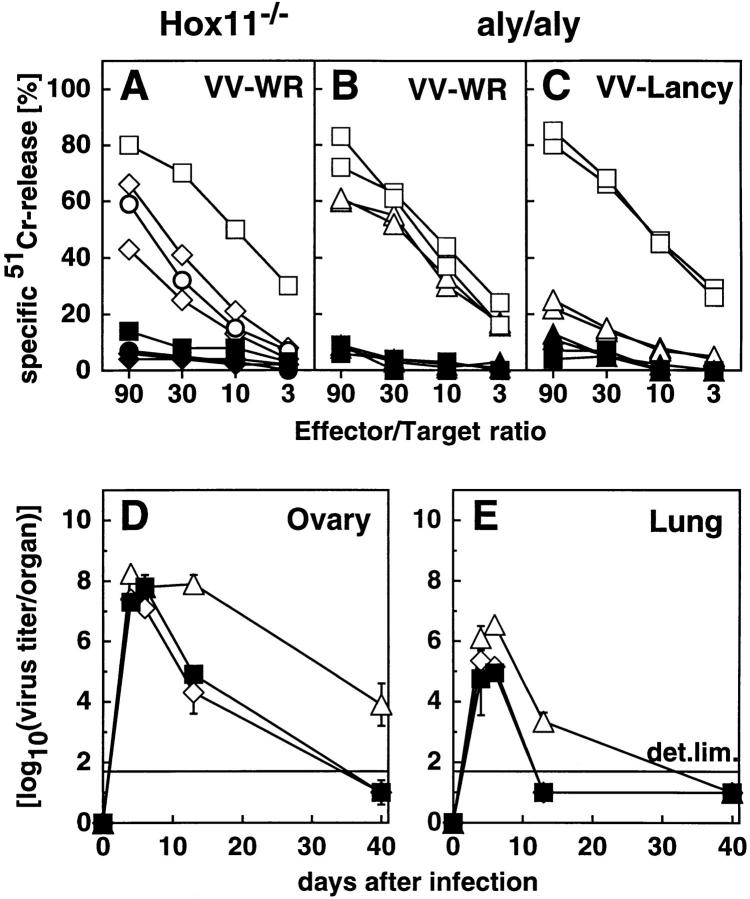
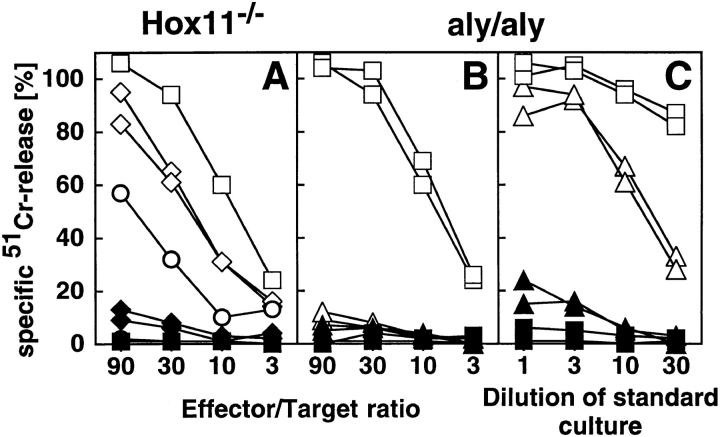
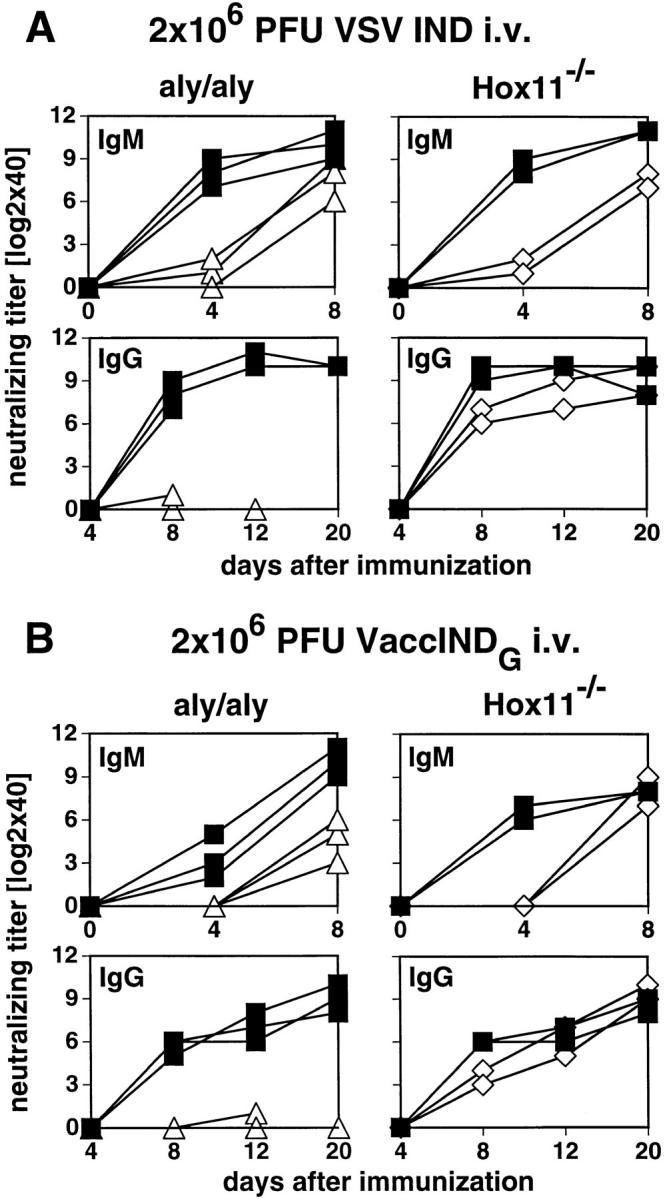
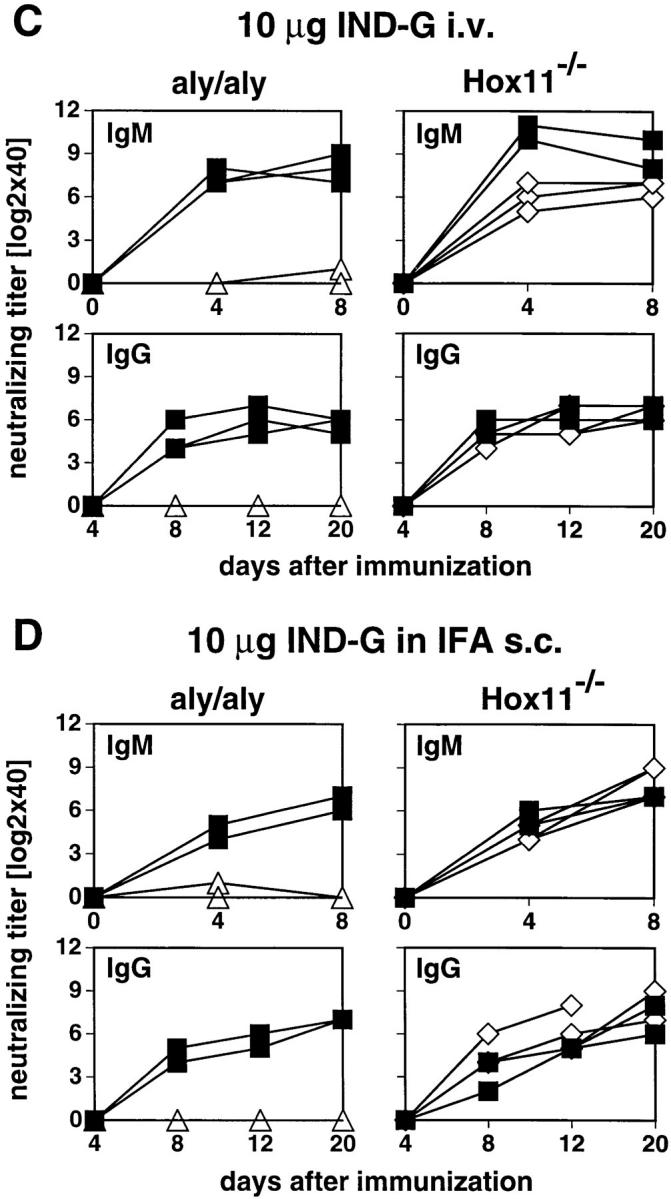
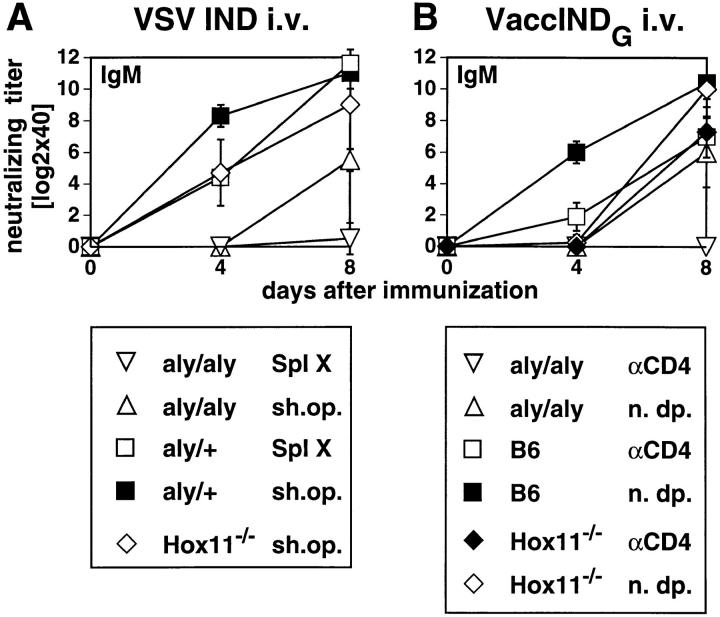
The role of the spleen and of other organized secondary lymphoid organs for the induction of protective antiviral immune responses was evaluated in orphan homeobox gene 11 knockout mice (Hox11(-/-)) lacking the spleen, and in homozygous alymphoplastic mutant mice (aly/aly) possessing a structurally altered spleen but lacking lymph nodes and Peyer's patches. Absence of the spleen had no major effects on the immune response, other than delaying the antibody response by 1-2 d. In aly/aly mice, the thymus-independent IgM response against vesicular stomatitis virus (VSV) was delayed and reduced, whereas the T-dependent switch to the protective IgG was absent. Therefore, aly/aly mice were highly susceptible to VSV infection. Since aly/aly spleen cells yielded neutralizing IgM and IgG after adoptive transfer into recipients with normally structured secondary lymphoid organs, these data suggest that the structural defect was mainly responsible for inefficient T-B cooperation. Although aly/aly mice generated detectable, but reduced, CTL responses after infection with vaccinia virus (VV) and lymphocytic choriomeningitis virus (LCMV), the elimination of these viruses was either delayed (VV) or virtually impossible (LCMV); irrespective of the dose or the route of infection, aly/aly mice developed life-long LCMV persistence. These results document the critical role of organized secondary lymphoid organs in the induction of naive T and B cells. These structures also provide the basis for cooperative interactions between antigen-presenting cells, T cells, and B cells, which are a prerequisite for recovery from primary virus infections via skin or via blood.


Figures

Figure 8
Figure 8
VSV-neutralizing Ab responses of irradiated recipients after AT of naive spleen cells. Recipients were irradiated with 5.0 gray on day −2 and adoptively transfused with various numbers of spleen cells on day −1 and then immunized with 2 × 10⁶ PFU live VSV IND or VaccINDG intravenously on day 0 and boosted on day 8 with the same antigen (8 A, right). Blood was taken from the mice at the indicated time points after priming or boosting and the neutralizing IgM (top) or IgG titers (bottom) were measured. (A) ▵, AT of 108 aly/aly spleen cells into irradiated B6; ○, AT of 108, 3 × 10⁷ or 107 aly/+ spleen cells into irradiated B6; □, irradiated B6 not receiving cells; ▪, untreated B6. no Spl, no spleen cells transferred. (B) ▿, AT of 108 B6 spleen cells into irradiated aly/aly; ▵, untreated aly/aly; ○, irradiated aly/aly not receiving cells; □, AT of 108 B6 spleen cells into irradiated aly/+; ▪, untreated aly/+ mice. no Spl, no spleen cells transferred; irr., irradiated. Each line represents the mean of four mice, variations of individual mice were below two 1:2 dilution steps.
Figure 8
Figure 8
VSV-neutralizing Ab responses of irradiated recipients after AT of naive spleen cells. Recipients were irradiated with 5.0 gray on day −2 and adoptively transfused with various numbers of spleen cells on day −1 and then immunized with 2 × 10⁶ PFU live VSV IND or VaccINDG intravenously on day 0 and boosted on day 8 with the same antigen (8 A, right). Blood was taken from the mice at the indicated time points after priming or boosting and the neutralizing IgM (top) or IgG titers (bottom) were measured. (A) ▵, AT of 108 aly/aly spleen cells into irradiated B6; ○, AT of 108, 3 × 10⁷ or 107 aly/+ spleen cells into irradiated B6; □, irradiated B6 not receiving cells; ▪, untreated B6. no Spl, no spleen cells transferred. (B) ▿, AT of 108 B6 spleen cells into irradiated aly/aly; ▵, untreated aly/aly; ○, irradiated aly/aly not receiving cells; □, AT of 108 B6 spleen cells into irradiated aly/+; ▪, untreated aly/+ mice. no Spl, no spleen cells transferred; irr., irradiated. Each line represents the mean of four mice, variations of individual mice were below two 1:2 dilution steps.
Figure 1
Figure 1
Immunohistochemical analysis of aly/aly and aly/+ spleens. Spleen sections of unimmunized (exception: LCMV staining) aly/aly and aly/+ mice were stained with Abs of the indicated specificity. MM, MOMA-1; MZM, ERTR-9; MAdCAM-1 on endothelial cells of the marginal sinus, MECA-367; RPM, F4/80; FDC, 4C11; GC, PNA; IgM, surface IgM+ B cells, R6-60.2; IgD, surface IgD+ B cells, 217-170; B220, CD45R+ B cells, RA3-6B2; CD4, CD4+ T cells, YTS-191; CD8, CD8+ T cells, YTS-169; MHC I, H-2Kbdk, M1/42; MHC II, Iabdq on macrophages, DC, and B cells, M5/114; IDC, NLDC-145; DC, CD11c on dendritic cells N418; LCMV, LCMV-infected cells 8 d after infection with 200 PFU LCMV-WE intravenously, VL-4. Original magnification: 100-fold for all panels.
Figure 2
Figure 2
CTL response, footpad swelling reaction, and blood virus titer after LCMV infection of aly/aly and Hox11−/− mice. Mice were immunized with 200 PFU LCMV-WE intravenously (A, left, B and D), LCMV-Arm intravenously (A, right), or 100 PFU LCMV-WE into both hind footpads (i.fp., A, middle, and C). After 8 d, spleens were removed and single cell suspensions were tested directly ex vivo in a conventional 51Cr–release assay (primary [1°] CTL ex vivo) with LCMV-infected (open symbols) or untreated (closed symbols) MC57G as target cells. ▵ ▴, aly/aly spleen cells; ⋄ ♦, Hox11−/− LN cells; □ ▪, spleen cells of control B6 mice; ○ •, LN cells of control B6. Each line represents an individual mouse with the exception of the B6 mice in A, middle and right (squares and circles) representing the mean of three mice. (B) spleens were removed at the indicated time points after infection with 200 PFU LCMV-WE intravenously and restimulated in vitro for 5 d (secondary [2°] CTL after in vitro restimulation) with irradiated LCMV-infected spleen cells. Cultures were then tested on LCMV-infected (open symbols) or untreated (closed symbols) MC57G cells radioactively labeled with 51Cr. ▵ ▴, aly/aly mice; □ ▪, aly/+ control mice. Each line represents one individual mouse. (C) mice were infected with 100 PFU LCMV-WE into both hind footpads. The footpad thickness was measured daily with a spring-loaded caliper. ▵, aly/aly mice; ⋄, Hox11−/− mice; ▪, B6 controls. Each line represents the mean of both hind footpads of three mice. Error bars indicate the SD within the experimental group. Results of one (out of three) similar experiment are shown. (D) Mice were infected with 200 PFU LCMV-WE intravenously. Blood was taken at the indicated time points and virus titers were determined as described (24). LCMV titers are given as log10 (virus titer/ml blood). ▵, aly/aly mice; ⋄, Hox11−/− mice; ▪, control B6 mice. Each line represents one mouse. Data of 4 mice/group are shown. The detection limit of the assay is indicated (det. lim.). One out of two similar experiments is shown.
Figure 3
Figure 3
LCMV-specific immune response of aly/aly mice after adoptive transfer (AT) of naive or LCMV-primed B6 spleen cells. Recipient mice were infected with 2 × 10⁵ LCMV-WE into the footpads. 3 h later, 5 × 10⁷ naive or day 8 LCMV-WE–primed B6 spleen cells were adoptively transferred. ▵, aly/aly recipients, adoptively transfused with naive B6 spleen cells; ▿, aly/aly recipients transfused with day-8 LCMVprimed B6 spleen cells; □ aly/+ recipients transfused with day-8 LCMVprimed B6 spleen cells; ▪ aly/+ recipients transfused with naive B6 spleen cells. The footpad swelling reaction was monitored daily (A). Means and SD are given for both hind footpads of two to three mice per group in a 0.1-mm scale. The CTL response was measured on day 9 after infection (B). The spleen cells were restimulated with irradiated LCMV-infected spleen cells for 5 d. Cultures were then tested on LCMV-infected 51Cr-labeled MC57G cells. Unspecific lysis of uninfected targets was <10%. Each line represents the mean of two to three mice. LCMV titers in spleen and liver on day 9 after infection (C). Single values of individual mice, means (horizontal bars) and the detection limit (det. lim.) of the assay are indicated. Values are given as log10(PFU per organ). The data represent one out of two comparable experiments.
Figure 4
Figure 4
VV-specific CTL response and VV clearance. Mice were infected with 2 × 10⁶ VV-WR (A, B, D, and E) or VV-Lancy (C). On day 6, spleens and/or LN were removed and directly tested in a standard 51Cr–release assay (A–C). (Open symbols) VV-infected 51Cr-labeled MC57G cells (A–C) as target cells. (Closed symbols) Uninfected target cells. ▵ ▴, aly/aly spleen cells; ⋄ ♦, Hox11−/− LN cells; □ ▪, control B6 spleen cells; ○ •, control B6 LN cells. Each line represents one individual mouse with the exception of the controls in A (squares and circles) where the mean of three mice is shown. D and E show VV titer in ovary and lung given as log10(PFU per organ) at different time points after infection with 2 × 10⁶ PFU VV-WR intravenously. Each line represents the mean and the SD of three mice per group. The detection limit of the assay (det. lim.) is indicated. ▵, aly/aly mice; ⋄, Hox11−/− mice; ▪, B6 control mice. Data of one of two comparable experiments is shown.
Figure 5
Figure 5
VSV-specific CTL response. Mice were infected with 2 × 10⁶ live VSV IND intravenously. On day 6, spleens and LN were removed and directly tested in a standard 51Cr–release assay (A and B). Alternatively, spleen cells were restimulated in vitro for 5 d with VSV-infected and irradiated spleen cells (C) before cultures were tested. (Open symbols) VSV infected MC57G cells as target cells. (Closed symbols) Uninfected target cells. ▵ ▴, aly/aly spleen cells; ⋄ ♦, Hox11−/− LN cells; □ ▪, control B6 spleen cells; ○ •, control B6 LN cells. Each line represents one individual mouse, with the exception of the controls in A (squares and circles) where the average of three mice is shown. Data of one out of three representative experiments is shown.
Figure 6
Figure 6
VSV-neutralizing IgM and IgG responses. Mice were immunized with 2 × 10⁶ PFU live VSV IND intravenously (A), 2 × 10⁶ PFU VaccINDG intravenously (B), or with 10 μg IND-G in balanced salt solution intravenously (C), or emulsified in IFA and injected subcutaneously at the base of tail (D). Blood was taken at the indicated time points and the neutralizing IgM (upper panels) or IgG titers (lower panels) were determined in the sera. Titers represent log2 dilutions of 40-fold prediluted sera. ▵, aly/aly mice; ⋄, Hox11−/− mice; ▪, B6 control mice. Each line represents one individual mouse. One out of three similar experiments is shown.
Figure 6
Figure 6
VSV-neutralizing IgM and IgG responses. Mice were immunized with 2 × 10⁶ PFU live VSV IND intravenously (A), 2 × 10⁶ PFU VaccINDG intravenously (B), or with 10 μg IND-G in balanced salt solution intravenously (C), or emulsified in IFA and injected subcutaneously at the base of tail (D). Blood was taken at the indicated time points and the neutralizing IgM (upper panels) or IgG titers (lower panels) were determined in the sera. Titers represent log2 dilutions of 40-fold prediluted sera. ▵, aly/aly mice; ⋄, Hox11−/− mice; ▪, B6 control mice. Each line represents one individual mouse. One out of three similar experiments is shown.
Figure 7
Figure 7
VSV-neutralizing Ab response of aly/aly, Hox11−/−, and B6 control mice after splenectomy and immunization with VSV IND (A) or after depletion of CD4+ T cells and immunization with VaccINDG (B). (A) Mice were splenectomized or sham operated and 3 wk later they were immunized with 2 × 10⁶ PFU live VSV IND intravenously. Blood was taken at the indicated time points and the neutralizing IgM titer was determined. Each line represents the mean of four mice; error bars indicate the SD. ▵, aly/aly mice, sham operated; ▿, splenectomized aly/aly mice; □, splenectomized aly/+ controls; ▪, aly/+ controls, sham operated; ⋄, Hox11−/−, sham operated. Spl X, splenectomized; sh.op., sham operated. Data from one of two independent experiments are shown. (B) Mice were depleted of CD4+ T cells and then immunized with 2 × 10⁶ PFU VaccINDG intravenously. Blood was taken at the indicated time points and the neutralizing IgM titer was determined. Efficiency of depletion was confirmed by FACS® analysis at the day of immunization and at day 8. Each line represents the mean of three to four mice, error bars indicate the SD. ▿, aly/aly mice, CD4 depleted; ▵, aly/aly mice, not depleted; □, B6 controls, CD4 depleted; ▪, B6 controls, not depleted; ♦, Hox11−/−, CD4 depleted; ⋄, Hox11−/−, not depleted. αCD4, depleted of CD4+ T cells; n.dp., not depleted. Data from one of three independent experiments are shown.

References

    1. Paul, W.E. 1993. Fundamental Immunology. Raven Press, New York. 1490 pp.
    1. Mackay CR. Homing of naive, memory and effector lymphocytes. Curr Opin Immunol. 1993;5:423–427. - PubMed
    1. Picker LJ, Butcher EC. Physiological and molecular mechanisms of lymphocyte homing. Annu Rev Immunol. 1992;10:561–591. - PubMed
    1. Mueller DL, Jenkins MK, Schwartz RH. Clonal expansion versus functional clonal inactivation: a costimulatory signalling pathway determines the outcome of T cell antigen receptor occupancy. Annu Rev Immunol. 1989;7:445–480. - PubMed
    1. Matzinger P. Tolerance, danger, and the extended family. Annu Rev Immunol. 1994;12:991–1045. - PubMed

Publication types

MeSH terms