. 1997 Jul 1;17(13):4942-55.
doi: 10.1523/JNEUROSCI.17-13-04942.1997.

Redox modulation of hslo Ca2+-activated K+ channels

Affiliations

Redox modulation of hslo Ca2+-activated K+ channels

T J DiChiara et al. J Neurosci. .

Abstract

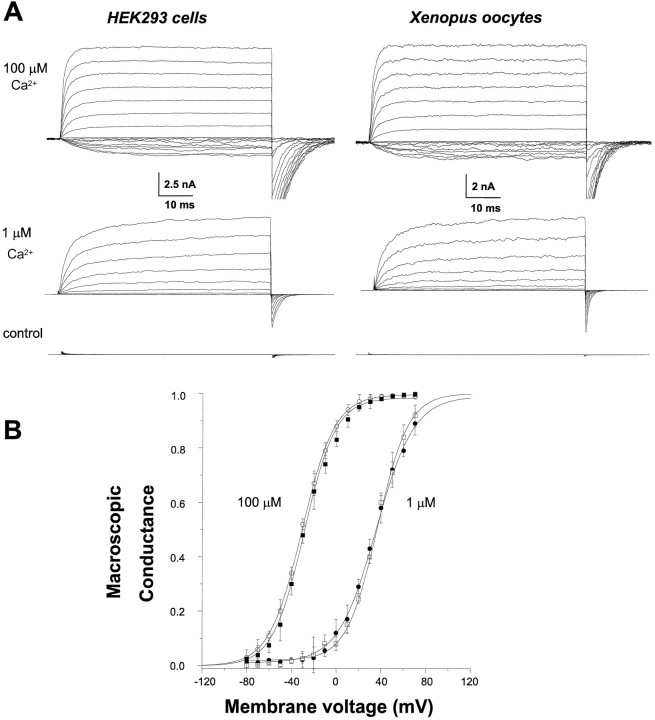
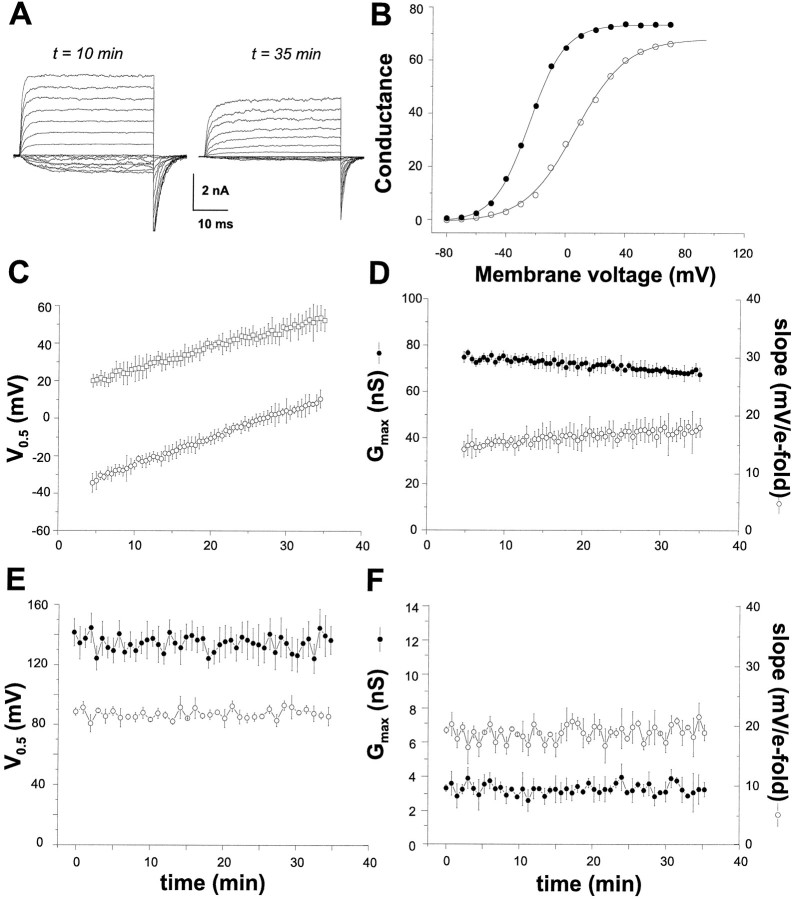
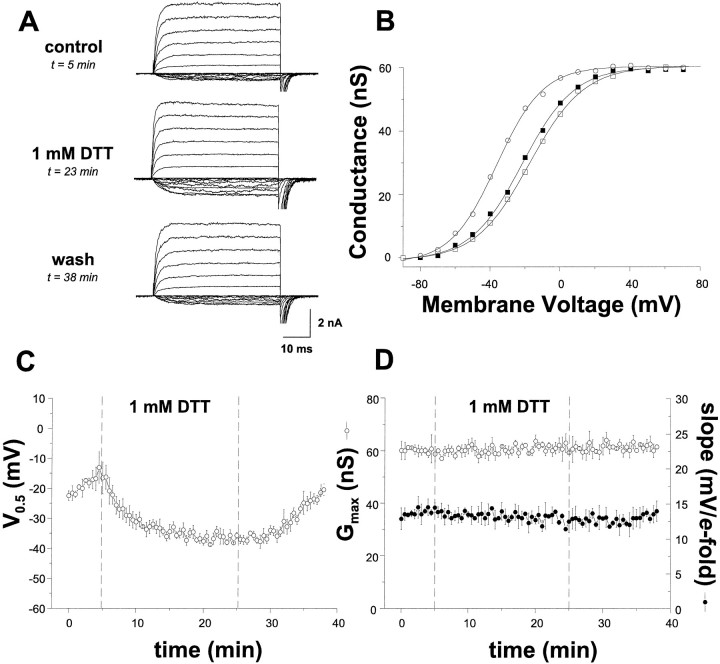
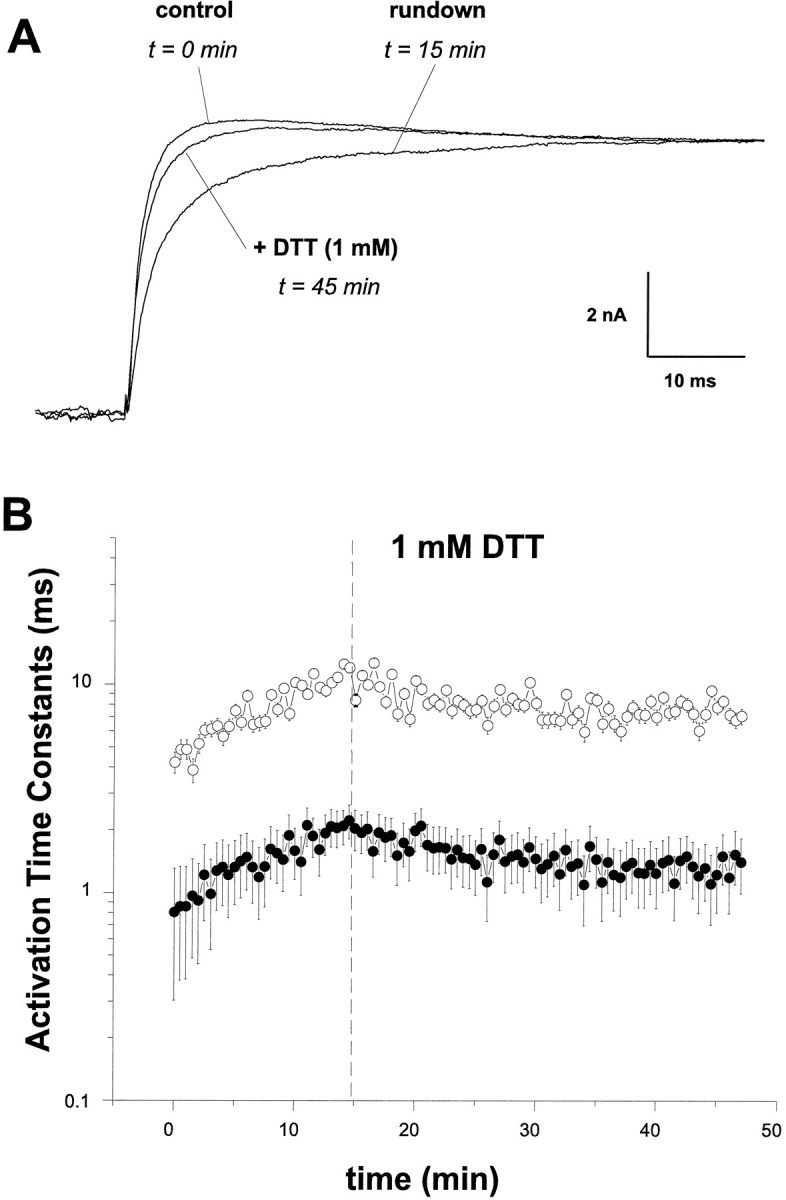
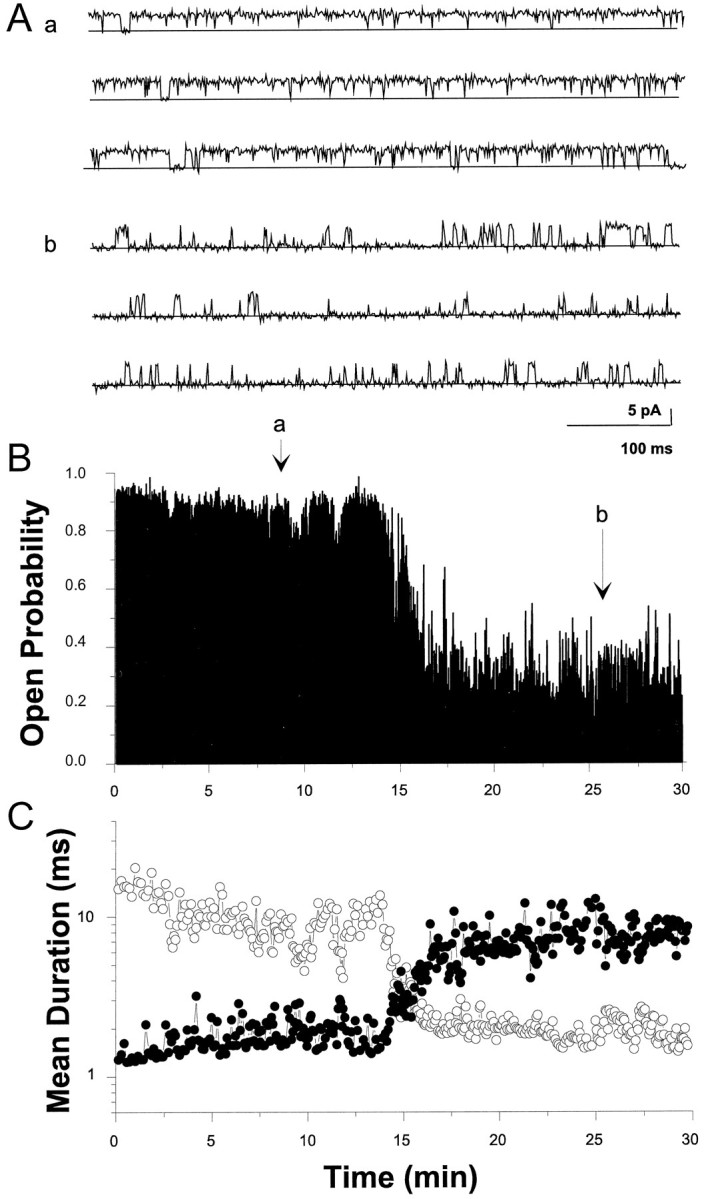
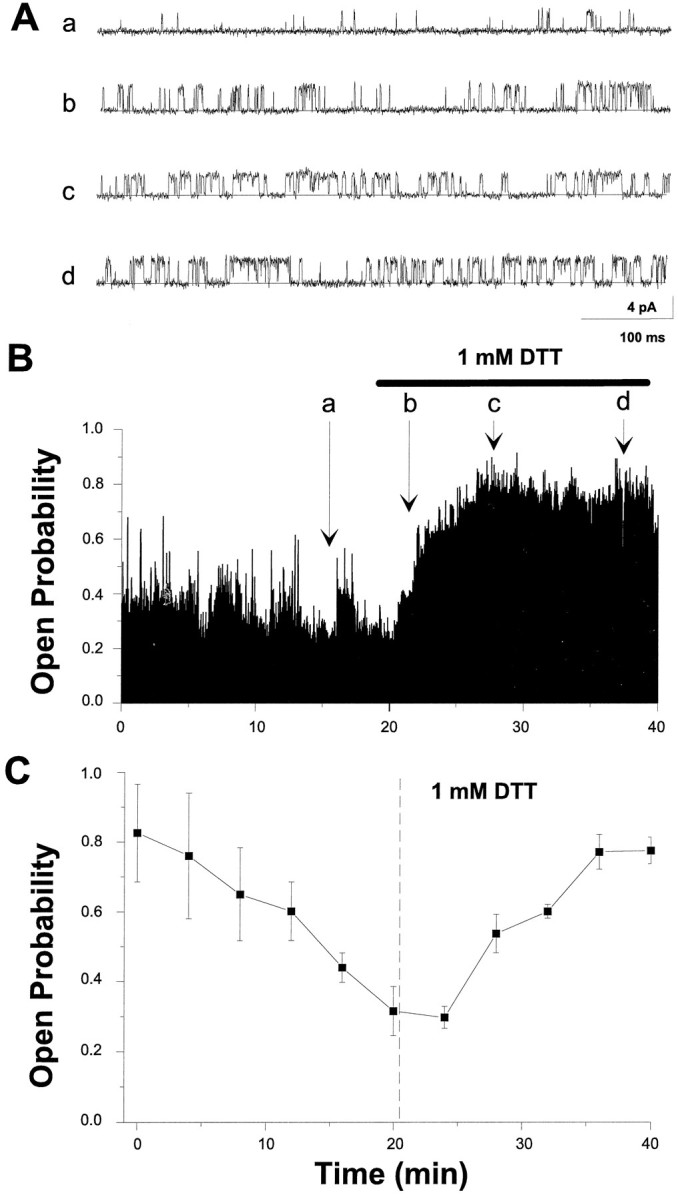
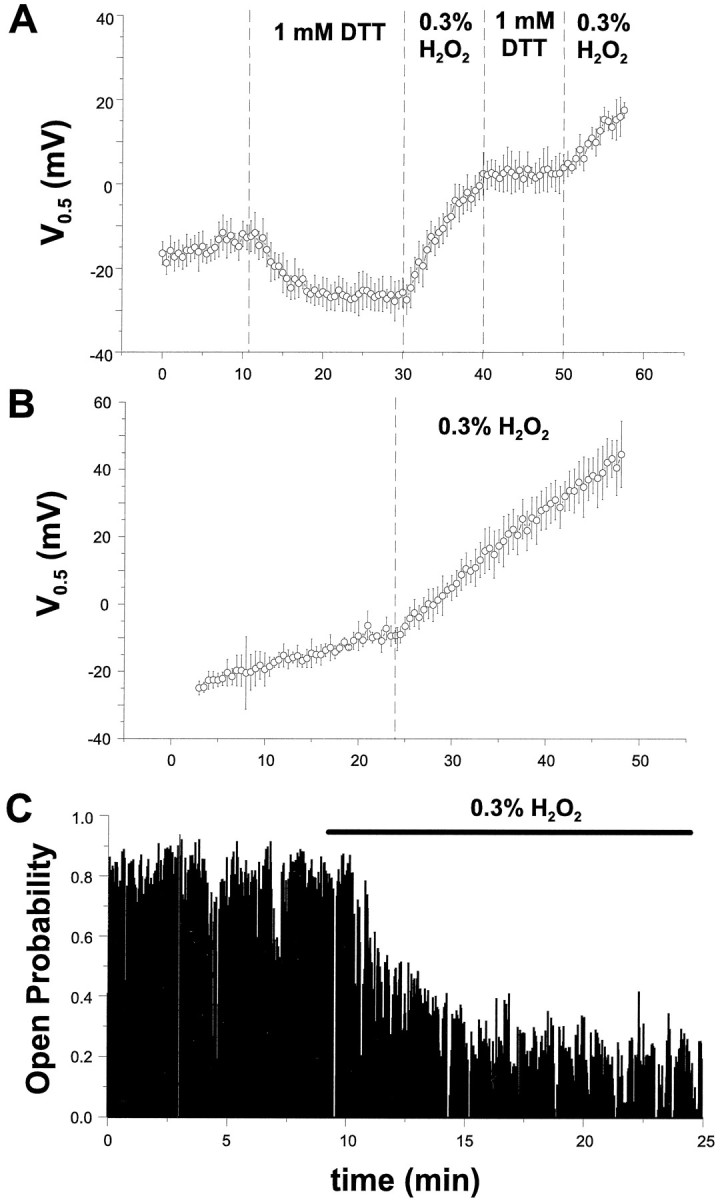
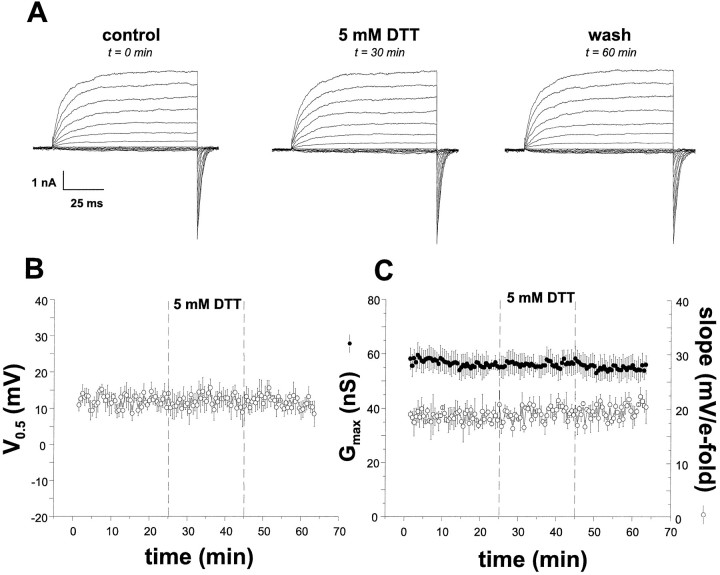
The modulation of ion channel proteins by cellular redox potential has emerged recently as a significant determinant of channel function. We have investigated the influence of sulfhydryl redox reagents on human brain Ca2+-activated K+ channels (hslo) expressed in both human embryonic kidney 293 cells and Xenopus oocytes using macropatch and single-channel analysis. Intracellular application of the reducing agent dithiothreitol (DTT): (1) shifts the voltage of half-maximal channel activation (V0.5) approximately 18 mV to more negative potentials without affecting the maximal conductance or the slope of the voltage dependence; (2) slows by approximately 10-fold a time-dependent right-shift in V0.5 values ("run-down"); (3) speeds macroscopic current activation kinetics by approximately 33%; and (4) increases the single-channel open probability without affecting the unitary conductance. In contrast to DTT treatment, oxidation with hydrogen peroxide shifts macropatch V0.5 values to more positive potentials, increases the rate of channel run-down, and decreases the single-channel open probability. KCa channels cloned from Drosophila differ from hslo channels in that they show very little run-down and are not modulated by the addition of DTT. These data indicate that hslo Ca2+-activated K+ channels may be modulated by changes in the cellular redox potential as well as by the transmembrane voltage and the cytoplasmic Ca2+ concentration.


Figures

Fig. 4.
Fig. 4.
Comparison of hslo-hbr5 channel properties expressed in HEK293 cells and Xenopusoocytes. A, Representative current families from inside-out patches excised from either HEK293 cells (left) or oocytes (right) and evoked by voltage pulses from either −80 to +70 mV (100 μmCa2+ solutions) or −60 to +90 mV (1 μm Ca2+ solutions) in 10 mV increments. Control cells show no significant KCa currents in either expression system. Raw currents were low-pass filtered at 5 kHz, leak-subtracted, compensated for series resistance, and digitized at 10 kHz. B, The mean macroscopic conductance curves corresponding to hslo currents expressed in either HEK293 cells (open symbols) or oocytes (solid symbols) with an intracellular Ca2+ of 1 μm (squares) or 100 μm(circles). The voltages of half-maximal activation (V0.5) of currents expressed in oocytes or HEK293 cells were not significantly different.
Fig. 1.
Fig. 1.
Time-dependent changes in hsloKCa channel properties after patch excision. The hbr5 splice variant of the human brain hslo channel was stably expressed in HEK293 cells. I–V curves (−80 to +70 mV in 10 mV increments from a holding potential of −80 mV with 1 sec between pulses) were recorded from macropatches every 30 sec. Values for voltages of half-maximal activation (V0.5), the slope of the voltage dependence (mV/e-fold change in open probability), and maximal patch conductance (Gmax) were derived from Boltzmann fits to macroscopic conductance (GV) curves calculated from these I–V data. Raw currents were low-pass filtered at 5 kHz, leak-subtracted, compensated for series resistance, and digitized at 10 kHz. Solutions contained symmetrical 150 mmK+-gluconate. A, Inside-out macropatch currents recorded 10 and 35 min after patch excision.B, Plot of macroscopic conductance versus membrane voltage for the currents depicted in A, at 10 min (solid circles) and 35 min (open circles). Lines are optimized fits to the Boltzmann equation. C, The time dependence of shifts inV0.5 values after patch excision into solutions containing either 1 μm Ca2+(open squares) or 100 μmCa2+ (open circles).D, The time dependence of shifts inGmax (solid circles) and the slope of the voltage dependence (open circles) after patch excision. E, V0.5values derived from cell-attached recordings. Steady-state outward currents (open circles) were evoked as described inA, whereas peak tail currents (solid circles) were evoked by a repolarization to −100 mV after voltage pulses from −10 mV to +190 mV from a holding potential of −10 mV. F, Gmax (solid circles) and slope values (open circles) from steady-state currents recorded in cell-attached mode.
Fig. 2.
Fig. 2.
DTT potentiates hslo currents and prevents channel run-down. A, Current–voltage curves (−80 to +70 in 10 mV increments) were recorded from inside-out macropatches excised from HEK293 cells stably transfected withhslo-hbr5. The data shown were obtained before (top), during (middle), and after (bottom) intracellular (bath) application of the reducing agent DTT (1 mm). B, The voltage–activation curves for the currents depicted inA, before (open squares), during (open circles), and after (solid squares) DTT treatment. C, The average time dependence ofV0.5 values from eight cells after patch excision (t = 0), the addition of 1 mmDTT (t = 5 min), and the washout of DTT (t = 25 min). D, The average time dependence of shifts in Gmax (open circles) and the slope of the voltage dependence (solid circles) before, during, and after the application of DTT.
Fig. 3.
Fig. 3.
DTT modulates hslo activation kinetics. Inside-out macropatches were excised fromhslo-HEK293 cells as in Figure 1. Currents elicited by a +40 mV voltage pulse from a holding potential of −80 mV were fit with the sum of two exponentials. A, Representative current records immediately after patch excision (control), 15 min later (run-down), and 30 min after the addition of 1 mm DTT (+ DTT).B, The time constants of activation derived from these fits for the fast (solid circles) and slow (open circles) kinetic components.
Fig. 5.
Fig. 5.
Changes in single hslo channel properties after membrane patch excision. cRNA encodinghslo (10 ng/μl) was injected in Xenopusoocytes, and excised inside-out patches were examined for channel activity 24 hr later. Patches containing single hslochannels were voltage-clamped at +20 mV and assayed in symmetrical 150 mm K+-gluconate solutions containing 100 μm intracellular Ca2+. Currents were filtered at 2 kHz and digitized at 5 kHz. A, Representative single-channel recording ∼8 min (a) and 26 min after excision (b). The closed state of the channel is indicated by the solid line.B, A continuous 30 min recording showing the time course of open probability changes after patch excision. Each vertical data line in the plot represents the averagePo for 50 consecutive transitions.a and b denote times at which single-channel transitions shown in A were recorded.C, The time course of changes in mean dwell times in the open state (open circles) and closed state (solid circles) for the same channel depicted in A andB. Each data point represents the average dwell time for 200 consecutive gating events.
Fig. 6.
Fig. 6.
DTT increases the open probability of singlehslo channels. A, Raw current traces from a single hslo channel expressed inXenopus oocytes, voltage-clamped at +20 mV, and bathed in symmetrical 150 mm K+-gluconate solutions containing 100 μm free Ca2+. Currents were filtered at 2 kHz and digitized at 10 kHz. The closed state of the channel is depicted by solid lines.B, The time course of open probability changes after the application of 1 mm DTT (horizontal line). The letters denote times at which single-channel transitions shown in A were recorded. Eachvertical data line in the plot represents the averagePo for 50 consecutive transitions.C, The average open probability after patch excision and the addition of 1 mm DTT (t = 21 min;dashed vertical line) for five experiments.
Fig. 7.
Fig. 7.
The effect of hydrogen peroxide (H2O2) on hslo currents.A, H2O2 (0.3%) was applied to the intracellular surface of inside-out patches expressinghslo currents excised from HEK293 cells. Membrane patches were preincubated with 1 mm DTT for 20 min in the presence of 100 μm Ca2+, followed by bath perfusion of H2O2 for 10 min. The observed shift of V0.5 values induced by reducing and oxidizing agents could be repeated several times in the same patch.B, Oxidation of hslo currents with hydrogen peroxide increases the rate of run-down after patch excision.C, Time dependence of changes in the single-channel open probability after the application of H2O2(dashed vertical line). Hslo channels were expressed in Xenopus oocytes as described in Figure5 and held at +20 mV during the experiment. Each vertical data line in the plot represents the averagePo for 50 consecutive transitions.
Fig. 8.
Fig. 8.
dslo KCa channels are not modulated by redox reagents. Currents were elicited from a HEK293 cell line stably expressing Drosophila dslo channels (splice variant A1/C2/E1/G3/I0) (Adelman et al., 1992) as described in Figure 1.A, Current families evoked by command voltage steps ranging from −80 mV to +70 mV from a holding potential of −80 mV.B, The time dependence of dslo V0.5 changes after patch excision, the addition of 5 mm DTT (t = 25 min), and the washout of this agent (t = 45 min). C, The time dependence of macroscopic conductance values (solid circles) and the slope of the voltage dependence (open circles) after excision and DTT treatment.

Similar articles

Cited by

References

    1. Adelman J, Shen KZ, Kavanaugh MP, Warren RA, Wu YN, Lagrutta A, Bond CT, North RA. Calcium-activated potassium channels expressed from cloned complimentary DNAs. Neuron. 1992;9:209–216. - PubMed
    1. Aizenman E, Lipton SA, Loring RH. Selective modulation of NMDA responses by reduction and oxidation. Neuron. 1989;2:1257–1263. - PubMed
    1. Atkinson NS, Robertson GA, Ganetzky B. A component of calcium-activated potassium channels encoded by the Drosophila slo locus. Science. 1991;253:551–555. - PubMed
    1. Bielefeldt K, Jackson MB. A calcium-activated potassium channel causes frequency-dependent action potential failures in a mammalian nerve terminal. J Neurophysiol. 1993;458:41–67. - PubMed
    1. Bolotina VM, Najibi S, Palacino JJ, Pagano PJ, Cohen RA. Nitric oxide directly activated calcium-dependent potassium channels in vascular smooth muscle. Nature. 1994;368:850–853. - PubMed

Publication types

MeSH terms

LinkOut - more resources