. 1997 Jul 1;17(13):4976-86.
doi: 10.1523/JNEUROSCI.17-13-04976.1997.

Site-specific and sensory neuron-dependent increases in postsynaptic glutamate sensitivity accompany serotonin-induced long-term facilitation at Aplysia sensorimotor synapses

Affiliations

Site-specific and sensory neuron-dependent increases in postsynaptic glutamate sensitivity accompany serotonin-induced long-term facilitation at Aplysia sensorimotor synapses

H Zhu et al. J Neurosci. .

Abstract

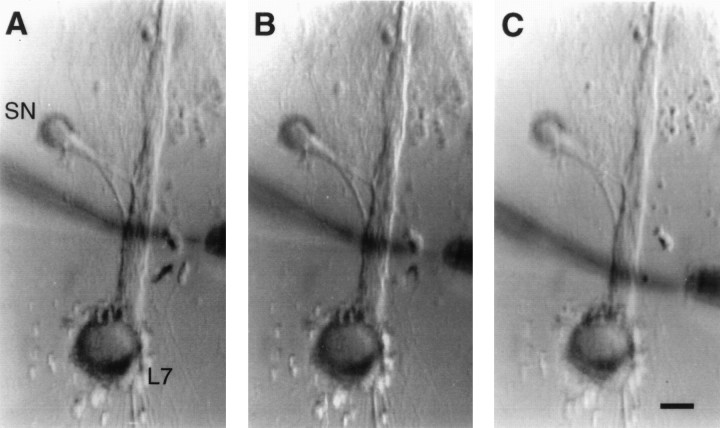
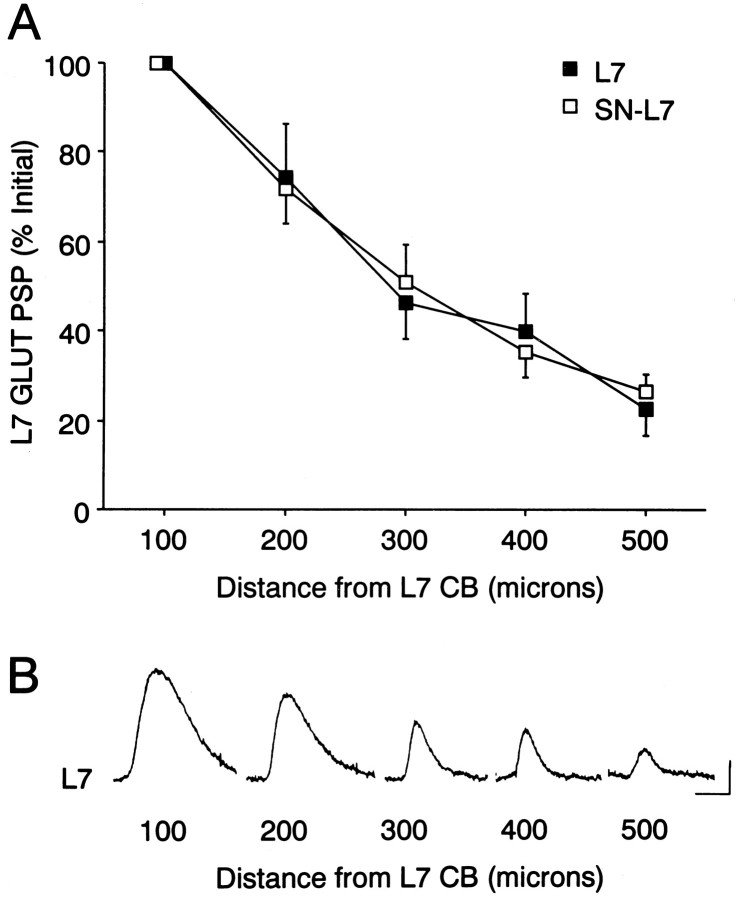
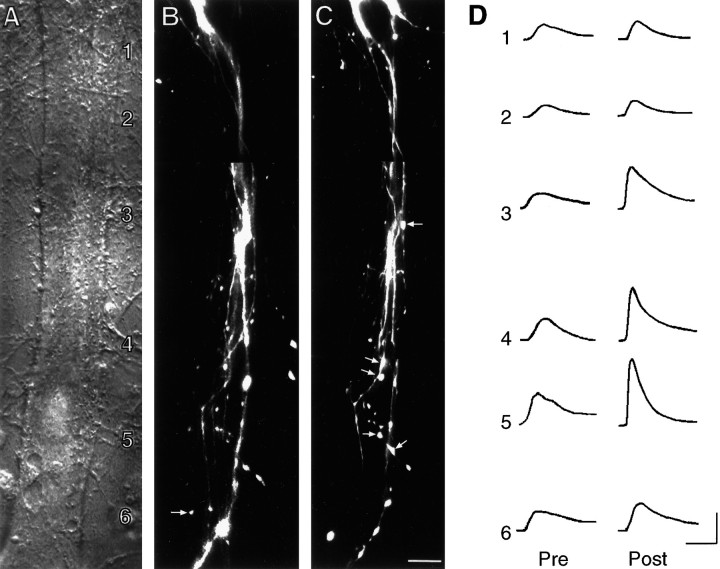
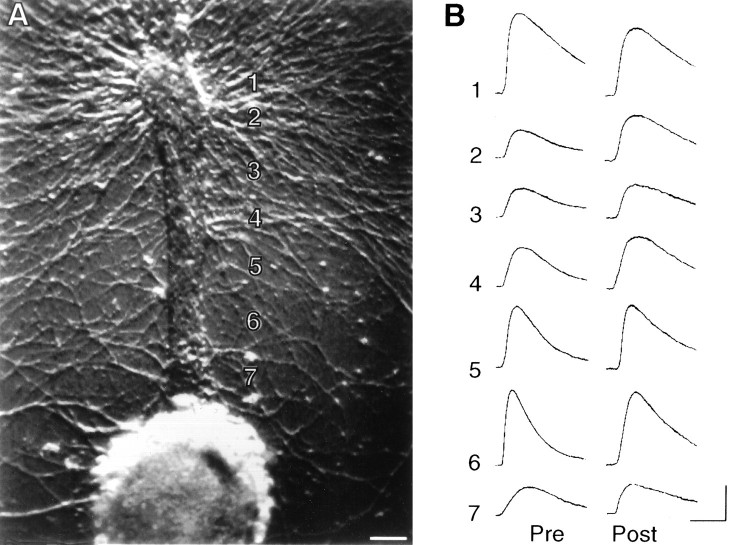
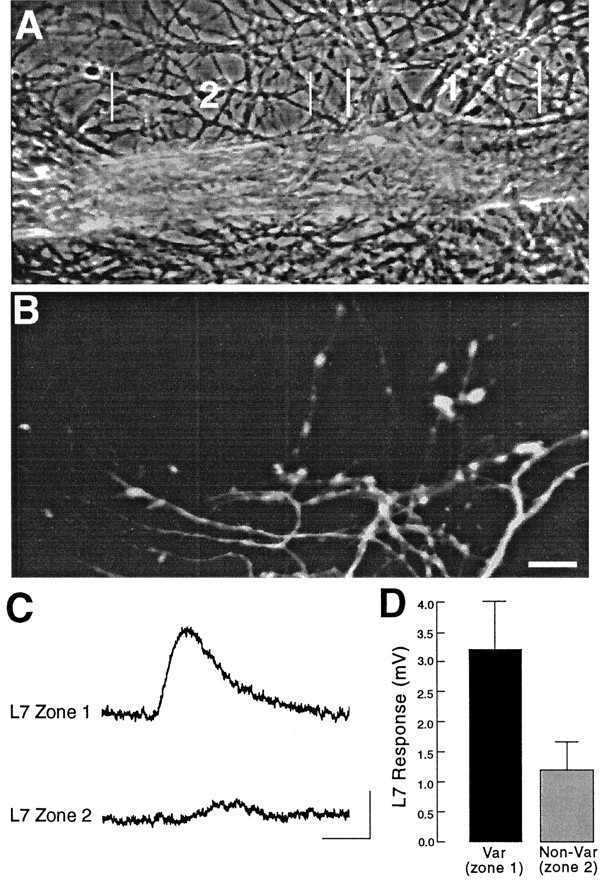
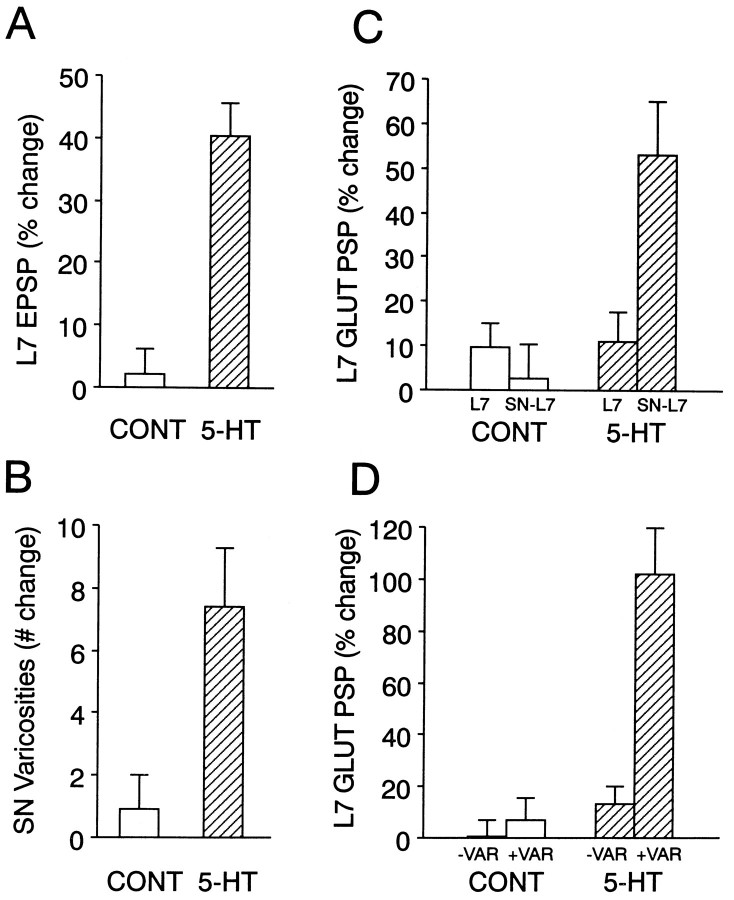
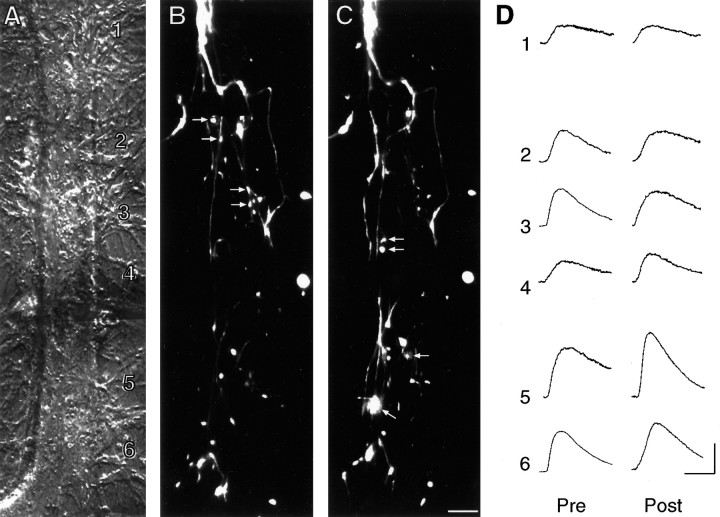
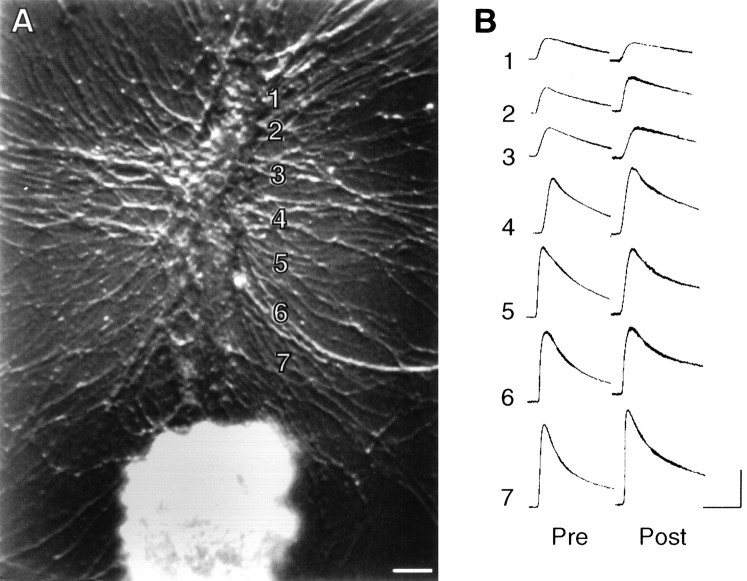
Long-term changes in the efficacy of Aplysia sensory neuron (SN) connections accompany behavioral training or applications with 5-HT. The changes evoked by training or 5-HT include formation of new SN varicosities and transmitter release sites. Because new synapse formation requires proper alignment of presynaptic structures with postsynaptic zones containing a high density of transmitter receptors, we examined whether changes in postsynaptic sensitivity to the presumed SN transmitter (glutamate) were correlated with formation and distribution of new SN varicosities in contact with motor cell L7 in cell culture. The formation of stable SN connections after 4 d in culture did not significantly change overall responses to focal applications of glutamate. However, specific sites along L7's axon apposed to SN varicosities expressed larger responses to glutamate compared with adjacent sites with few SN varicosities. After treatments with 5-HT that evoked long-term changes in both the structure and the function of SN-L7 synaptic interaction, glutamate responses increased selectively at sites along the surface of L7's axon with preexisting or new SN varicosities. Increases in postsynaptic response to glutamate 24 hr after 5-HT treatment required interaction with an SN. These results suggest that new synapse formation between neurons, either with regeneration or after external stimuli that evoke increases in synaptic efficacy, involves site-specific changes in expression of functional neurotransmitter receptors on the postsynaptic cell that is regulated by interaction with the presynaptic neuron.


Figures

Fig. 1.
Fig. 1.
Focal applications of glutamate to adjacent nonoverlapping regions along the axon of L7. Low-power Nomarski contrast images of an SN–L7 culture after 4 d. The axon of L7 emerges from the cell body and extends toward the top of each micrograph. The axon of the SN (left of motor axon) emerges from the cell body and extends toward the motor axon. The location of regenerated SN neurites and varicosities contacting L7’s axon is determined with epifluorescent microscopy after intracellular dye injections (see Figs. 3, 4, 5). Micropipettes for pressure ejection (positioned at left of motor axon) and rapid suction (right of motor axon) of glutamate are placed opposite a given region at three locations along L7’s axon (distal locations inA and B and most proximal location inC). The width of the glutamate stream is controlled by the placement of the electrodes and the strength of the vacuum. In these examples, the stream width is ∼10 μm. Scale bar, 40 μm.
Fig. 2.
Fig. 2.
Glutamate response declines at more distal zones along the L7 axon, irrespective of interaction with an SN.A, Maximal response to glutamate is obtained with applications at 100 μm from the L7 cell body (normalized as 100% for each L7; n = 7 for each condition). A 40-μm-wide stream of 250 μm glutamate centered at the indicated distance along the axon was used to evoke each response for each type of culture. The same set of micropipettes (one to eject glutamate and the other to rapidly remove transmitter) was used to record responses from both L7s in each culture dish. Note that the average response declines by ∼50% at 300 μm from the L7 cell body. A two-factor ANOVA indicated that although there was a significant decline in response with distance from the L7 cell body (p < 0.001), there was no difference in the responses between L7 cultured alone and SN–L7 co-cultures (df = 4,48; F = 0.385; p > 0.8).B, Example of a series of responses to glutamate applied to the locations indicated from the L7 cell body for a motor cell cultured alone. Calibration: vertical, 2 mV; horizontal, 200 msec.
Fig. 4.
Fig. 4.
Long-term facilitation of SN–L7 synapses with 5-HT is accompanied by an increase in glutamate response at zones with preexisting and new SN varicosities. A, Nomarski contrast image of proximal 300–350 μm portion of L7’s axon. L7 cell body is just out of view at bottom. The numbers indicate the location of the sites of glutamate applications (1000 μm with 10- to 15-μm-wide stream lasting 100 msec) both before and after treatment. The fine neurites of L7 extending adjacent to the axon are unchanged over the 24 hr period and were used to relocate the zones for the second recording. Scale bar, 15 μm. B, C, Epifluorescent view of all SN neurites and varicosities (superimposition of three focal planes) in the same area as in A interacting with L7 axons before (B) and 24 hr after (C) treatment with 5-HT. EPSP amplitude increased from 18 mV on day 4 to 30 mV on day 5. The arrows in B point to varicosities that are no longer present on day 5. Thearrows in C point to some of the new varicosities. Overall, there was a net change of 10 varicosities.D, Response to glutamate in each zone (zones1–6) before (Pre) and 24 hr after (Post) treatment with 5-HT. Note that the largest increases in glutamate response are in zones with preexisting or new SN varicosities (zones 3–5). Although the rate of rise for the individual responses in this preparation before treatment was somewhat slower than average, there were no overall differences between the control and 5-HT groups before treatment (see Results). The responses for the control cell illustrated in Figure 5 were obtained on the same day as those illustrated here with the same set of pipettes at each time point. Another zone distal to this region was not included. No change in response was observed in the most distal site along the L7 axon that had no SN varicosities. Calibration: vertical, 5 mV; horizontal, 200 msec.
Fig. 6.
Fig. 6.
Long-term change in glutamate response with 5-HT is not expressed in the absence of an SN. A, Nomarski contrast view of L7 cell body and proximal axon. Thenumbers indicate the zones of glutamate application (1000 μm with 10- to 15-μm-wide stream for 100 msec). Scale bar, 30 μm. B, Responses to glutamate applied to each zone before (Pre) and 24 hr after (Post) treatment with 5-HT. Note that application of glutamate on zone 1, the axon stump, evoked a larger response than on the neighboring zone. In addition, glutamate responses in zones ∼50 μm of the L7 cell body were typically smaller than those at ∼100 μm (zone 7, for example). On average, each application of glutamate evoked a 6.8 ± 0.9 mV response per L7 on day 4 before treatment. Calibration: vertical, 5 mV; horizontal, 200 msec.
Fig. 3.
Fig. 3.
Local glutamate response is enhanced by the presence of SN varicosities. A, Phase-contrast micrograph of portion of L7 axon 250–400 μm from the L7 cell body (located to the left of this region). Zone2 is closer to the L7 cell body. B, Epifluorescent view of SN neurites and varicosities in the same region as in A. Note that the more distal zone 1has more SN varicosities in contact with L7’s axon (10 varicosities) than SN varicosities in contact with the more proximal portion of the axon in zone 2 (two varicosities). Scale bar, 15 μm.C, Response to glutamate (250 μm for 100 msec) applied to zones 1 and 2, respectively. Calibration: vertical, 2 mV; horizontal, 200 msec.D, Summary of the differential responses evoked by glutamate to adjacent zones along L7’s axon, where one zone has from 2.5- to 5-fold more SN varicosities. On average (n= 7 cultures), there is a 2.7-fold difference in glutamate response (t = 4.126; p < 0.006).
Fig. 8.
Fig. 8.
Summary of the long-term changes evoked by 5-HT in the presence and absence of SNs. A, Long-term increase in synaptic efficacy evoked by 5-HT in SN–L7 cocultures. The height of each bar is the mean + SEM change in the amplitude of the EPSP evoked in L7 24 hr after treatment. There was no significant difference (p > 0.4) in the average amplitude of the initial EPSP for each group (21.4 ± 2.7 mV for controls and 23.8 ± 3.8 mV for 5-HT). 5-HT evoked a significant change compared with control (t = 5.681;p < 0.001). B, Change in the number of SN varicosities contacting L7’s axon 24 hr after treatment. There was no significant difference between the two groups in the number of SN varicosities in contact with the proximal segment of L7’s axon (25.9 ± 5.8 varicosities for controls and 23.5 ± 4.7 varicosities for 5-HT). 5-HT evoked a significant change compared with control (t = 4.509; p < 0.001).C, Glutamate responses are enhanced by 5-HT in SN–L7 cultures, but not in L7 alone cultures. The height of eachbar is the mean + SEM percent change in the response to glutamate per culture (n = 10 for each condition). The change in each culture was calculated as the average change in response for all zones (seven zones per culture). A two-factor ANOVA (treatment and presence of an SN) indicated an overall significant change in glutamate response (df = 1,18; F = 8.578; p < 0.01). The only significant change was obtained when 5-HT was applied to the cocultures. The change in this group was significant compared with 5-HT applied to L7 alone (F = 4.248; p < 0.01), control treatment of the cocultures (F = 6.117;p < 0.01), and control treatment to L7 alone (F = 4.557; p < 0.01).D, Glutamate responses are enhanced by 5-HT primarily at sites with SN varicosities. The height of each bar is the mean + SEM percent change in glutamate response per SN–L7 culture at sites with (+VAR indicates zones with three or more varicosities) or without (−VAR indicates zones with two or fewer varicosities) SN varicosities. A two-factor ANOVA (treatment and presence of SN varicosities) indicated an overall significant change in glutamate response (df = 1,18; F = 31.815; p < 0.001). The only significant change was obtained at sites with SN varicosities after treatment with 5-HT. The change at SN varicosities after 5-HT treatment was significant compared with the change at sites without varicosities after 5-HT (F = 10.609; p < 0.01), at sites with varicosities after control treatment (F= 12.163; p < 0.01), and at sites without varicosities after control treatment (F = 13.931;p < 0.01).
Fig. 5.
Fig. 5.
SN structure and glutamate responses before and after control treatment. A, Nomarski contrast view of proximal 300–350 μm portion of L7’s axon. L7 cell body is just out of view at bottom. The numbers indicate the zones of glutamate applications (1000 μm with 10- to 15-μm-wide streams lasting 100 msec) both before and after treatment. A more distal zone is not shown. Scale bar, 15 μm. B,C, Epifluorescent view of SN neurites and varicosities (superimposition of up to three focal planes) in the same area as inA interacting with L7 axon before (B) and 24 hr after (C) control treatment. EPSP amplitude changed from 20 mV on day 4 to 22 mV on day 5. The arrows in B point to some of the varicosities that are no longer present on day 5. Thearrows in C point to some of the new varicosities. There was an overall net change of two SN varicosities contacting this portion of the L7 axon. D, Response to glutamate in each zone (zones 1–6) before (Pre) and 24 hr after (Post) control treatment. Note little significant change in the amplitude or rate of rise of the responses to glutamate. Calibration: vertical, 5 mV; horizontal, 200 msec.
Fig. 7.
Fig. 7.
Glutamate responses in L7 cultured alone are unchanged 24 hr after control treatment. A, Nomarski contrast view of L7 cell body and proximal axon. Thenumbers indicate the zones of glutamate application (see Fig. 6). Scale bar, 30 μm. B, Responses to glutamate applied to each zone before (Pre) and 24 hr after (Post) control treatment. The overall response for each zone changed little. On average, each application of glutamate evoked a 6.6 ± 1.1 mV response per L7 on day 4 before treatment. Calibration: vertical, 5 mV; horizontal, 200 msec.

Similar articles

Cited by

References

    1. Atashi JR, Klinz SG, Ingraham CA, Matten WT, Schachner M, Maness PF. Neural cell adhesion molecules modulate tyrosine phosphorylation of tubulin in nerve growth cone membranes. Neuron. 1992;8:831–842. - PubMed
    1. Bailey CH, Chen M. Morphological basis of long-term habituation and sensitization in Aplysia. Science. 1983;220:91–93. - PubMed
    1. Bailey CH, Chen M. Long-term memory in Aplysia modulates the total number of varicosities of single identified neurons. Proc Natl Acad Sci USA. 1988a;85:2372–2377. - PMC - PubMed
    1. Bailey CH, Chen M. Long-term sensitization in Aplysia increases the number of presynaptic contacts onto the identified gill motor neuron L7. Proc Natl Acad Sci USA. 1988b;85:9356–9359. - PMC - PubMed
    1. Bailey CH, Kander ER. Structural changes accompany memory storage. Annu Rev Physiol. 1993;55:397–426. - PubMed

Publication types

LinkOut - more resources