

Estimation of mean exocytic vesicle capacitance in mouse adrenal chromaffin cells
- PMID: 9192634
- PMCID: PMC21227
- DOI: 10.1073/pnas.94.13.6735
Estimation of mean exocytic vesicle capacitance in mouse adrenal chromaffin cells
Abstract
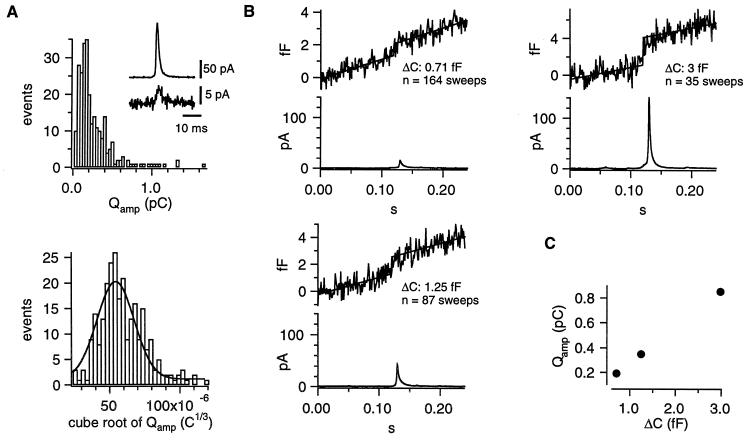
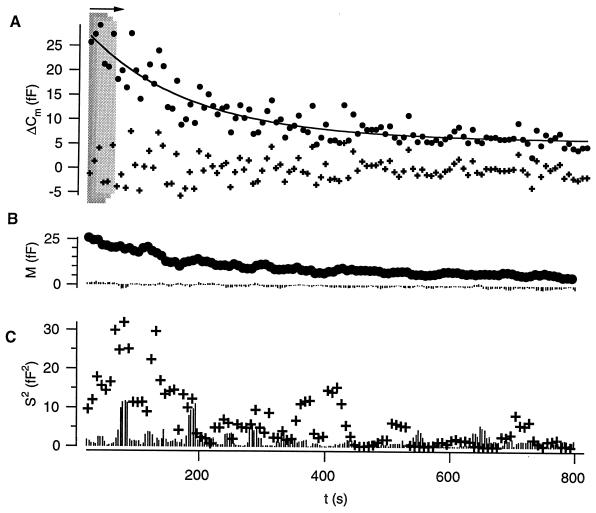
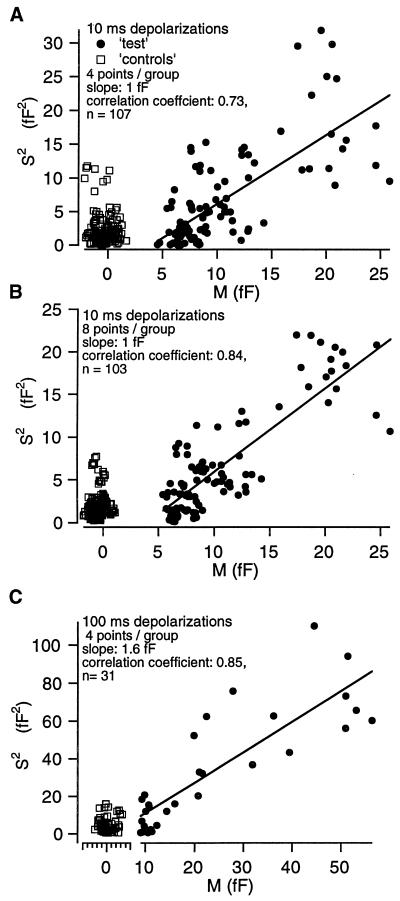
Whole-cell membrane capacitance measurements are frequently used to monitor neuronal and nonneuronal secretory activity. However, unless individual fusion events can be resolved, the type of the fusing vesicles cannot be identified in these experiments. Here we apply statistical analysis of trial-to-trial variations between depolarization-induced capacitance increases of mouse adrenal chromaffin cells and obtain estimates for the capacitance contribution of individual exocytic vesicles between 0.6 and 2 fF. For comparison, measurements of membrane capacitance were combined with amperometric recordings of catecholamine release during intracellular perfusion of chromaffin cells with high [Ca2+]. Crosscorrelation of both signals yielded a mean capacitance contribution of individual catecholaminergic vesicles of 1.3 fF. We suggest that depolarization-induced capacitance increases in mouse adrenal chromaffin cells mainly represent fusion of chromaffin granules.
Figures

Similar articles
-
Methods for cell-attached capacitance measurements in mouse adrenal chromaffin cell.J Vis Exp. 2014 Oct 22;(92):e52024. doi: 10.3791/52024. J Vis Exp. 2014. PMID: 25408421 Free PMC article.
-
Simultaneous capacitance and amperometric measurements of exocytosis: a comparison.Biophys J. 1996 Aug;71(2):1131-9. doi: 10.1016/S0006-3495(96)79315-3. Biophys J. 1996. PMID: 8842250 Free PMC article.
-
Compensatory and excess retrieval: two types of endocytosis following single step depolarizations in bovine adrenal chromaffin cells.J Physiol. 1998 Feb 1;506 ( Pt 3)(Pt 3):591-608. doi: 10.1111/j.1469-7793.1998.591bv.x. J Physiol. 1998. PMID: 9503324 Free PMC article.
-
Calcium signaling and exocytosis in adrenal chromaffin cells.Physiol Rev. 2006 Oct;86(4):1093-131. doi: 10.1152/physrev.00039.2005. Physiol Rev. 2006. PMID: 17015485 Review.
-
Dynamin and myosin regulate differential exocytosis from mouse adrenal chromaffin cells.Cell Mol Neurobiol. 2010 Nov;30(8):1351-7. doi: 10.1007/s10571-010-9591-z. Cell Mol Neurobiol. 2010. PMID: 21061163 Free PMC article. Review.
Cited by
-
Basal and Stress-Induced Network Activity in the Adrenal Medulla In Vivo.Front Endocrinol (Lausanne). 2022 Jun 20;13:875865. doi: 10.3389/fendo.2022.875865. eCollection 2022. Front Endocrinol (Lausanne). 2022. PMID: 35795145 Free PMC article.
-
The noise of membrane capacitance measurements in the whole-cell recording configuration.Biophys J. 2000 Oct;79(4):2162-70. doi: 10.1016/S0006-3495(00)76464-2. Biophys J. 2000. PMID: 11023920 Free PMC article.
-
Complexin synchronizes primed vesicle exocytosis and regulates fusion pore dynamics.J Cell Biol. 2014 Mar 31;204(7):1123-40. doi: 10.1083/jcb.201311085. J Cell Biol. 2014. PMID: 24687280 Free PMC article.
-
Regulated exocytosis of GABA-containing synaptic-like microvesicles in pancreatic beta-cells.J Gen Physiol. 2004 Mar;123(3):191-204. doi: 10.1085/jgp.200308966. Epub 2004 Feb 9. J Gen Physiol. 2004. PMID: 14769845 Free PMC article.
-
Modeling study of exocytosis in neuroendocrine cells: influence of the geometrical parameters.Biophys J. 2000 Oct;79(4):1771-86. doi: 10.1016/S0006-3495(00)76429-0. Biophys J. 2000. PMID: 11023885 Free PMC article.
References
Publication types
MeSH terms
Substances
LinkOut - more resources
Full Text Sources
Miscellaneous
