

Likelihood-mapping: a simple method to visualize phylogenetic content of a sequence alignment
- PMID: 9192648
- PMCID: PMC21241
- DOI: 10.1073/pnas.94.13.6815
Likelihood-mapping: a simple method to visualize phylogenetic content of a sequence alignment
Abstract
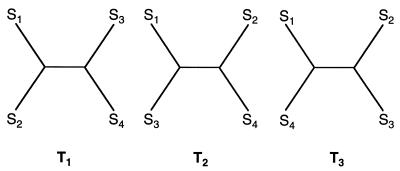
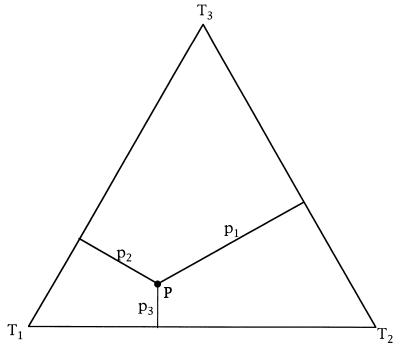
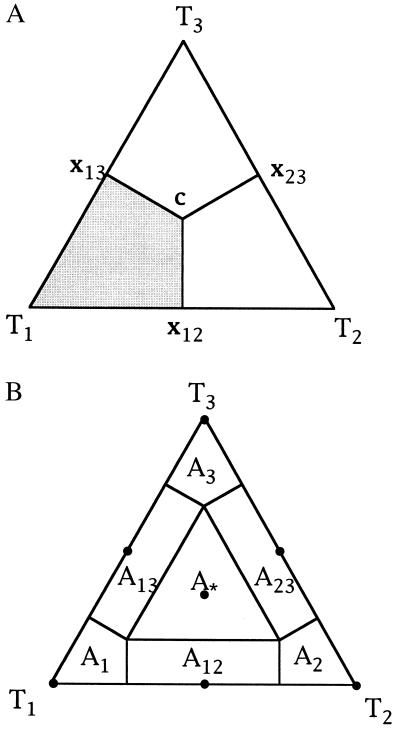
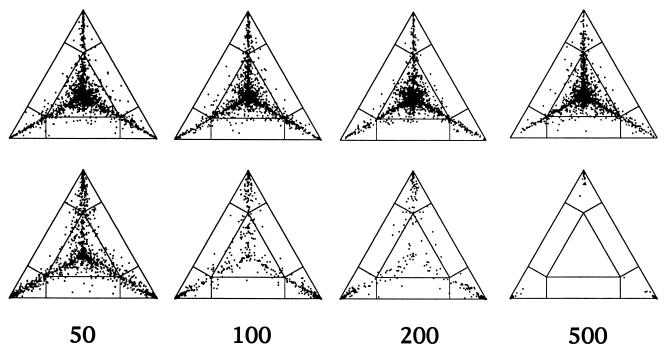
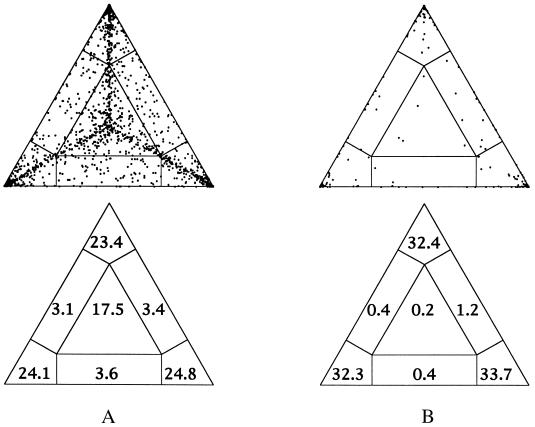
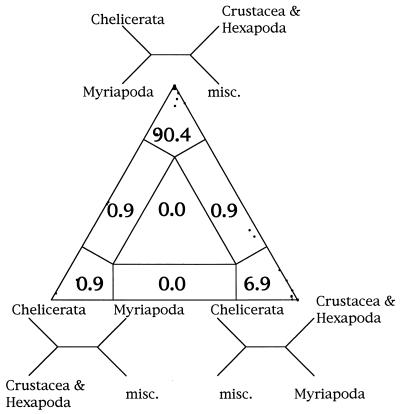
We introduce a graphical method, likelihood-mapping, to visualize the phylogenetic content of a set of aligned sequences. The method is based on an analysis of the maximum likelihoods for the three fully resolved tree topologies that can be computed for four sequences. The three likelihoods are represented as one point inside an equilateral triangle. The triangle is partitioned in different regions. One region represents star-like evolution, three regions represent a well-resolved phylogeny, and three regions reflect the situation where it is difficult to distinguish between two of the three trees. The location of the likelihoods in the triangle defines the mode of sequence evolution. If n sequences are analyzed, then the likelihoods for each subset of four sequences are mapped onto the triangle. The resulting distribution of points shows whether the data are suitable for a phylogenetic reconstruction or not.
Figures
References
-
- Swofford D L, Olsen G J, Waddell P J, Hillis D M. In: Molecular Systematics. Hillis D M, Moritz C, Mable B K, editors. Sunderland, MA: Sinauer; 1995. pp. 407–514.
-
- Bandelt H-J, Dress A. Adv Math. 1992;92:47–105.
-
- von Haeseler A, Churchill G A. J Mol Evol. 1993;37:77–85. - PubMed
Publication types
MeSH terms
LinkOut - more resources
Full Text Sources
Other Literature Sources
