

Dwarfism and age-associated spinal degeneration of heterozygote cmd mice defective in aggrecan
- PMID: 9192671
- PMCID: PMC21264
- DOI: 10.1073/pnas.94.13.6943
Dwarfism and age-associated spinal degeneration of heterozygote cmd mice defective in aggrecan
Abstract
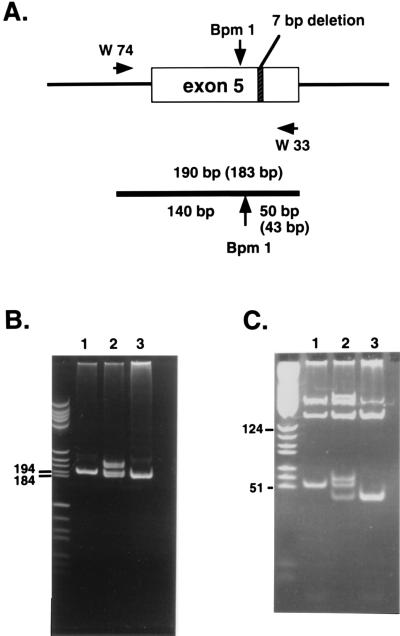
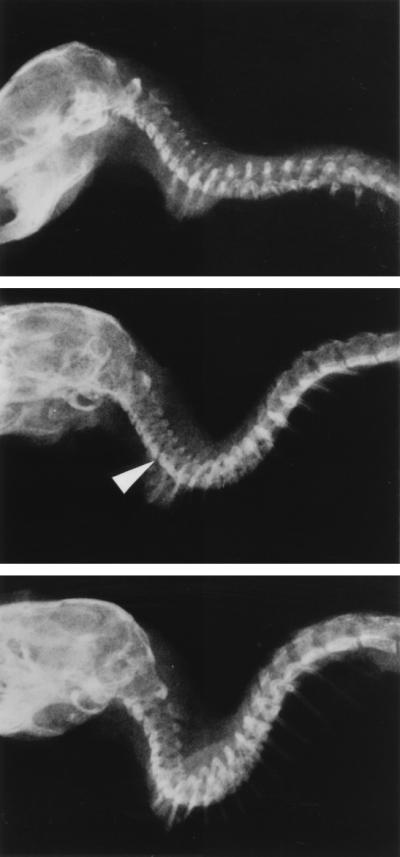
Mouse cartilage matrix deficiency (cmd) is an autosomal recessive disorder caused by a genetic defect of aggrecan, a large chondroitin sulfate proteoglycan in cartilage. The homozygotes (-/-) are characterized by cleft palate and short limbs, tail, and snout. They die just after birth because of respiratory failure, and the heterozygotes (+/-) appear normal at birth. Here we report that the heterozygotes show dwarfism and develop spinal misalignment with age. Within 19 months of age, they exhibit spastic gait caused by misalignment of the cervical spine and die because of starvation. Histological examination revealed a high incidence of herniation and degeneration of vertebral discs. Electron microscopy showed a degeneration of disc chondrocytes in the heterozygotes. These findings may facilitate the identification of mutations in humans predisposed to spinal degeneration.
Figures


Similar articles
-
Chondrodysplasia of gene knockout mice for aggrecan and link protein.Glycoconj J. 2002 May-Jun;19(4-5):269-73. doi: 10.1023/A:1025344332099. Glycoconj J. 2002. PMID: 12975605 Review.
-
Mouse cartilage matrix deficiency (cmd) caused by a 7 bp deletion in the aggrecan gene.Nat Genet. 1994 Jun;7(2):154-7. doi: 10.1038/ng0694-154. Nat Genet. 1994. PMID: 7920633
-
Roles of aggrecan, a large chondroitin sulfate proteoglycan, in cartilage structure and function.J Biochem. 1998 Oct;124(4):687-93. doi: 10.1093/oxfordjournals.jbchem.a022166. J Biochem. 1998. PMID: 9756610 Review.
-
Disrupted expression of matrix genes in the growth plate of the mouse cartilage matrix deficiency (cmd) mutant.Dev Genet. 1998;22(4):349-58. doi: 10.1002/(SICI)1520-6408(1998)22:4<349::AID-DVG5>3.0.CO;2-6. Dev Genet. 1998. PMID: 9664687
-
Disproportionate micromelia (Dmm): an incomplete dominant mouse dwarfism with abnormal cartilage matrix.J Embryol Exp Morphol. 1981 Apr;62:165-82. J Embryol Exp Morphol. 1981. PMID: 7276808
Cited by
-
Proteoglycans in brain development.Glycoconj J. 2004;21(6):329-41. doi: 10.1023/B:GLYC.0000046278.34016.36. Glycoconj J. 2004. PMID: 15514481 Review.
-
Protective Properties of Neural Extracellular Matrix.Mol Neurobiol. 2016 Jan;53(1):73-82. doi: 10.1007/s12035-014-8990-4. Epub 2014 Nov 18. Mol Neurobiol. 2016. PMID: 25404091 Review.
-
Chondrodysplasia of gene knockout mice for aggrecan and link protein.Glycoconj J. 2002 May-Jun;19(4-5):269-73. doi: 10.1023/A:1025344332099. Glycoconj J. 2002. PMID: 12975605 Review.
-
A Novel Rat Tail Needle Minimally Invasive Puncture Model Using Three-Dimensional Printing for Disk Degeneration and Progressive Osteogenesis Research.Front Cell Dev Biol. 2021 Jun 3;9:587399. doi: 10.3389/fcell.2021.587399. eCollection 2021. Front Cell Dev Biol. 2021. PMID: 34150742 Free PMC article.
-
A developmental transcriptomic analysis of Pax1 and Pax9 in embryonic intervertebral disc development.Biol Open. 2017 Feb 15;6(2):187-199. doi: 10.1242/bio.023218. Biol Open. 2017. PMID: 28011632 Free PMC article.
References
Publication types
MeSH terms
Substances
LinkOut - more resources
Full Text Sources
Medical
Molecular Biology Databases
