. 1997 Jun 30;137(7):1459-68.
doi: 10.1083/jcb.137.7.1459.

Chromatin dynamics in interphase nuclei and its implications for nuclear structure

Affiliations

Chromatin dynamics in interphase nuclei and its implications for nuclear structure

J R Abney et al. J Cell Biol. .

Abstract

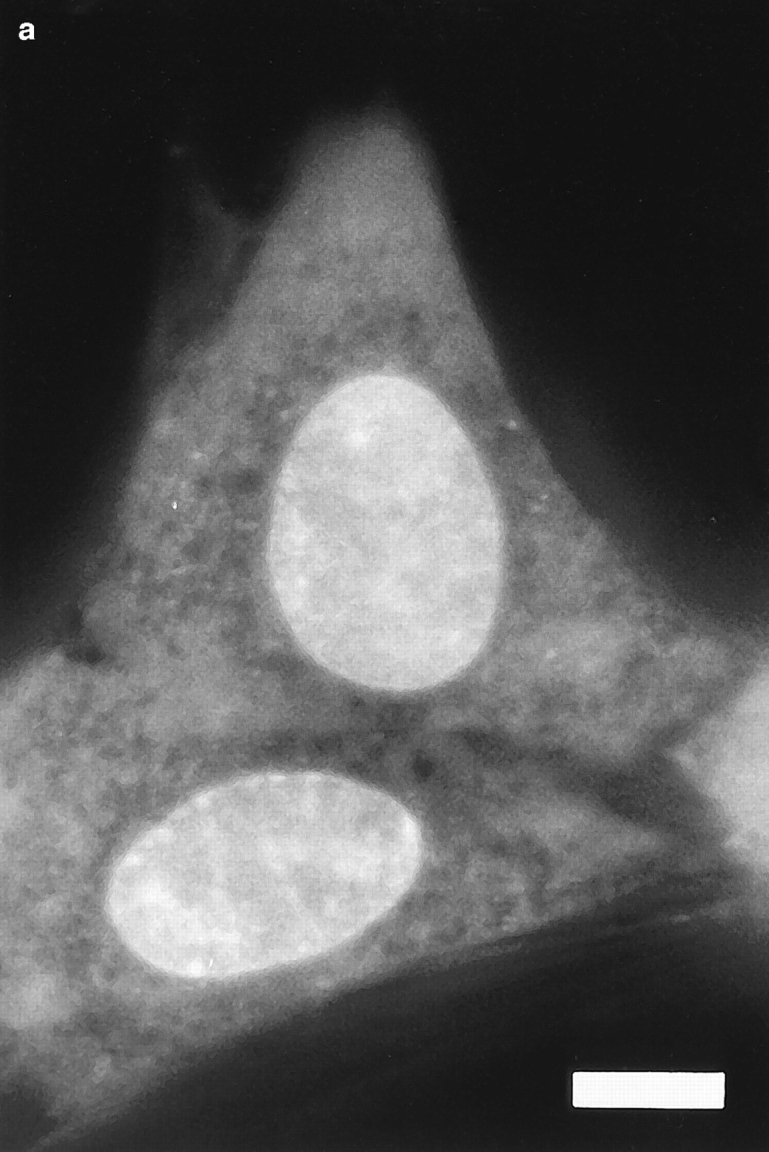
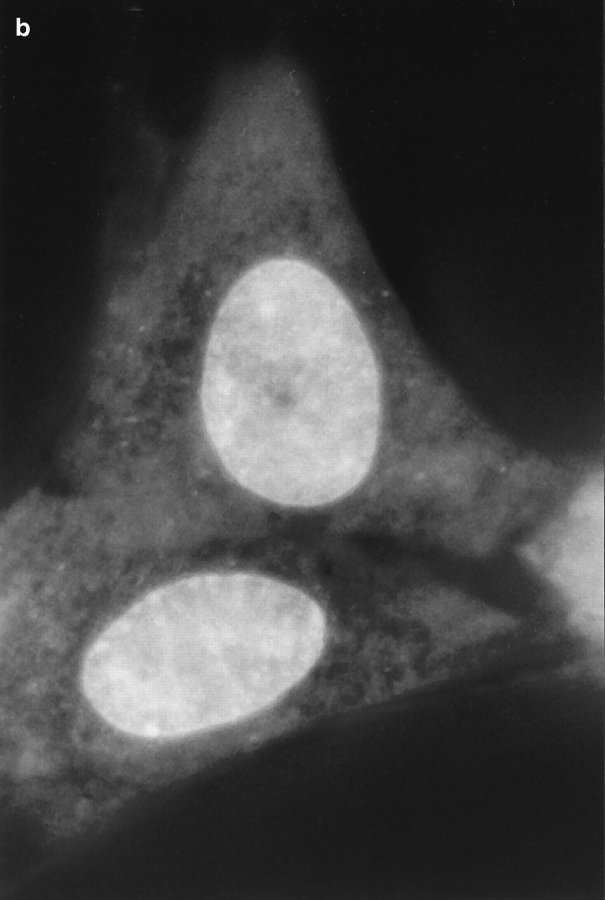
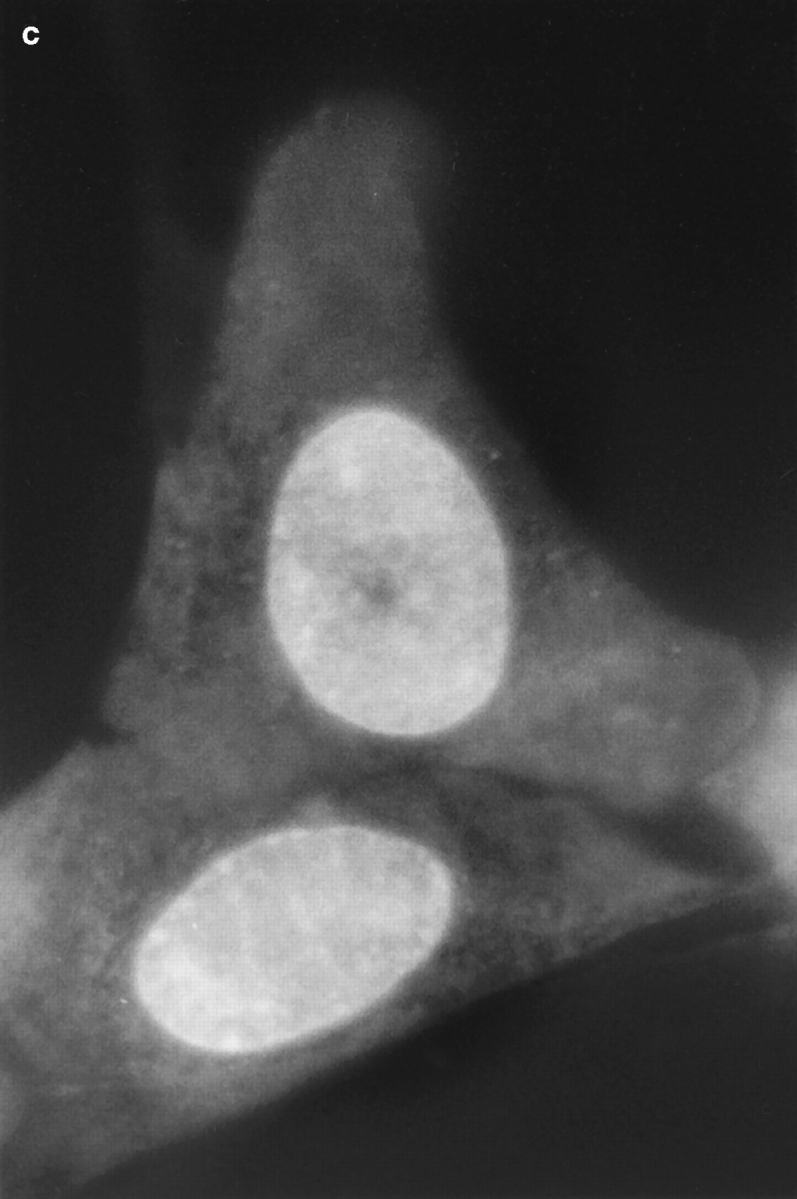
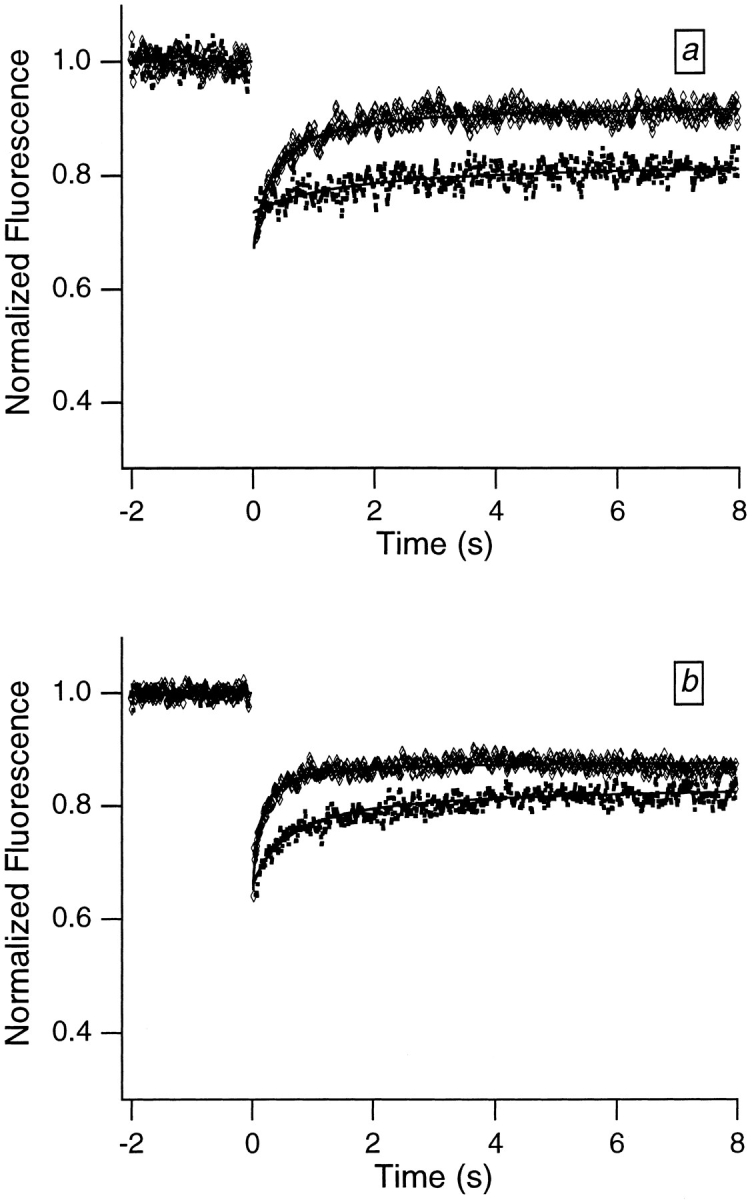
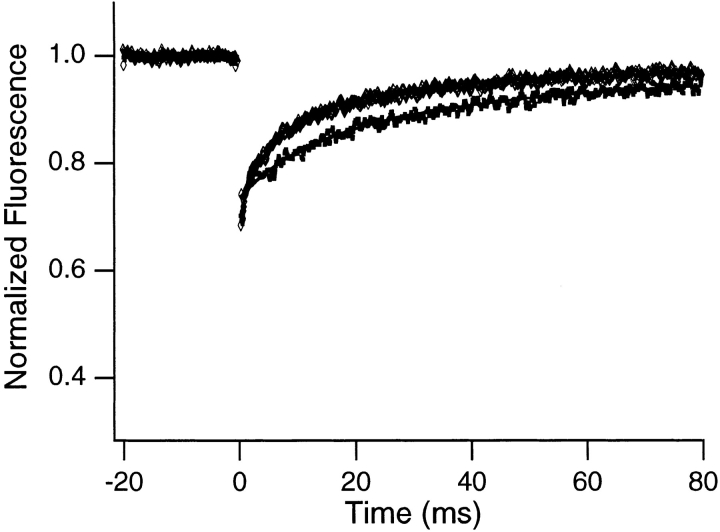
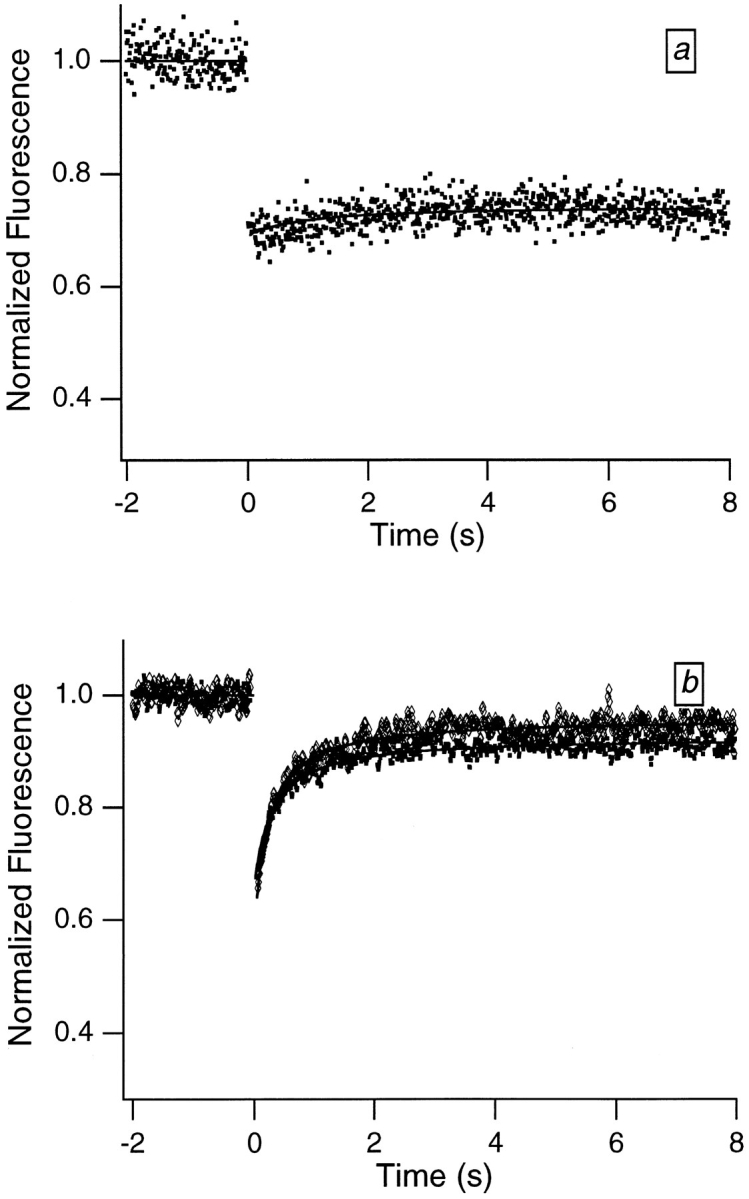
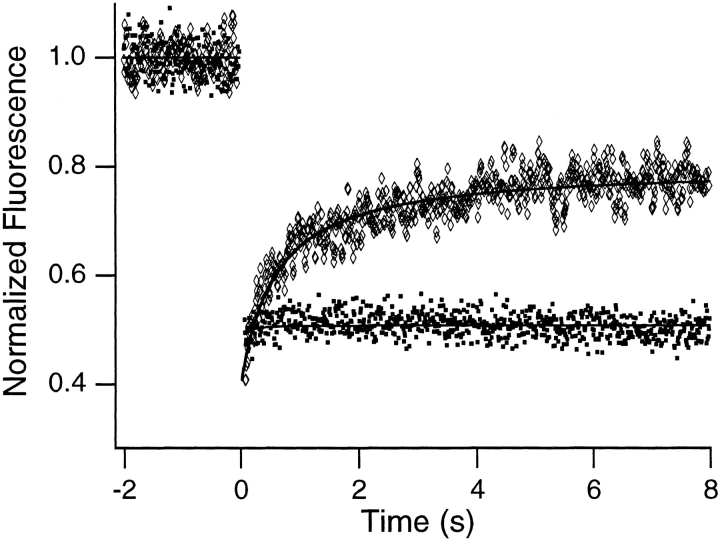
Translational dynamics of chromatin in interphase nuclei of living Swiss 3T3 and HeLa cells was studied using fluorescence microscopy and fluorescence recovery after photobleaching. Chromatin was fluorescently labeled using dihydroethidium, a membrane-permeant derivative of ethidium bromide. After labeling, a laser was used to bleach small (approximately 0.4 microm radius) spots in the heterochromatin and euchromatin of cells of both types. These spots were observed to persist for >1 h, implying that interphase chromatin is immobile over distance scales >/=0.4 microm. Over very short times (<1 s), a partial fluorescence recovery within the spots was observed. This partial recovery is attributed to independent dye motion, based on comparison with results obtained using ethidium homodimer-1, which binds essentially irreversibly to nucleic acids. The immobility observed here is consistent with chromosome confinement to domains in interphase nuclei. This immobility may reflect motion-impeding steric interactions that arise in the highly concentrated nuclear milieu or outright attachment of the chromatin to underlying nuclear substructures, such as nucleoli, the nuclear lamina, or the nuclear matrix.


Figures

Figure 1
Figure 1
Pre- (a) and post-bleach (b and c) photographs of two dihydroethidium-labeled Swiss 3T3 cells in interphase. The ethidium stains nucleic acid in both the nucleus and cytoplasm, and reveals the distribution of euchromatin and heterochromatin within the nucleus. a shows the cells immediately before bleaching; b and c show the cells a few minutes and 1 h after bleaching the upper cell, respectively. The long-lived dark spot in the upper cell in b and c was created in an initially fluorescent region of euchromatin by illuminating the region with a 300 ms pulse of 514 nm (green) light from an argon-ion laser (Power ≈ 50 mW at the sample). The failure of this spot to fill back up with fluorescently labeled chromatin demonstrates that a large fraction of the chromatin is immobile. The focus may have shifted slightly or the cell may have moved slightly in c after the sample spent 60 min on the microscope stage. Some nonuniformity in fluorescence in the photographs may arise from interference in the illuminating light. Bar, 10 μm.
Figure 1
Figure 1
Pre- (a) and post-bleach (b and c) photographs of two dihydroethidium-labeled Swiss 3T3 cells in interphase. The ethidium stains nucleic acid in both the nucleus and cytoplasm, and reveals the distribution of euchromatin and heterochromatin within the nucleus. a shows the cells immediately before bleaching; b and c show the cells a few minutes and 1 h after bleaching the upper cell, respectively. The long-lived dark spot in the upper cell in b and c was created in an initially fluorescent region of euchromatin by illuminating the region with a 300 ms pulse of 514 nm (green) light from an argon-ion laser (Power ≈ 50 mW at the sample). The failure of this spot to fill back up with fluorescently labeled chromatin demonstrates that a large fraction of the chromatin is immobile. The focus may have shifted slightly or the cell may have moved slightly in c after the sample spent 60 min on the microscope stage. Some nonuniformity in fluorescence in the photographs may arise from interference in the illuminating light. Bar, 10 μm.
Figure 2
Figure 2
Typical FRAP curves and associated theoretical recovery curves obtained from dihydroethidium-labeled Swiss 3T3 cells (a) and HeLa cells (b). The FRAP curves were smoothed using an eleven-point fit to a fourth-order polynomial (Savitzky and Golay, 1964) to facilitate distinguishing the different recovery curves. The bleach pulse was 10 ms in duration, and data were collected in 10-ms increments. The upper (diamonds) and lower (squares) curves in each graph were obtained from relatively smaller (focused) and larger (defocused) spots, respectively. The defocused spot was obtained by translating a lens along the optical path so that the light was not focused exactly on the sample plane. Appropriate neutral density filters were inserted into the path of the bleach beam so that the bleach depths for the two curves in each graph were comparable; results did not depend on bleach depth (data not shown), because relatively shallow bleach depths were employed. Two important features are qualitatively apparent from the FRAP curves. First, a large fraction of the fluorescence fails to recover, indicating that a large fraction of the chromatin is immobile. Second, the recovery time associated with the fraction of the fluorescence that does recover increases with increasing spot size, indicating that molecular motion is the source of the initial recovery.
Figure 3
Figure 3
Typical FRAP curves and associated theoretical recovery curves obtained from a rhodamine-labeled antibody undergoing Brownian diffusion in dilute solution (∼0.5 mg/ml antibody) for smaller (diamonds) and larger (squares) spots. The bleach pulse was 200 μs in duration, and data were collected in 100-μs increments. The upper curve represents an average of 1,000 experiments and the lower an average of 3,000 experiments, and each was smoothed using an 11-point fit to a fourth-order polynomial. The fluorescence recovers almost completely, indicating that all molecules are mobile. In addition, the recovery time increases with increasing spot size.
Figure 4
Figure 4
Typical FRAP curves obtained from Swiss 3T3 cells that were labeled with dihydroethidium and then (a) dried down or (b) placed in a deoxygenated buffer (diamonds) or an atmosphere-equilibrated buffer (squares). Bleach and data collection times were 10 ms. The virtual absence of the initial recovery in a sample immobilized by drying (a) supports the idea that the recovery is motion derived. The failure of the initial relaxation time to vary appreciably with oxygen concentration in the hydrated samples (b) indicates that the initial relaxation does not represent reversible photobleaching. Six times more power was required to achieve bleaching in the deoxygenated sample comparable to that achieved in the nondeoxygenated sample. This reflects the greater difficulty of doing irreversible bleaching in the absence of oxygen, and shows that the deoxygenation was successful.
Figure 5
Figure 5
Typical FRAP curves obtained from fixed ethidium bromide–labeled (diamonds) and ethidium homodimer-1–labeled (squares) Swiss 3T3 cells. Note that the initial component is absent when the homodimer is used as a label.

Similar articles

Cited by

References

    1. Abney JR, Scalettar BA, Owicki JC. Self diffusion of interacting membrane proteins. Biophys J. 1989;55:817–833. - PMC - PubMed
    1. Alexander SP, Rieder CL. Chromosome motion during attachment to the vertebrate spindle: initial saltatory-like behavior of chromosomes and quantitative analysis of force production by nascent kinetochore fibers. J Cell Biol. 1991;113:805–815. - PMC - PubMed
    1. Axelrod D, Koppel DE, Schlessinger J, Elson E, Webb WW. Mobility measurement by analysis of fluorescence photobleaching recovery kinetics. Biophys J. 1976;16:1055–1069. - PMC - PubMed
    1. Baker, J.R. 1958. Principles of Biological Microtechnique. John Wiley & Sons Inc., New York. 357 pp.
    1. Bartholdi MF. Nuclear distribution of centromeres during the cell cycle of human diploid fibroblasts. J Cell Sci. 1991;99:255–263. - PubMed

Publication types