. 1997 Jun 30;137(7):1567-80.
doi: 10.1083/jcb.137.7.1567.

Kinetochore fiber maturation in PtK1 cells and its implications for the mechanisms of chromosome congression and anaphase onset

Affiliations

Kinetochore fiber maturation in PtK1 cells and its implications for the mechanisms of chromosome congression and anaphase onset

B F McEwen et al. J Cell Biol. .

Abstract

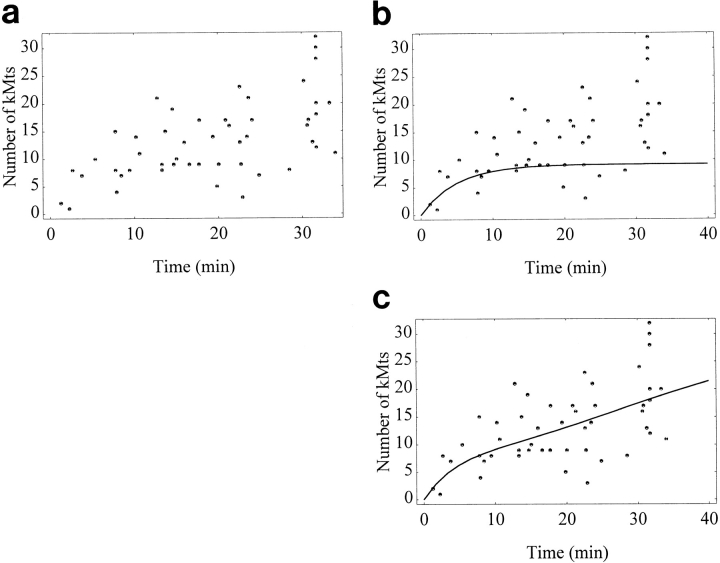
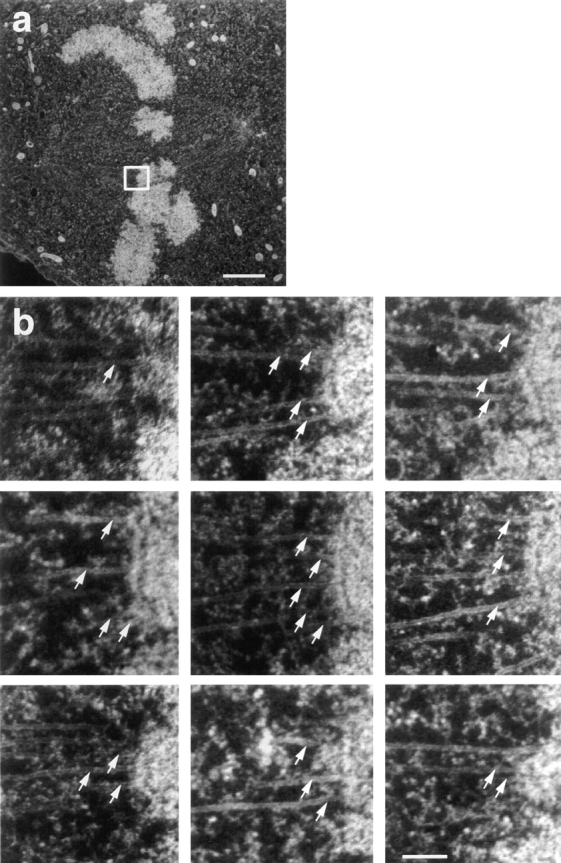
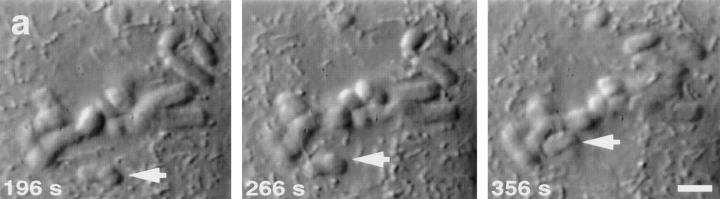
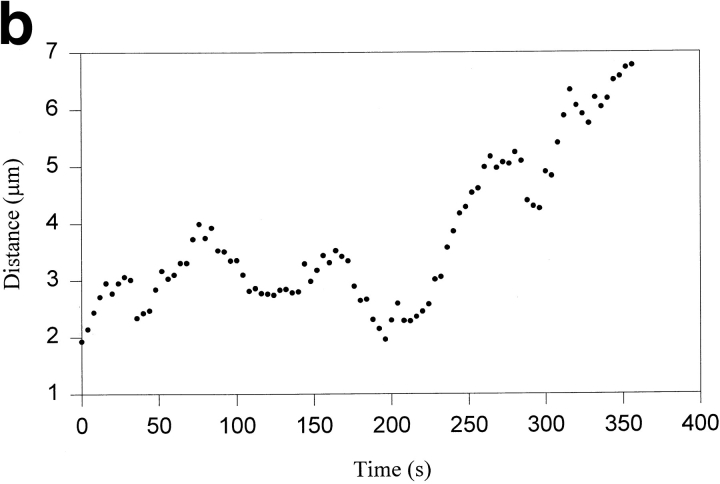
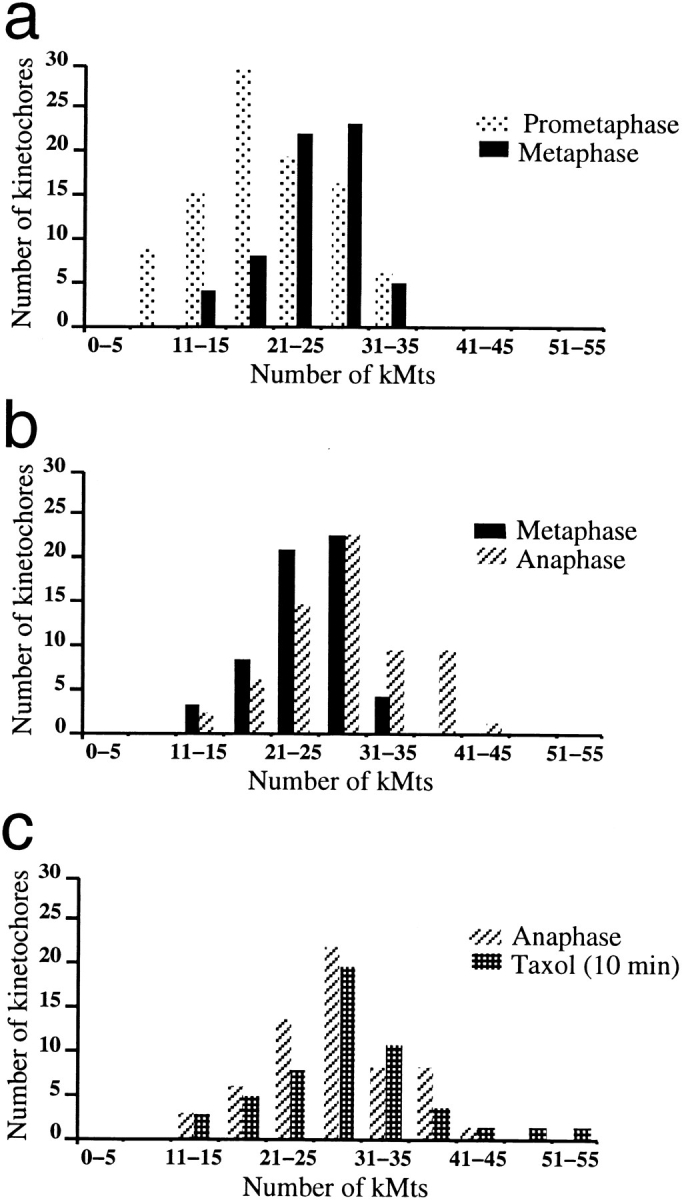
Kinetochore microtubules (kMts) are a subset of spindle microtubules that bind directly to the kinetochore to form the kinetochore fiber (K-fiber). The K-fiber in turn interacts with the kinetochore to produce chromosome motion toward the attached spindle pole. We have examined K-fiber maturation in PtK1 cells using same-cell video light microscopy/serial section EM. During congression, the kinetochore moving away from its spindle pole (i.e., the trailing kinetochore) and its leading, poleward moving sister both have variable numbers of kMts, but the trailing kinetochore always has at least twice as many kMts as the leading kinetochore. A comparison of Mt numbers on sister kinetochores of congressing chromosomes with their direction of motion, as well as distance from their associated spindle poles, reveals that the direction of motion is not determined by kMt number or total kMt length. The same result was observed for oscillating metaphase chromosomes. These data demonstrate that the tendency of a kinetochore to move poleward is not positively correlated with the kMt number. At late prometaphase, the average number of Mts on fully congressed kinetochores is 19.7 +/- 6.7 (n = 94), at late metaphase 24.3 +/- 4.9 (n = 62), and at early anaphase 27.8 +/- 6.3 (n = 65). Differences between these distributions are statistically significant. The increased kMt number during early anaphase, relative to late metaphase, reflects the increased kMt stability at anaphase onset. Treatment of late metaphase cells with 1 microM taxol inhibits anaphase onset, but produces the same kMt distribution as in early anaphase: 28.7 +/- 7. 4 (n = 54). Thus, a full complement of kMts is not sufficient to induce anaphase onset. We also measured the time course for kMt acquisition and determined an initial rate of 1.9 kMts/min. This rate accelerates up to 10-fold during the course of K-fiber maturation, suggesting an increased concentration of Mt plus ends in the vicinity of the kinetochore at late metaphase and/or cooperativity for kMt acquisition.


Figures

Figure 6
Figure 6
Time course for kMt acquisition. (a) Raw data. The length of time that monooriented, bioriented, and congressing chromosomes were attached to the spindle was determined from video records, as described in the text. (b) Curve predicted by a simple association/dissociation model (see Eq. 5). The association rate constant k 1 is estimated to be 0.053 from the earliest time points (see Eq. 4 a and text), the kMt value at saturation S is approximated as 35 kMts, and the dissociation rate constant k −1 is set at 0.15 kMt/min, based on a kMt half-life of 4.7 min at 37°C (Zhai et al., 1995). The resulting curve levels off at 9.2 kMts, far fewer than the 24 kMts observed at metaphase (Table IV). (c) Curve predicted by a model where k 1 increases with time (see Eq. 9). This curve is consistent with observations of both the initial rate of kMt acquisition and the kMt number at metaphase.
Figure 1
Figure 1
Illustration of our method for counting kMts from serial section electron micrographs. (a) Full area of one electron micrograph from a cell. Electron micrographs were taken at a magnification sufficiently low to record all of the mitotic spindle, and were then enlarged for counting kMts. The white box indicates one kinetochore and its associated microtubules to be counted in consecutive serial sections. (b) The outer plate of the kinetochore indicated in a could be identified in nine serial sections. Associated microtubules were counted as kMts when they were visible within 50 nm from the outer kinetochore plate or were embedded in the corona material. A total of 28 kMts were counted on this kinetochore (arrows). Bars: (a) 2 μm; (b) 0.2 μm.
Figure 2
Figure 2
Tracking of a congressing chromosome as identified by differential interference contrast (DIC) video-enhanced light microscopy. (a) Selected frames from the DIC-video record. The congressing chromosome is indicated by the white arrow, and the time after initiation of video tracking is given in the lower left corner of each frame. (b) Tracking record of the AP-moving kinetochore on the chromosome noted in a as it initiates congression and moves to the spindle equator. From the start of filming until ∼196 s, the chromosome is monooriented and oscillates without a net change in distance from the spindle pole. At ∼196 s, the chromosome acquires bipolar attachment and initiates congression. During congression, the AP-moving kinetochore exhibits a brief reversal at ∼290 s and a pause at ∼330 s. Fixation is at 356 s. Bar, 5 μm.
Figure 2
Figure 2
Tracking of a congressing chromosome as identified by differential interference contrast (DIC) video-enhanced light microscopy. (a) Selected frames from the DIC-video record. The congressing chromosome is indicated by the white arrow, and the time after initiation of video tracking is given in the lower left corner of each frame. (b) Tracking record of the AP-moving kinetochore on the chromosome noted in a as it initiates congression and moves to the spindle equator. From the start of filming until ∼196 s, the chromosome is monooriented and oscillates without a net change in distance from the spindle pole. At ∼196 s, the chromosome acquires bipolar attachment and initiates congression. During congression, the AP-moving kinetochore exhibits a brief reversal at ∼290 s and a pause at ∼330 s. Fixation is at 356 s. Bar, 5 μm.
Figure 3
Figure 3
Serial section electron microscopic analysis of the congressing chromosome from Fig. 2 to determine kMt numbers and distance from spindle poles. (a) An electron micrograph from a serial section series through the cell. White arrow indicates the AP-moving kinetochore of the congressing chromosome. (b) Measurement of the distances between sister kinetochores and their associated spindle poles. The congressing chromosome was reconstructed in 3D from serial sections, as described in the text. Sister kinetochores are indicated by the light regions at the site where K-fibers (white tubes) attach to the chromosome (gray). The centrioles are schematically represented by cylinders. Distances between kinetochores and the spindle poles were determined by measuring the K-fiber length in 3D. Bar, 2 μm.
Figure 4
Figure 4
Correlating kMt numbers with the direction of motion of sister kinetochores on an oscillating metaphase chromosome. (a) Frames from the DIC video record showing the oscillating chromosome, indicated by black arrows. (b) Tracking record for sister kinetochores of the oscillating chromosome. Arrowheads correspond to frames shown in a. At fixation (512 s), one kinetochore is moving P and the other is moving AP. (c) A serial section electron micrograph of the cell. Oscillating chromosome is indicated by white arrow. (d) Electron micrograph enlarged to show the P kinetochore and its associated kMts. The kMts were counted in successive serial sections, as illustrated in Fig. 1. (e) Electron micrograph enlarged to show the AP kinetochore and its associated kMts. Bars: (a) 4 μm; (c) 2.2 μm; (d and e) 0.12 μm.
Figure 4
Figure 4
Correlating kMt numbers with the direction of motion of sister kinetochores on an oscillating metaphase chromosome. (a) Frames from the DIC video record showing the oscillating chromosome, indicated by black arrows. (b) Tracking record for sister kinetochores of the oscillating chromosome. Arrowheads correspond to frames shown in a. At fixation (512 s), one kinetochore is moving P and the other is moving AP. (c) A serial section electron micrograph of the cell. Oscillating chromosome is indicated by white arrow. (d) Electron micrograph enlarged to show the P kinetochore and its associated kMts. The kMts were counted in successive serial sections, as illustrated in Fig. 1. (e) Electron micrograph enlarged to show the AP kinetochore and its associated kMts. Bars: (a) 4 μm; (c) 2.2 μm; (d and e) 0.12 μm.
Figure 5
Figure 5
Numbers of kMts on late prometaphase, mature metaphase, early anaphase, and taxol-treated metaphase cells. The mitotic stages are defined in Table IV. (a) A comparison of kMt numbers from late prometaphase and mature metaphase kinetochores reveals that the prometaphase kinetochores are less saturated than the metaphase kinetochores. (b) A comparison of kMt numbers on late metaphase and early anaphase kinetochores reveals that mature metaphase kinetochores are less saturated than early anaphase kinetochores. (c) A comparison of kMt numbers on taxol-treated (10 min) metaphase and early anaphase kinetochores reveals no difference in the distribution.

Similar articles

Cited by

References

    1. Bajer AS. Functional autonomy of monopolar spindle and evidence for oscillatory movement in mitosis. J Cell Biol. 1982;93:33–48. - PMC - PubMed
    1. Brinkley BR, Cartwright J., Jr Ultrastructural analysis of mitotic spindle elongation in mammalian cells in vitro: direct microtubule counts. J Cell Biol. 1971;50:416–431. - PMC - PubMed
    1. Cassimeris L, Rieder CL, Rupp G, Salmon ED. Stability of microtubule attachment to metaphase kinetochores in PtK1cells. J Cell Sci. 1990;96:9–15. - PubMed
    1. Cassimeris L, Rieder CL, Salmon ED. Microtubule assembly and kinetochore directional instability in vertebrate monopolar spindles: implications for the mechanism of chromosome congression. J Cell Sci. 1994;107:285–297. - PubMed
    1. Desai A, Mitchison TJ. A new role for motor proteins as couplers to depolymerizing microtubules. J Cell Biol. 1995;128:1–4. - PMC - PubMed

Publication types