. 1997 Jun;7(6):649-56.
doi: 10.1101/gr.7.6.649.

PowerBLAST: a new network BLAST application for interactive or automated sequence analysis and annotation

Affiliations

PowerBLAST: a new network BLAST application for interactive or automated sequence analysis and annotation

J Zhang et al. Genome Res. 1997 Jun.

Abstract

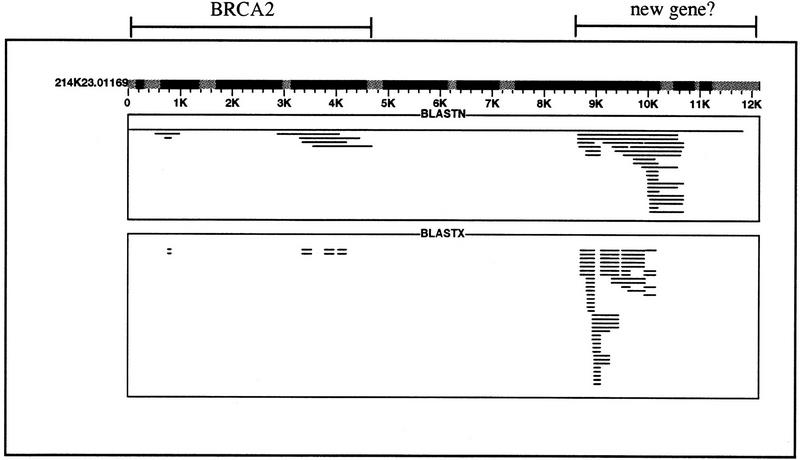
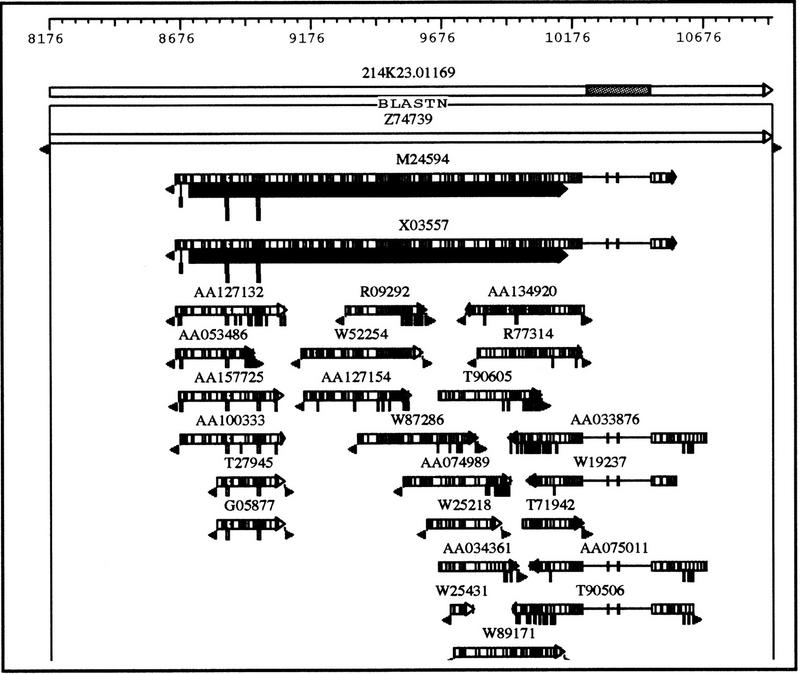
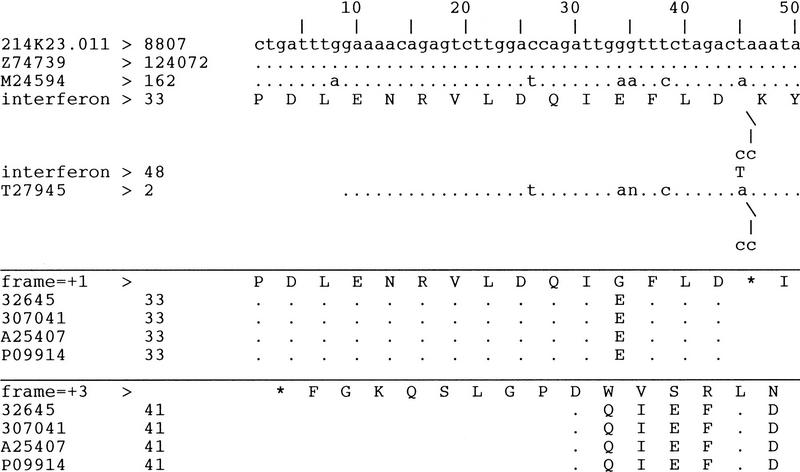
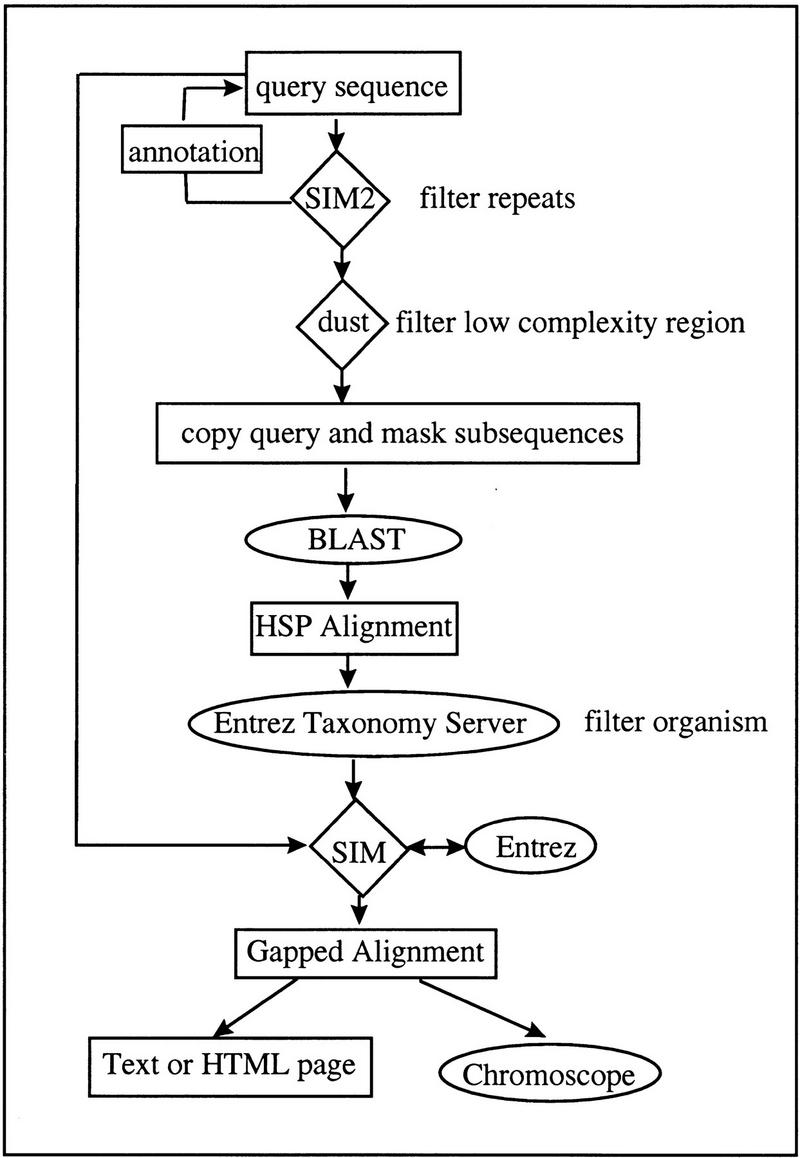
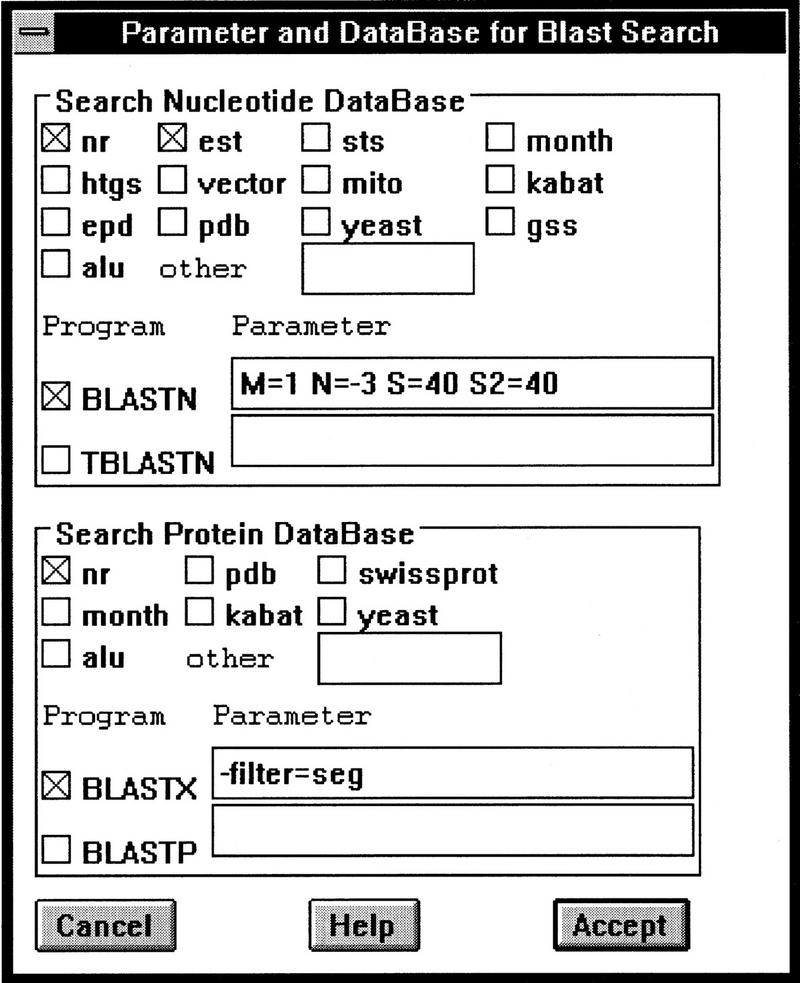
As the rate of DNA sequencing increases, analysis by sequence similarity search will need to become much more efficient in terms of sensitivity, specificity, automation potential, and consistency in annotation. PowerBLAST was developed, in part, to address these problems. PowerBLAST includes a number of options for masking repetitive elements and low complexity subsequences. It also has the capacity to restrict the search to any level of NCBI's taxonomy index, thus supporting "comparative genomics" applications. Postprocessing of the BLAST output using the SIM series of algorithms produces optimal, gapped alignments, and multiple alignments when a region of the query sequence matches multiple database sequences. PowerBLAST is capable of processing sequences of any length because it divides long query sequences into overlapping fragments and then merges the results after searching. The results may be viewed graphically, as a textual representation, or as an HTML page with links to GenBank and Entrez. For matching database sequences, annotated features are superimposed on the aligned query sequence in the output, thus greatly increasing the ease of interpretation. Such features may be used for automated annotation of new sequence because PowerBLAST output in ASN.1 form may be "dragged and dropped" into NCBI's Sequin program for sequence annotation and submission. PowerBLAST is capable of analyzing and annotating a 100-kb query in 60 min on NCBI's BLAST server.


Figures

Figure 1
Figure 1
Global view of the PowerBLAST results in Chromoscope. The query sequence 214K23.01169 is a P1-derived artificial chromosome (PAC) clone in the 900-kb region of human chromosome 13 that contains the BRCA2 gene. The sequence was obtained from the web site of the Washington University Genome Sequencing Center (http://genome.wustl.edu) and at the time of retrieval these data were in “phase 2” of finishing. The shaded regions in the query sequence indicate the locations of repeat regions identified by PowerBLAST. The results from BLASTN and BLASTX are grouped into separate rectangles. Each line within the rectangle represents one alignment, and if parts of the matching sequence align to more than one region, the lines are shown in color (this situation occurs when an mRNA sequence is split into its component exons upon alignment with its gene). There are three clusters of alignments. The first is from 500 to 1000 nucleotides (between 0 and 1K on the scaled diagram), the second from ∼3K to 5K nucleotides, and the last from 8.5K to 11K nucleotides. In all of the regions, both BLASTN and BLASTX hits were found. The first and second cluster code for the last four exons of the BRCA2 gene (GenBank accession no. Z74739), whereas the third cluster shows high similarity to a 56-kD interferon-induced protein (SwissProt P09914) and its mRNA (GenBank accession no. M24594).
Figure 2
Figure 2
Detailed graphic view of the third alignment cluster in Fig. 1. The shaded area in the query sequence represents a repeat region. Each rectangle represents an alignment. The arrow at the end indicates the orientation of alignment. The numerous grey lines inside the rectangle represent mismatched residues compared with the query sequence. A gap in a matching sequence is represented by a single line connecting two adjacent rectangles, and an insertion is represented by a vertical bar connected to a rectangle that is proportional to the size of the insertion. The triangles at the end indicate unaligned ends, often seen in EST matches because of the degenerating data quality at the ends of the “single pass” sequence reads. The grey rectangles beneath the two mRNA sequences (GenBank accession nos. M24594 and X03557) show the coding region features in the aligned region.
Figure 3
Figure 3
The graphic view of the multiple alignments for the MEN1 gene against mouse and human EST database. Annotated mRNA and coding features, shown as shaded and open boxes respectively, are labeled above the alignments. Each box represents an exon, and the mRNA sequence is made up of 10 exons. Exons 1,2,3,7,8,9, and 10 are confirmed by the mouse EST hits. Exons 2,5,6,7,8, and 10 are confirmed by the human EST hits. Combining the results from both the mouse and human database, only exon 4 is missing from the EST hits. Two human ESTs hits (GenBank accession nos. AA209475 and AA211877) are aligned to the intronic regions. They are the 5′ and 3′ ends of the same cDNA clone (648332) sequenced by the Washington University School of Medicine (St. Louis, MO). The alignments are in reverse orientation of the transcription, which suggests a potential antisense transcription of this gene.
Figure 4
Figure 4
An abbreviated text view of the multiple alignments in Fig. 2. The results from BLASTN and BLASTX are separated into three panels. (Top) The results from BLASTN; (middle, bottom) the results from BLASTX with translation reading frames +1 and +3, respectively. Three BLASTN hits are displayed: the BRCA2 genomic sequence (GenBank accession no. Z74739); an mRNA sequence (GenBank accession no. M24594), which encodes a 56-kD interferon-induced protein; and an EST sequence (GenBank accession no. T27945). The results are displayed as multiple pairwise alignments to compare the sequence identity between the query sequence and the matching database sequences. The mismatched residues are displayed, whereas the identical residues are shown as dots. Gaps on the master sequence, i.e., the query sequence, are displayed as insertions in the matching sequences, e.g., at nucleotide 8852 of the query sequence, both M24594 and T27945 have the same 2-nucleotide insertion represented by / | cc In this region, the coding region feature on M24594 is represented by labeling each translated amino acid residue in the middle of the 3-base condon. The translated amino acid residue at the insertion are labeled as well. The > or the < symbol attached to a sequence label indicates the plus or minus orientation of the alignment; the > or < symbol at the end of the annotated coding region feature indicates the orientation of the transcription in relation to the orientation of the alignment. If a sequence or a feature label exceeds 12 characters, it will be truncated, such as the label for “interferon-induced protein,“ which was shortened to interferon. For BLASTX results, the conceptual transactions with the specified reading frames are displayed in the middle and bottom panels. The conceptual translation is compared with mathing sequences from the protein databases, and the identical residues are labeled as dots. In this view, all of the four protein sequences (GenBank accession nos. 32645, 307041, A25407, and P09914), align to the query sequence in both frames +1 and +3. The alignments for frame 1 translation stop at position 8852 on the query sequence, which corresponds to the 2-nucleotides gap in the query sequence. This gap also introduces a stop codon (represented by an asterisk, *) in the query sequence on the translation with frame = +1. Because the sequence variations are consistent in the alignments of the two transcript sequences as well as those of the protein sequences, the sequence homology suggests a pseudogene in this region.
Figure 5
Figure 5
Overview of data processes in PowerBLAST. Applications that require network connections, such as the BLAST and Entrez servers, are enclosed by ovals. The applications that run on the client machine (e.g., SIM, dust) are enclosed by diamonds. Program imput/output is enclosed by rectangles.
Figure 6
Figure 6
The graphic interface for setting up options of searching against multiple databases with multiple BLAST programs. The settings shown specify a BLASTN search against both the nr (the non-redundant database) and the est database with the parameters M = 1 N = −3 S = 40 S2 = 40; and a BLASTX search against the nr database with the query sequence masked for low complexity using the paramer −filter = seg.

References

    1. Altschul SF, Gish W, Miller W, Myers EW, Lipman DJ. Basic local alignment search tool. J Mol Biol. 1990;215:403–410. - PubMed
    1. Altschul SF, Boguski MS, Wootton JC. Issues in searching molecular sequence databases. Nature Genet. 1994;6:119–129. - PubMed
    1. Chao K-M, Zhang J, Ostell J, Miller W. A local alignment tool for very long DNA sequences. Comput Applic Biosci. 1994;11:147–153. - PubMed
    1. Chao K-M, Zhang J, Ostell J, Miller W. A tool for aligning very similar DNA sequences. Comput Applic Biosci. 1997;13:75–80. - PubMed
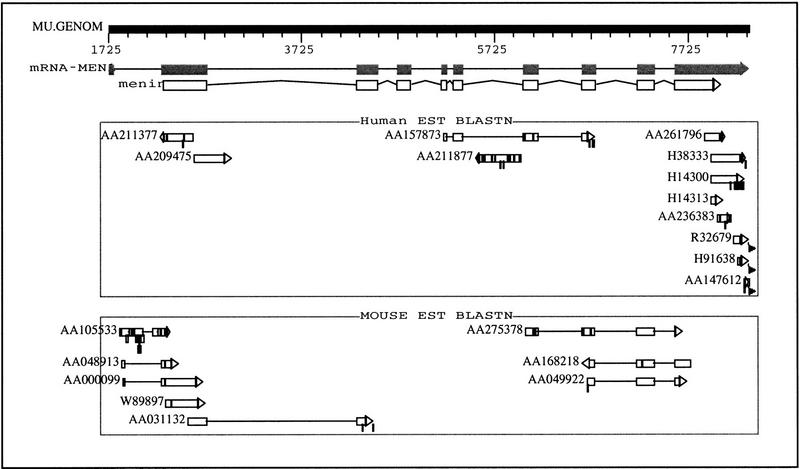
    1. Chandrasekharappa SC, Guru SC, Manickam P, Olufemi S, Collins FS, Emmert-Buck MR, Debelenko LV, Zhuang Z, Lubensky IA, Liotta LA, Crabtree JS, Wang Y, Roe BA, Weisemann J, Boguski MS, Agarwal SK, Kester MB, Kim YS, Heppner C, Dong Q, Spiegel AM, Burns AL, Marx SJ. Positional cloning of the gene for multiple endocrine neoplasia-type 1. Science. 1997;276:404–407. - PubMed