. 1997 Jul 4;277(5322):60-6.
doi: 10.1126/science.277.5322.60.

Crystal structure of the cytochrome bc1 complex from bovine heart mitochondria

Affiliations

Crystal structure of the cytochrome bc1 complex from bovine heart mitochondria

D Xia et al. Science. .

Erratum in

  • Science 1997 Dec 19;278(5346):2037

Abstract

On the basis of x-ray diffraction data to a resolution of 2.9 angstroms, atomic models of most protein components of the bovine cytochrome bc1 complex were built, including core 1, core 2, cytochrome b, subunit 6, subunit 7, a carboxyl-terminal fragment of cytochrome c1, and an amino-terminal fragment of the iron-sulfur protein. The positions of the four iron centers within the bc1 complex and the binding sites of the two specific respiratory inhibitors antimycin A and myxothiazol were identified. The membrane-spanning region of each bc1 complex monomer consists of 13 transmembrane helices, eight of which belong to cytochrome b. Closely interacting monomers are arranged as symmetric dimers and form cavities through which the inhibitor binding pockets can be accessed. The proteins core 1 and core 2 are structurally similar to each other and consist of two domains of roughly equal size and identical folding topology.


Figures
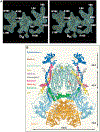
Fig. 1.
Fig. 1.
(A) Stereo diagram of an electron density map calculated with MIR phases, improved by density modification, and contoured at 1.2σ. It shows the bH heme, its histidine ligands, and parts of the transmembrane helices B and D. Abbreviations for amino acids: A, Ala; G, Gly; H, His; L, Leu; M, Met; R, Arg; and Y, Tyr. (B) Partial structural model of the dimeric cytochrome bc1 complex with polypeptides drawn as ribbons, hemes as stick models, and the Rieske iron-sulfur center as balls. Five of the eleven subunits (core 1, core 2, cytochrome b, subunit 6, and subunit 7) are completely traced and their sequences assigned. The top of the molecule is in the mitochondrial intermembrane space (P side), the middle spans the membrane, and the bottom is in the matrix (N side); approximate dimensions are given for each region.
Fig. 2.
Fig. 2.
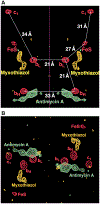
Anomalous scattering difference–Fourier map contoured at 5.1σ (red) and difference densities between inhibitor-bound and native crystals contoured at 4.5σ (antimycin A) and 4.0σ (myxothiazol). (A) View parallel to the membrane plane, with the intermembrane space at the top and the matrix space at the bottom. Peaks were assigned to hemes bH, bL, and c1 and to the Rieske iron-sulfur cluster, respectively, as shown. Distances between some iron pairs are indicated (see Table 2). The twofold symmetry axis of the bc1 dimer (purple line) runs in the plane of the diagram. (B) View perpendicular to the membrane plane.
Fig. 3.
Fig. 3.
Inhibitor binding sites in the cytochrome bc1 complex. (A) Stereo diagram of the antimycin A binding pocket. The helices a, A, D, and E of cytochrome b form the pocket as shown. The DE loop is the bottom, and the bH heme (yellow ball-and-stick model) is the back wall of the pocket. The difference density between inhibitor-bound and native crystals is contoured at 4.5σ (blue) and at −4.5σ (brown). An antimycin molecule is fitted to the positive density. (B) Stereo diagram of the myxothiazol binding pocket, formed by helices C, F, cd1, and ef of cytochrome b, as indicated. The bL heme (yellow ball-and-stick model) and the Rieske iron-sulfur center (green and yellow dots) are about equally distant from the pocket. The difference density is contoured at 4.0σ (blue).
Fig. 4.
Fig. 4.
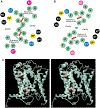
Membrane-spanning region and cytochrome b. (A) Arrangement of the transmembrane helices (represented by circles) of the bc1 dimer on the P side of the membrane. Green, cytochrome b; blue, cytochrome c1; magenta, subunit 7; yellow, ISP; black, unassigned; red rectangles, hemes; blue oval, twofold symmetry axis. The eight transmembrane helices of cytochrome b form two groups consisting of helices A to E and F to H, with the myxothiazol binding site in between. The cavity formed by the helices is indicated. Heme bL is oriented approximately normal to the membrane plane. (B) The arrangement of the transmembrane helices on the N side of the membrane [colors as in (A)] is different than on the P side because most of the helices are tilted with respect to the plane of the membrane or have kinks. Heme bH is oriented approximately normal to the membrane plane and is slightly rotated with respect to heme bL. The antimycin binding pocket is near heme bH. (C) Stereo diagram of cytochrome b monomer, oriented with the intermembrane space at the top and the matrix at the bottom. The polypeptide chain is represented as a light green ribbon. The eight transmembrane helices are labeled sequentially, A through H. Loops are labeled according to the two helices they connect (loops CD, DE, and EF are labeled as examples). Helices at the membrane surface are denoted a (near NH2-terminus), ab (in AB loop), cd1 and cd2 (in CD loop), and ef (in EF loop); labels for these helices are not shown. The two groups of transmembrane helices, A to E and F to H, can be distinguished. The hemes, shown in red ball-and-stick models, are bound to helices B and D.
Fig. 5.
Fig. 5.
Structure of the core subunits. (A) Stereo diagram of the heterodimer of core 1 (light blue) and core 2 (coral), viewed parallel to the intersubunit approximate twofold symmetry axis. The two molecules are associated such that the NH2-terminal domain of core 1 is facing the COOH-terminal domain of core 2. (B) Stereo diagram of core 2 in ribbon representation, showing two domains of the α-β structure related by an intradomain approximate twofold symmetry axis perpendicular to the plane of the diagram. (C) Topology diagram of the core proteins of bc1. Core 1 and core 2 have similar structures, each clearly separated into an NH2-terminal domain (top) and a COOH-terminal domain (bottom) with similar folding topology. β strands (red) and α helices (green). The β strand βH′ and α helices αA′, αE′, and αN′ exist only in the core 1 subunit.

References

    1. Hatefi Y, Haavik AG, Griffiths DE, J. Biol. Chem 237, 1681 (1962); - PubMed
    2. Brandt U and Trumpower BL, Crit. Rev. Biochem. Mol. Biol 29, 165 (1994); - PubMed
    3. Trumpower BL and Gennis RB, Annu. Rev. Biochem 63, 675 (1994); - PubMed
    4. Gennis RB et al. , J. Bioenerg. Biomembr 25, 195 (1993). - PubMed
    1. Schägger H, Link TA, Engel WD, Von Jagow G, Methods Enzymol 126, 224 (1986). - PubMed
    1. Gonzalez-Halphen D, Lindorfer MA, Capaldi RA, Biochemistry 27, 7021 (1988). - PubMed
    1. Wakabayashi S, Takeda H, Matsubara H, Kim CH, King TE, J. Biochem. (Tokyo) 91, 2077 (1982); - PubMed
    2. Wakabayashi S et al. , J. Biol. Chem 260, 337 (1985); - PubMed
    3. Schägger H, Borchart U, Aquila H, Link TA, Von Jagow G, FEBS Lett 190, 89 (1985); - PubMed
    4. Schägger H, Borchart U, Machleidt W, Link TA, Von Jagow G, ibid. 219, 161 (1987); - PubMed
    5. Borchart U, Machleidt W, Schägger H, Link TA, Von Jagow G, ibid. 191, 125 (1985); - PubMed
    6. ibid. 200, 81 (1986).
    1. Anderson S et al. , Nature 290, 457 (1981); - PubMed
    2. Gencic S, Schägger H, Von Jagow G, Eur. J. Biochem 199, 123 (1991); - PubMed
    3. Usui S, Yu L, Yu C-A, Biochem. Biophys. Res. Commun 167, 575 (1990); - PubMed
    4. Yu L, Deng KP, Yu C-A, J. Biol. Chem 270, 25634 (1995). - PubMed

Publication types

MeSH terms

Associated data