. 1997 Jul 15;17(14):5288-96.
doi: 10.1523/JNEUROSCI.17-14-05288.1997.

Nerve growth factor accelerates seizure development, enhances mossy fiber sprouting, and attenuates seizure-induced decreases in neuronal density in the kindling model of epilepsy

Affiliations

Nerve growth factor accelerates seizure development, enhances mossy fiber sprouting, and attenuates seizure-induced decreases in neuronal density in the kindling model of epilepsy

B Adams et al. J Neurosci. .

Abstract

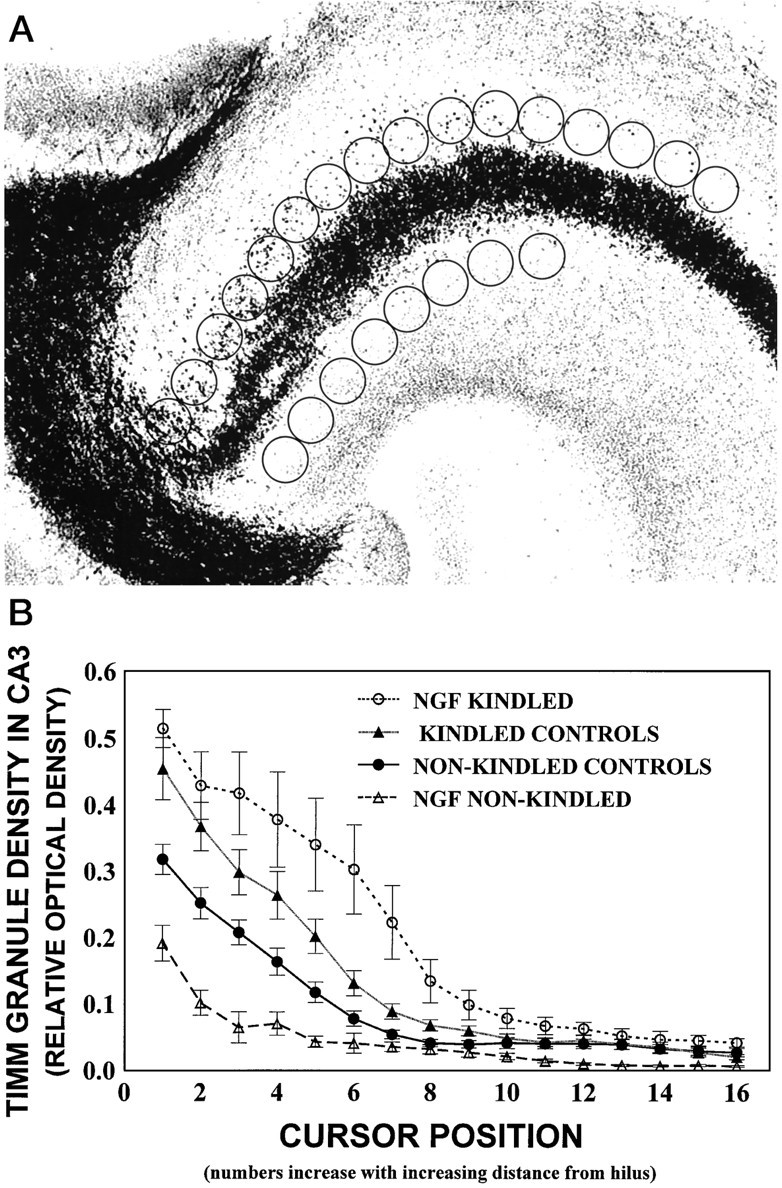
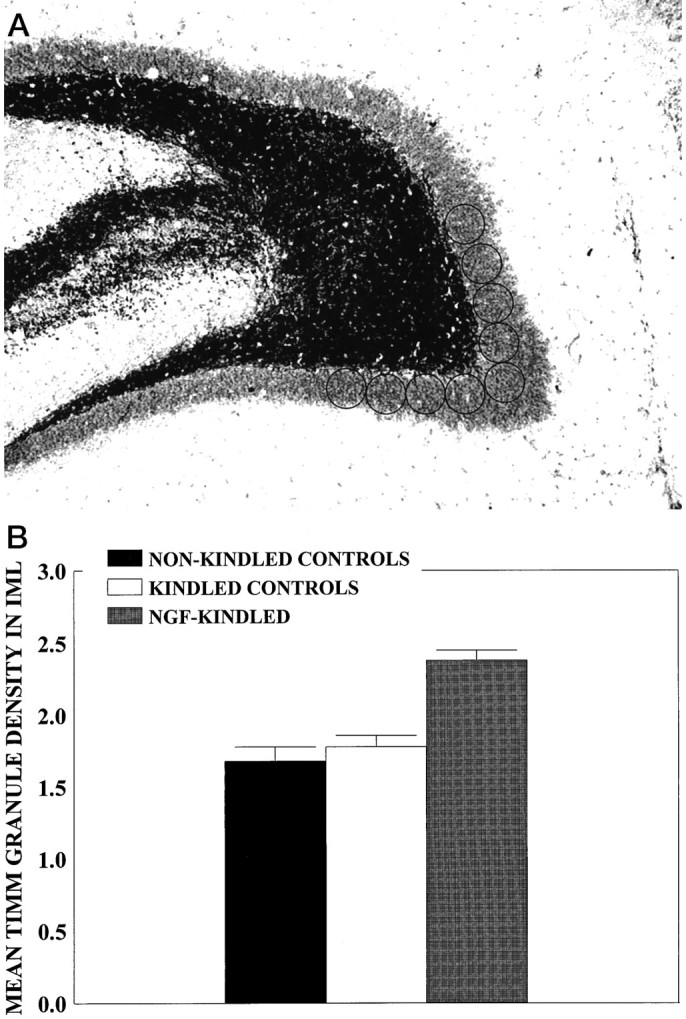
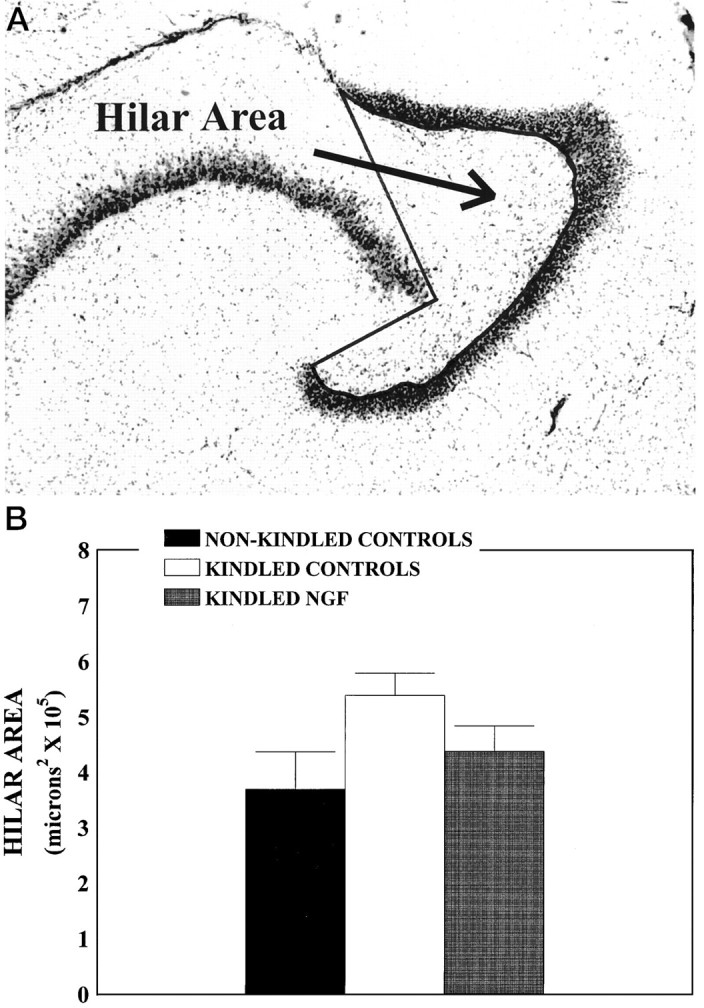
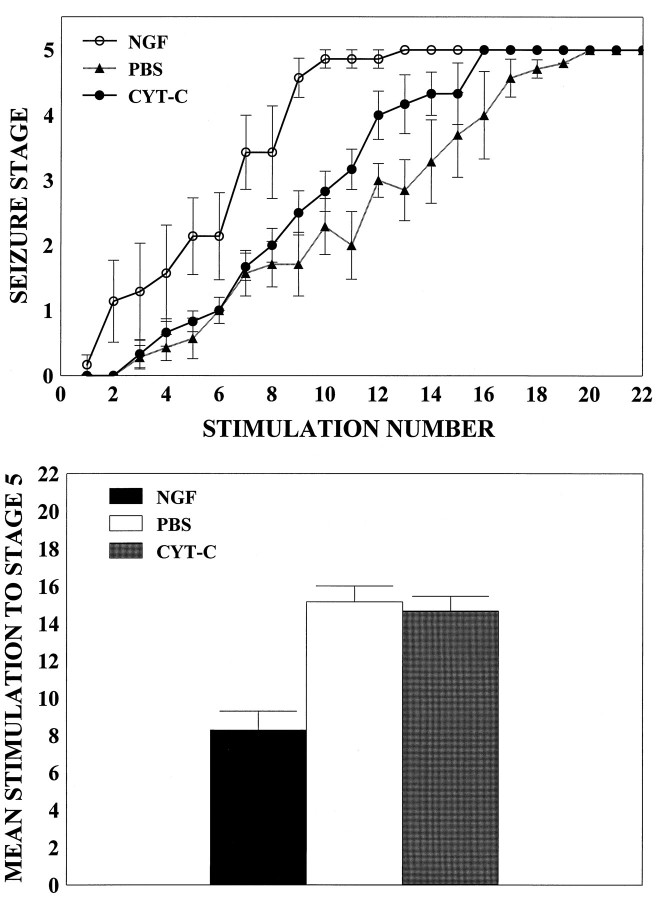
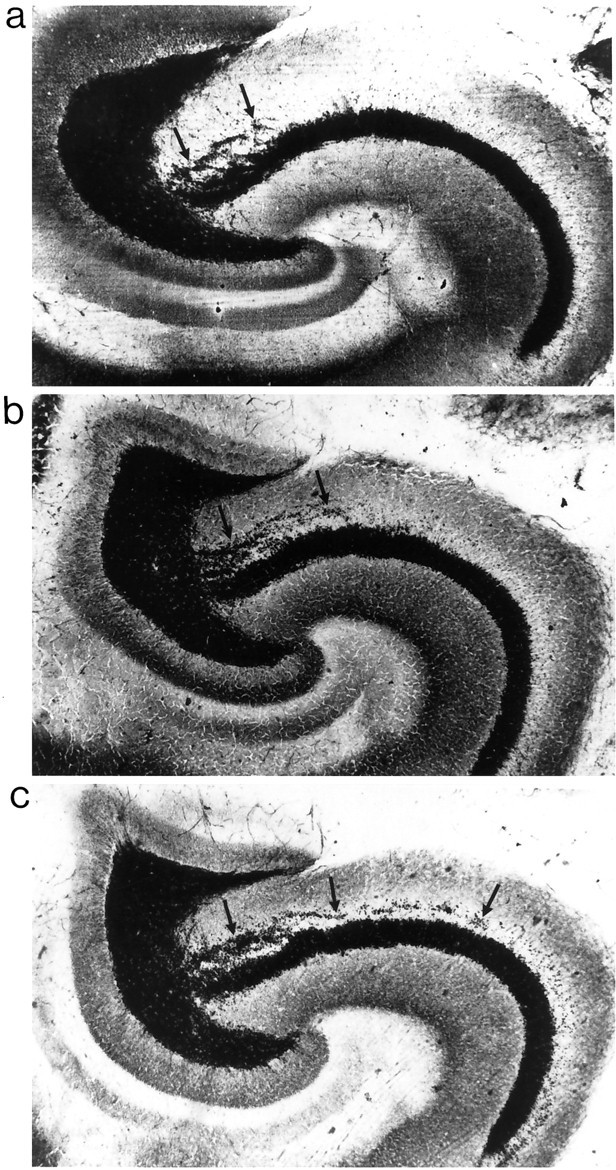
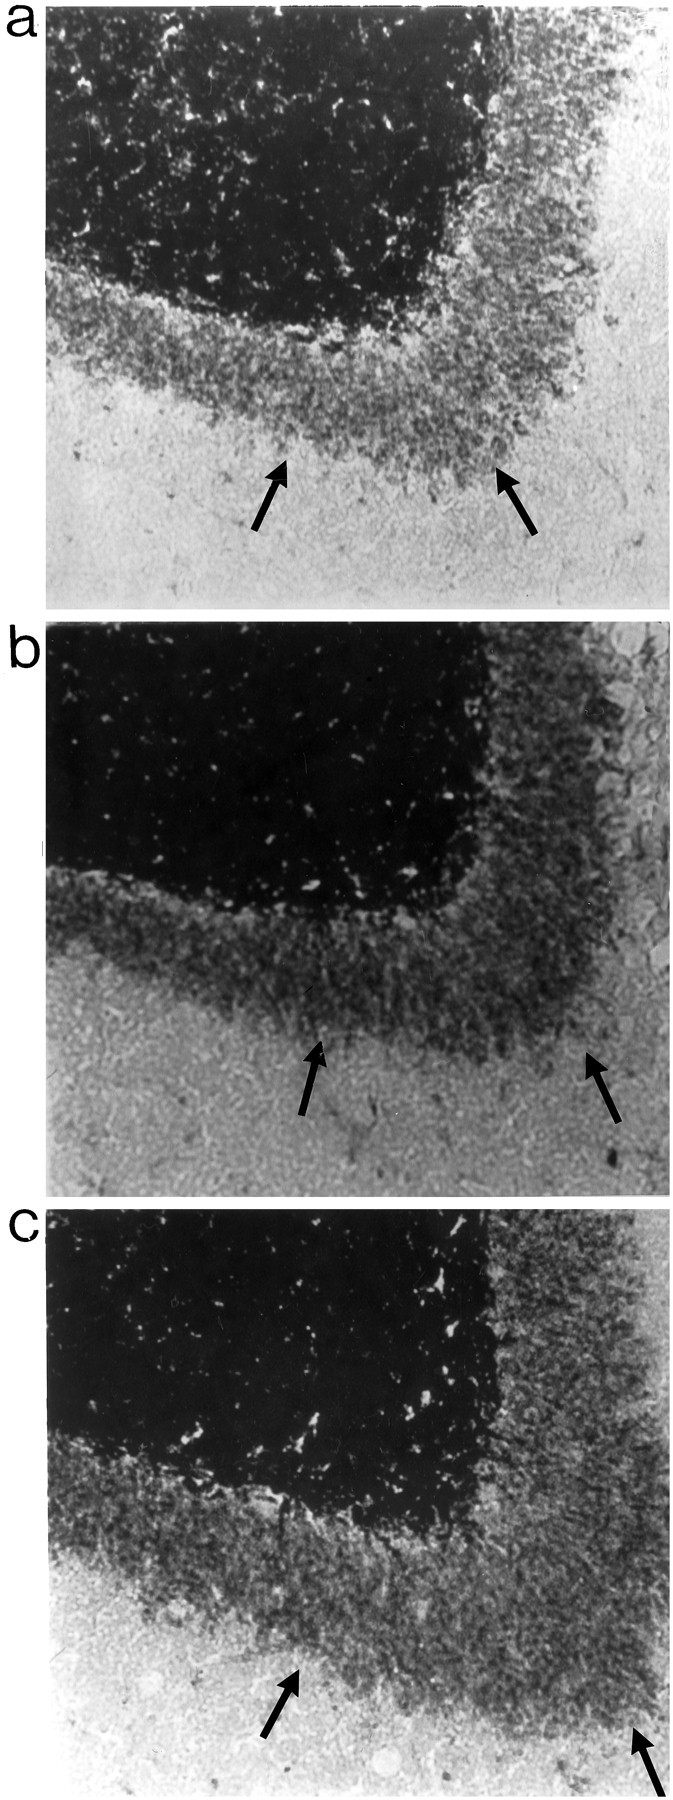
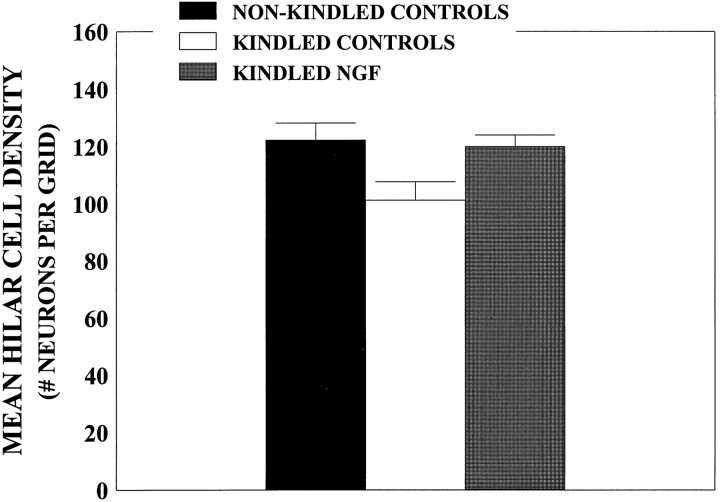
Recurrent seizure activity induced during kindling has been reported to produce a functional synaptic reorganization of the mossy fibers in the hippocampus. To date, it is unclear whether this kindling-induced growth is secondary to decreases in hilar neuron density, which are presumed to reflect hilar neuronal cell loss, or whether it is related specifically to an activation-dependent plasticity. We recently demonstrated that blocking nerve growth factor (NGF) biological activity retards seizure development and inhibits the sprouting of mossy fibers. We now demonstrate that intraventricular administration of NGF itself accelerates the progression of kindling epileptogenesis, increases mossy fiber sprouting in the CA3 region and in the inner molecular layer (IML), but reduces seizure-induced decreases in hilar cell density. These findings provide support for a role of NGF in kindling and kindling-induced mossy fiber sprouting. In addition, the results dissociate this form of epileptogenesis from hilar cell loss or decreases in hilar cell density attributable to increases in hilar area, thereby supporting seizure-induced mossy fiber sprouting as being primarily attributable to the combined effects of neuronal activation and the activation-induced upregulation of growth factors.


Figures

Fig. 3.
Fig. 3.
A, Digitized image of the hippocampal CA3 region. The density measurements of Timm granules were performed by placing an open circle cursor (1.3 cm2) at 16 adjacent positions along the stratum oriens starting adjacent to the hilar region. Eight cursors were placed in the stratum radiatum adjacent to the hilar region and provided the background staining density. Note that cursor windows for background measures in the stratum radiatum were clearly out of the mossy fiber tracts. B, Timm granule density in the CA3 region expressed as relative optical density (ROD) as a function of cursor position for all groups. Nonkindled and kindled control groups contain combined data for cytochrome C and PBS groups, because no differences were found among these groups by a three-way ANOVA and subsequentpost hoc comparisons (p > 0.05). Similarly, no differences in Timm granule density from ipsilateral and contralateral hippocampi were found (p > 0.05), so data were combined for graphical presentation. Values represent mean ROD as a function of cursor position ± SEM for the NGF-kindled group (n = 7), kindled control group (PBS-infused,n = 6; cytochrome C-infused, n= 5), nonkindled control group (PBS-infused, n = 7; cytochrome C-infused, n = 6), and NGF-infused nonkindled group (n = 5). There was a main effect for Cursor Position (p < 0.001), showing that the density of Timm granules was greatest in the hippocampal CA3 area near the hilus and decreased with increasing distance from the hilus in all animals. This main effect was qualified further by a significant Group × Cursor Position interaction (p < 0.001). Post hocanalyses revealed that Timm granule density was increased in the kindled groups (upper curves), as compared with all nonkindled groups (lower curves; p< 0.05). This enhancement was increased further in the NGF-kindled group (topmost curve), as compared with the other kindled conditions (p < 0.05).
Fig. 5.
Fig. 5.
A, Digitized image of the IML region. Density of Timm granules in IML region was measured at nine adjacent cursor positions by placing one cursor above the genu of the hilus and four cursor positions to the right and left of this cursor. Background values were provided as described in Figure3A. B, Timm granule density in IML region expressed as ROD for kindled-infused controls (n = 11), nonkindled-infused controls (n = 18), and the NGF-infused kindled group (n = 6). Timm granule density was increased in the NGF-kindled group relative to the kindled control group (p < 0.05) and the nonkindled group (p < 0.01). Values represent mean Timm granule density (ROD) as a function of group ± SEM.
Fig. 7.
Fig. 7.
Hilar area measurements. A,Hilar area outlined by thick line, using the MCID image analysis system. Hilar area was defined by the inner edge of the granule cell layer and the lines connecting the tips of the two granule cell blades to the beginning of the pyramidal cell layer of Ammon’s horn. Cresyl violet-stained sections used for the determination of neuronal density also were used for hilar area measurements.B, Mean hilar area as a function of treatment condition. A three-way ANOVA and subsequent post hoc comparisons revealed no differences among the nonkindled PBS (n= 7), cytochrome C (n = 6), and NGF groups (n = 5, nonkindled controls) (p > 0.05) and no differences between the kindled PBS (n = 6) and cytochrome C (n = 5) groups (kindled controls) (p > 0.05). Data for these nonkindled and kindled animals were combined, respectively. Values represent mean hilar area expressed in μm2 ± SEM. Mean hilar cell area was increased by ∼15% in the kindled control group relative to the nonkindled animals and the kindled NGF group (n = 7; p < 0.05).
Fig. 1.
Fig. 1.
Behavioral progression of seizure activity.A, NGF administration accelerates the behavioral progression of kindling. Values represent mean seizure stage ± SEM for NGF-kindled (NGF; n = 7), cytochrome C-kindled (CYT-C; n = 5), and PBS-kindled (PBS; n = 6) animals. B, The mean number of stimulations to reach a stage 5 seizure was calculated for all groups, and data were subjected to a one-way ANOVA with post hoc Tukey tests. NGF-infused rats (NGF; n = 7) required ∼45% fewer stimulations to reach a stage 5 seizure, as compared with rats infused with PBS (PBS; n = 6) or cytochrome C (CYT-C; n = 5) (p < 0.05). Values represent the mean number of stimulations ± SEM required to reach a stage 5 seizure.
Fig. 2.
Fig. 2.
Timm staining and kindling-induced synaptic reorganization in CA3 region induced by amygdala kindling. Shown are representative examples of area CA3 of a nonkindled PBS-infused rat (a), a kindled PBS-infused rat (b), and a kindled NGF-infused rat (c). Arrows point to Timm granules in the stratum oriens of the CA3.
Fig. 4.
Fig. 4.
Timm staining in IML region. A,Representative examples of IML region of a nonkindled PBS-infused rat (a), a kindled PBS-infused rat (b), and a kindled NGF-infused rat (c). Arrows point to Timm granules in the IML region.
Fig. 6.
Fig. 6.
Neuronal density counts in the hilar region.A, Mean hilar neuronal density as a function of group. A three-way ANOVA and subsequent post hoc comparisons revealed no differences among the nonkindled PBS (n= 7), cytochrome C (n = 6), and NGF (n = 5) groups (nonkindled controls;p > 0.05) and no differences between the kindled PBS (n = 6) and cytochrome C (n = 5) groups (kindled controls) (p > 0.05). Data for these nonkindled and kindled animals were combined, respectively. Values represent mean hilar cell density ± SEM. Mean hilar cell density was decreased by ∼15% in the kindled control group relative to both the nonkindled animals and the kindled NGF-infused group (n = 7; p < 0.05).

References

    1. Arnold PS, Racine RJ, Wise RA. Effects of atropine, reserpine, 6-hydroxydopamine, and handling on seizure development in the rat. Exp Neurol. 1973;40:457–470. - PubMed
    1. Bendotti C, Vezzani A, Tarizzo G, Samanin R. Increased expression of GAP-43, somatostatin, and neuropeptide Y mRNA in the hippocampus during development of hippocampal kindling in rats. Eur J Neurosci. 1993;5:1312–1320. - PubMed
    1. Bengzon J, Soderstrom S, Kokaia Z, Kokaia M, Ernfors P, Persson H, Ebendal T, Lindvall O. Widespread increase of nerve growth factor protein in the rat forebrain after kindling-induced seizures. Brain Res. 1992;587:338–342. - PubMed
    1. Bengzon J, Kokaia Z, Ernfors P, Kokaia M, Leanza G, Nilsson OG, Persson H, Lindvall O. Regulation of neurotrophin and trkA and trkC tyrosine kinase receptor messenger RNA expression in kindling. Neuroscience. 1993;53:433–436. - PubMed
    1. Bertram EH, Lothman EW. Morphometric effects of intermittent kindled seizures and limbic status epilepticus in the dentate gyrus of the rat. Brain Res. 1993;603:25–31. - PubMed

Publication types

Substances