. 1997 Jul 15;17(14):5416-27.
doi: 10.1523/JNEUROSCI.17-14-05416.1997.

Visualization of the distribution of autophosphorylated calcium/calmodulin-dependent protein kinase II after tetanic stimulation in the CA1 area of the hippocampus

Affiliations

Visualization of the distribution of autophosphorylated calcium/calmodulin-dependent protein kinase II after tetanic stimulation in the CA1 area of the hippocampus

Y Ouyang et al. J Neurosci. .

Abstract

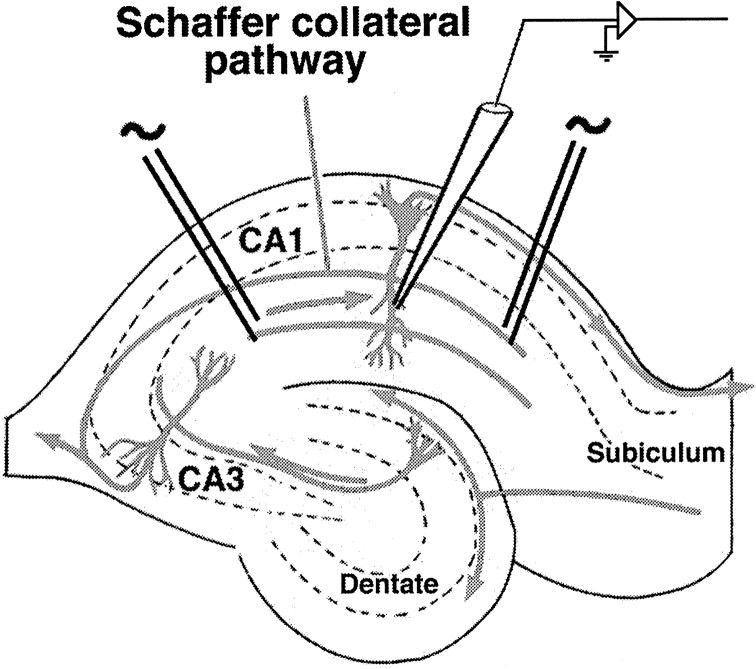
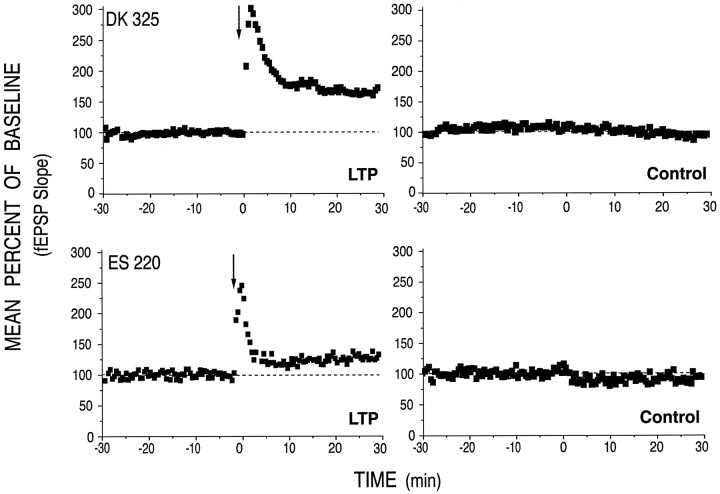
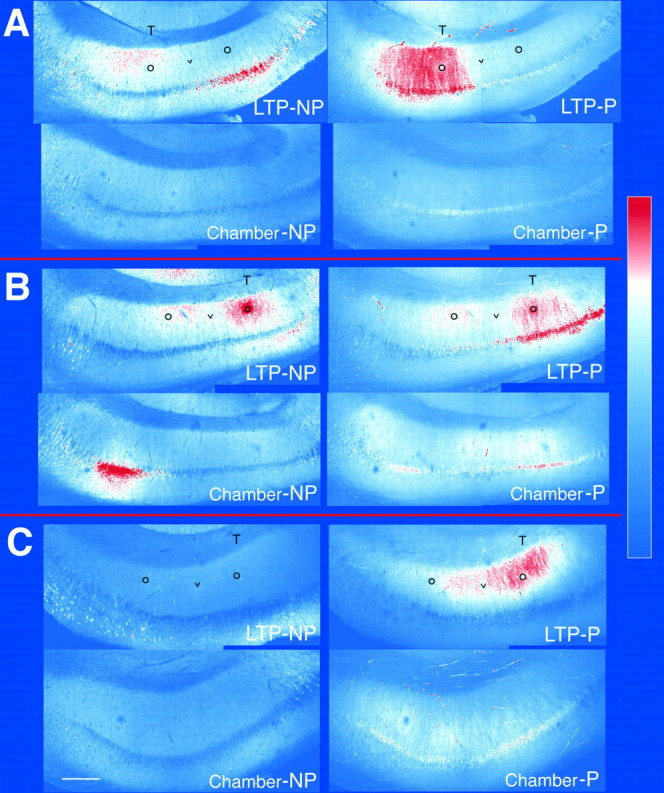
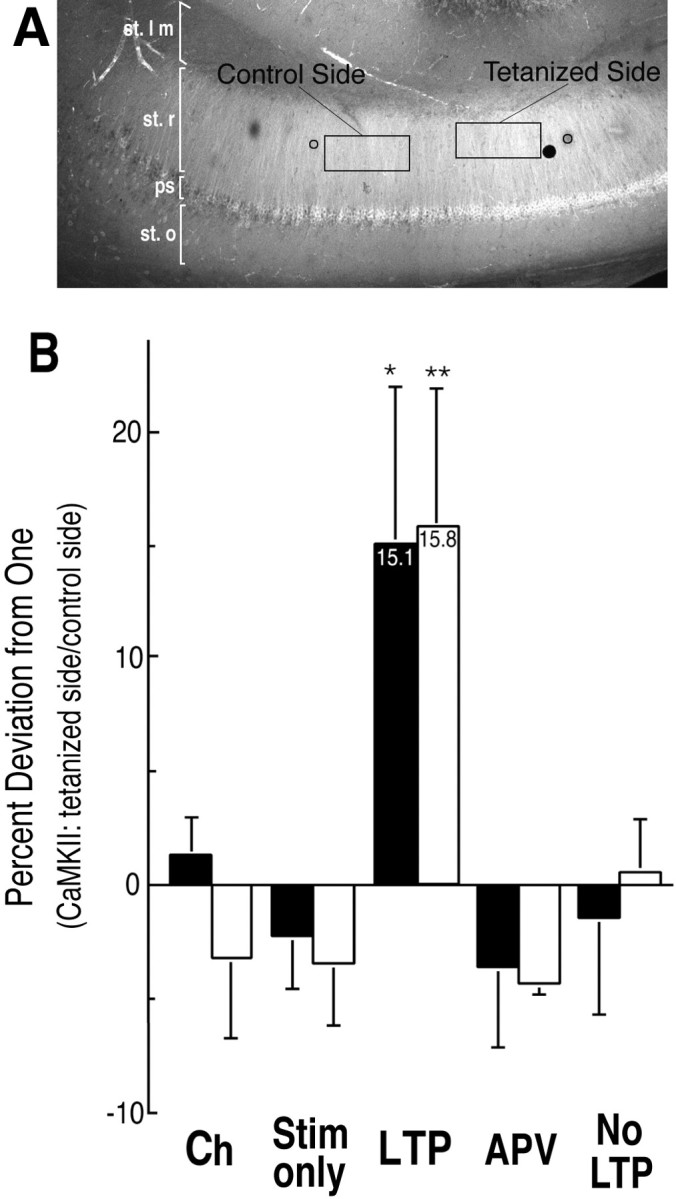
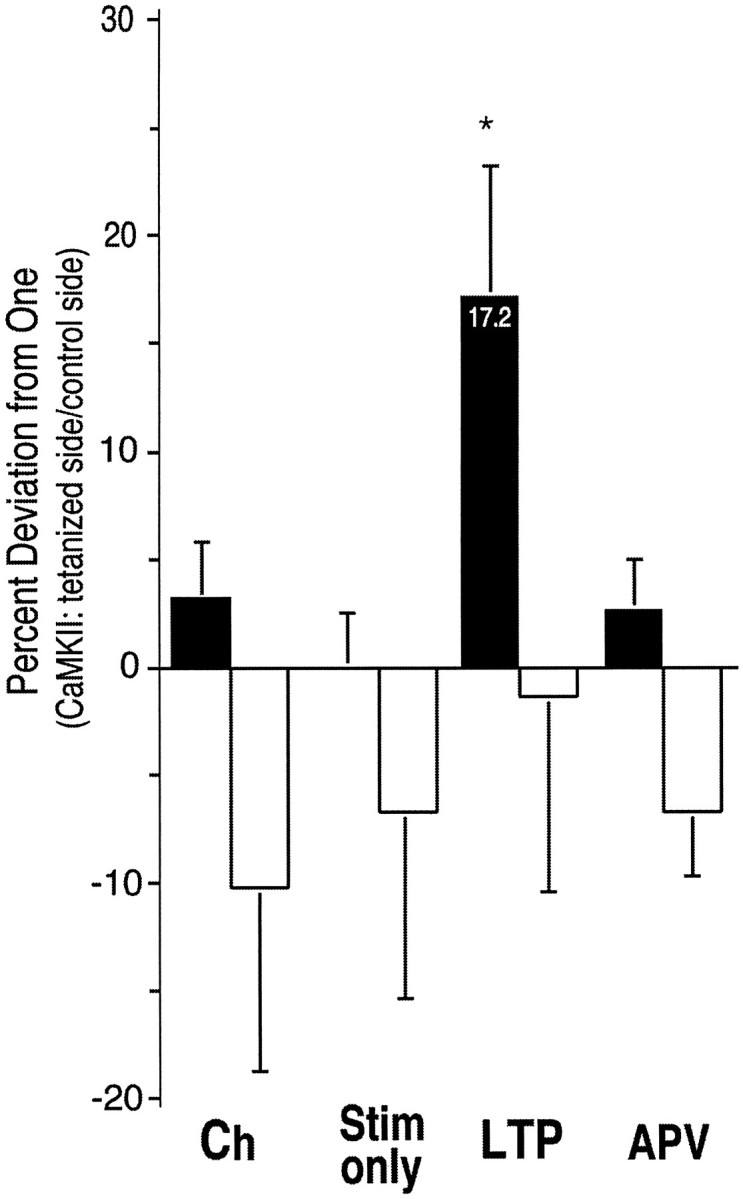
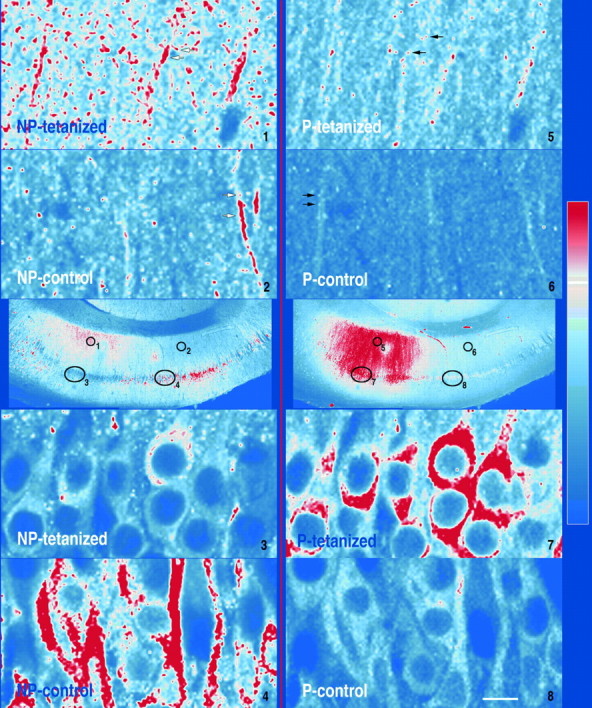
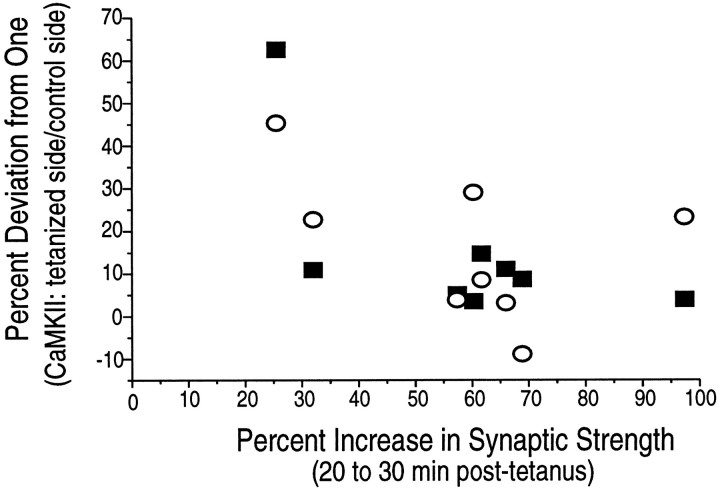
Autophosphorylation of calcium/calmodulin-dependent protein kinase II (CaMKII) at threonine-286 produces Ca2+-independent kinase activity and has been proposed to be involved in induction of long-term potentiation by tetanic stimulation in the hippocampus. We have used an immunocytochemical method to visualize and quantify the pattern of autophosphorylation of CaMKII in hippocampal slices after tetanization of the Schaffer collateral pathway. Thirty minutes after tetanic stimulation, autophosphorylated CaM kinase II (P-CaMKII) is significantly increased in area CA1 both in apical dendrites and in pyramidal cell somas. In apical dendrites, this increase is accompanied by an equally significant increase in staining for nonphosphorylated CaM kinase II. Thus, the increase in P-CaMKII appears to be secondary to an increase in the total amount of CaMKII. In neuronal somas, however, the increase in P-CaMKII is not accompanied by an increase in the total amount of CaMKII. We suggest that tetanic stimulation of the Schaffer collateral pathway may induce new synthesis of CaMKII molecules in the apical dendrites, which contain mRNA encoding its alpha-subunit. In neuronal somas, however, tetanic stimulation appears to result in long-lasting increases in P-CaMKII independent of an increase in the total amount of CaMKII. Our findings are consistent with a role for autophosphorylation of CaMKII in the induction and/or maintenance of long-term potentiation, but they indicate that the effects of tetanus on the kinase and its activity are not confined to synapses and may involve induction of new synthesis of kinase in dendrites as well as increases in the level of autophosphorylated kinase.


Figures

Fig. 1.
Fig. 1.
Arrangement of electrodes for stimulation of hippocampal slices. Two stimulating electrodes were placed ∼800 μm apart in stratum radiatum and used to stimulate different groups of axons in the Schaffer collateral pathway. Note that although each electrode stimulated distinct sets of axons, the two groups of axons usually overlap spatially as they progress through stratum radiatum, because the trajectory of axons of the Schaffer collateral pathway is quite tortuous (Ishizuka et al., 1990). A recording electrode was placed between the stimulating electrodes to record synaptic EPSPs. As described in Materials and Methods, both stimulating electrodes were used to deliver a monitoring stimulus to each pathway every 30 sec. A brief tetanic stimulation was delivered through one of the stimulating electrodes after 30 min of recording, and the monitoring stimulus was continued for an additional 30 min.
Fig. 2.
Fig. 2.
Electrophysiological recording from two slices that were subsequently analyzed for CaMKII staining. The stimulation paradigm was as described in Materials and Methods and in the legend to Figure 1. Recordings from the tetanized pathways are shown on theleft and those from corresponding control pathways are shown on the right. Tetanus was applied at the time indicated by the arrow. The tetanized pathways exhibited a 60% (DK 325) and 25.5% (ES 220) increase in synaptic strength, respectively, measured 20–30 min after tetanic stimulation. The distribution of P-CaMKII and NP-CaMKII staining in one section from ES 220 is shown in Figure3A and in one section from DK 325 is shown in Figure3C.
Fig. 3.
Fig. 3.
Staining for P-CaMKII and NP-CaMKII in sections from three tetanized slices and their corresponding chamber control slices. Tetanized slices (top images in each set) were fixed 30 min after tetanic stimulation was delivered through the stimulating electrode located on the side marked with aT. Black circles mark the approximate positions of the two stimulating electrodes. A black vmarks the approximate position of the recording electrode. Chamber control slices (bottom images) were fixed after 1 hr of superfusion alongside the tetanized slice. Sections cut from the slices were double-immunolabeled for P-CaMKII (right) and NP-CaMKII (left) as described in Materials and Methods. Each picture is a montage of two 512 × 512 images recorded by the confocal microscope through a 10× lens. The montages were converted into color according to the color look-up table depicted at theright of the figure. In sections from the tetanized slices, increased labeling of P-CaMKII is evident in the pyramidal somas and dendrites of stratum radiatum on the side that received tetanic stimulation. The elevated labeling of P-CaMKII in stratum radiatum gradually decreases with distance from the tetanizing electrode. Increased labeling for NP-CaMKII on the side of the slice that received tetanic stimulation is also evident in stratum radiatum of sections depicted in A and B.A, Fourth sections from tetanized and chamber control slices from experiment ES 220. B, Fourth sections from tetanized and chamber control slices from experiment DK 211.C, Third sections from tetanized and chamber control slices from experiment DK 325. Scale bar, 250 μm.
Fig. 4.
Fig. 4.
Quantitative analysis of the ratio of staining on the tetanized side of area CA1 to that on the control side (stratum radiatum). A, Location of ROIs for quantitative analysis of staining. Average brightness values were obtained for each section from two rectangular ROIs (50 × 100 pixels) as displayed in the figure and described in Materials and Methods. One ROI was drawn with MacPhase software on each original image between the stimulating electrode that delivered the tetanic stimulation and the recording electrode. A second ROI was drawn between the control stimulating electrode and the recording electrode. The ROIs drawn on P-CaMKII images were then transferred to the corresponding images of NP-CaMKII. The illustration shows the positions of the ROIs for the third section of the tetanized slice from experiment DK 211.Black circles indicate the approximate positions of the stimulating electrodes. The large black dot is a piece of debris on the slide that was excluded from the ROI.B, Percent deviation from 1.0 of the ratio of staining on tetanized side of slice to staining on control side of slice (stratum radiatum). The data from Table 1 are plotted as percent deviation from 1.0 of the ratio between staining on the tetanized side and staining on the control side. ANOVA indicated that the four control groups were not significantly different from each other. Statistical comparison of staining for both P-CaMKII and NP-CaMKII in the LTP group with each of the controls by t test revealed that the percent deviation of the LTP group was significantly higher than for each of the controls. Ch, Chamber only; Stim only, stimulation only; LTP, tetanized with LTP;APV, tetanized with APV; No LTP, tetanized but no LTP (*p < 0.05 for LTP versus Ch, Stim only, APV, and No LTP; **p < 0.02 for LTP versus Ch, Stim only, APV, and No LTP.
Fig. 5.
Fig. 5.
Percent deviation from 1.0 of the ratio of staining on tetanized side of slice to staining on control side of slice (CA1 pyramidal somas). The data from Table 2 are plotted as percent deviation from 1.0 of the ratio between staining on the tetanized side and staining on the control side. ANOVA indicated that the three control groups were not significantly different from each other. Staining for NP-CaMKII in the LTP group also did not differ significantly from the controls. Statistical comparison of staining for P-CaMKII in the LTP group with each of the controls by ttest revealed that the percent deviation of the LTP group was significantly higher than that for each of the controls. Abbreviations are as in Figure 4; *p < 0.03 for LTP versus Ch, Stim only, and APV, respectively.
Fig. 6.
Fig. 6.
High-resolution images from a tetanized section stained for P-CaMKII and NP-CaMKII. Images were recorded with a 40× lens (1.3 NA) from several areas of section 5 from the tetanized slice in experiment ES 220. The approximate locations of the high-resolution images are marked with black ovals andnumbers on the reference image (10× lens) in the center of the figure. NP-CaMKII staining is shown on the left; P-CaMKII staining is shown on the right. Black arrows indicate brightest staining for P-CaMKII in the dendrites on both the tetanized and the control sides of the slice at small spots with the approximate dimensions of synaptic spines.White arrows indicate brightest staining for NP-CaMKII in sections of dendritic shafts and in small spots with the approximate dimensions of synaptic spines. Scale bars: high-resolution images, 10 μm; reference images, 250 μm.
Fig. 7.
Fig. 7.
The size of LTP is not correlated with the magnitude of the ratio of CaMKII staining on the tetanized side to that on the control side. The graph is a scatterplot from experiments in which tetanic stimulation produced LTP. The magnitude of LTP is represented on the x-axis, and the percent deviation from 1.0 in the ratio of CaMKII staining is represented on the y-axis (see Table 1). There is no clear relationship between the magnitude of synaptic potentiation observed at the recording electrode site and the percent deviation from 1.0 in either P-CaMKII or NP-CaMKII staining. Solid squares indicate P-CaMKII; open circles, NP-CaMKII.

References

    1. Abraham WC, Bear MF. Metaplasticity—the plasticity of synaptic plasticity. Trends Neurosci. 1996;19:126–130. - PubMed
    1. Apperson ML, Moon I-S, Kennedy MB. Characterization of densin-180, a new brain-specific synaptic protein of the O-sialogly-coprotein family. J Neurosci. 1996;16:6839–6852. - PMC - PubMed
    1. Bear MF. Mechanism for a sliding synaptic modification threshold. Neuron. 1995;15:1–4. - PubMed
    1. Benfenati F, Valtorta F, Rubenstein JL, Gorelick FS, Greengard P, Czernik AJ. Synaptic vesicle-associated C2+/calmodulin-dependent protein kinase II is a binding-protein for synapsin I. Nature. 1992;359:417–420. - PubMed
    1. Bennett MK, Erondu NE, Kennedy MB. Purification and characterization of a calmodulin-dependent protein kinase that is highly concentrated in brain. J Biol Chem. 1983;258:12735–12744. - PubMed

Publication types

MeSH terms

Substances

LinkOut - more resources