. 1997 Jul;23(3):351-67.
doi: 10.1037//0097-7403.23.3.351.

Models of ratio schedule performance

Affiliations

Models of ratio schedule performance

L A Bizo et al. J Exp Psychol Anim Behav Process. 1997 Jul.

Abstract

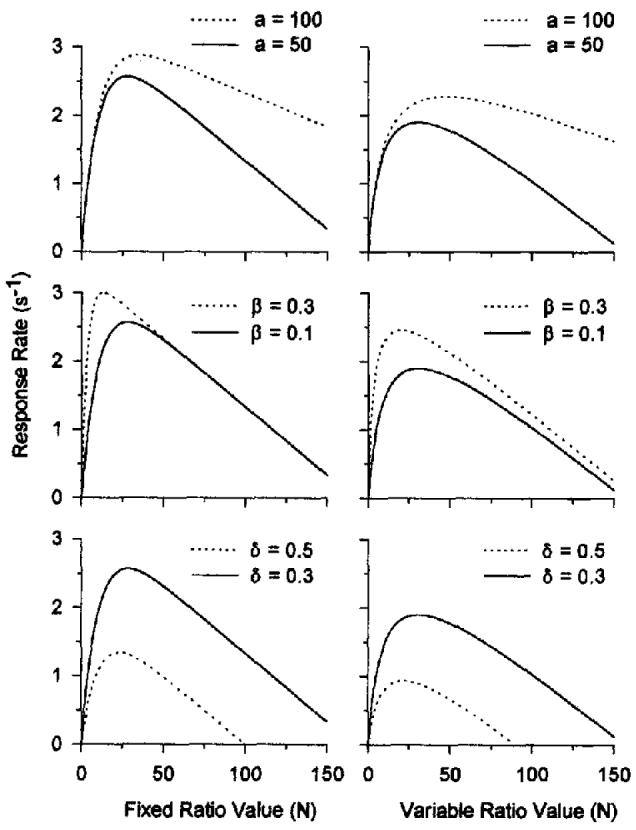
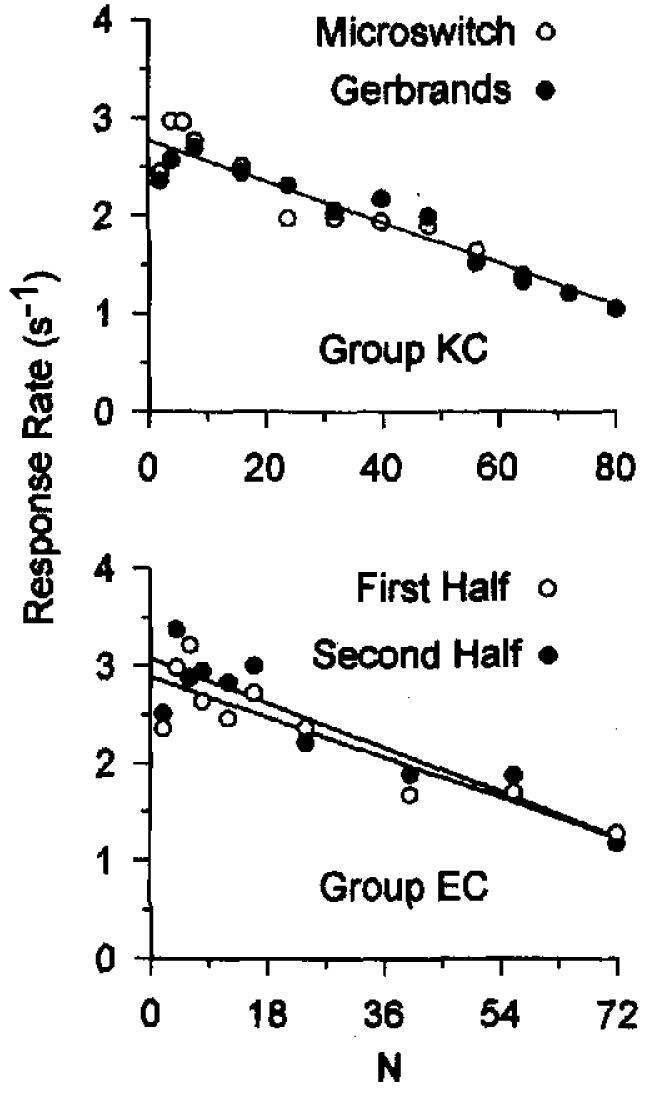
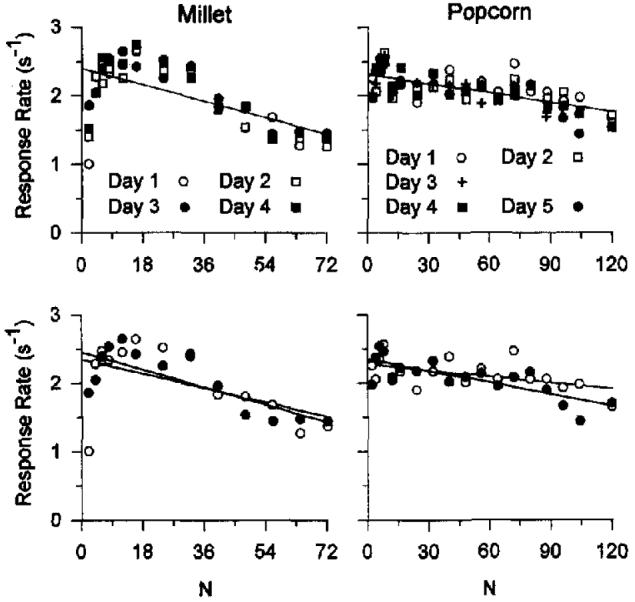
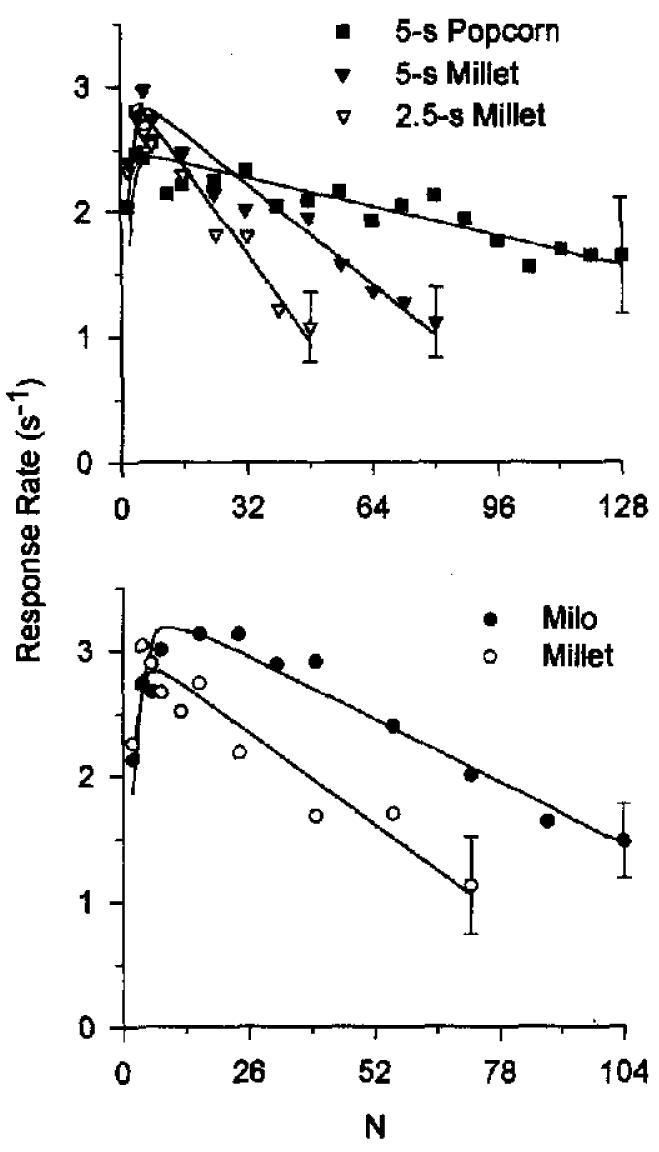
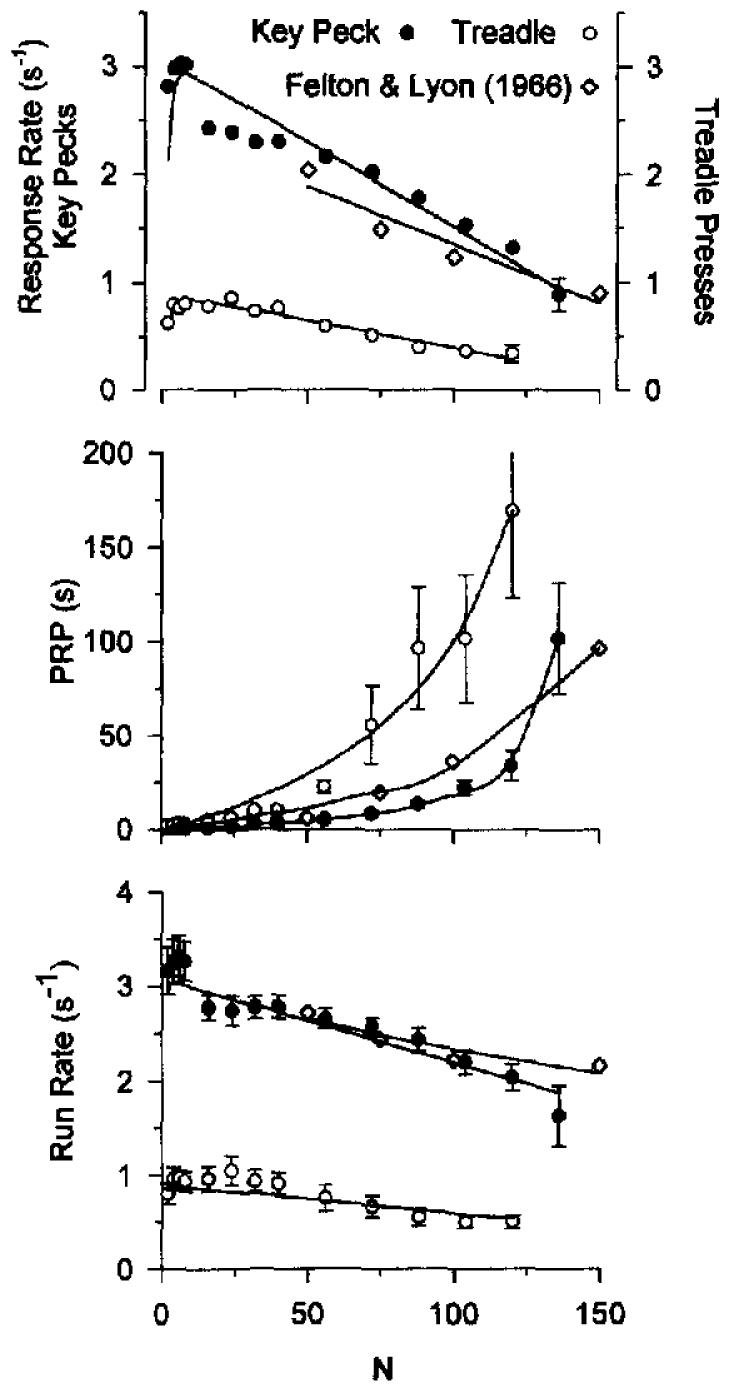
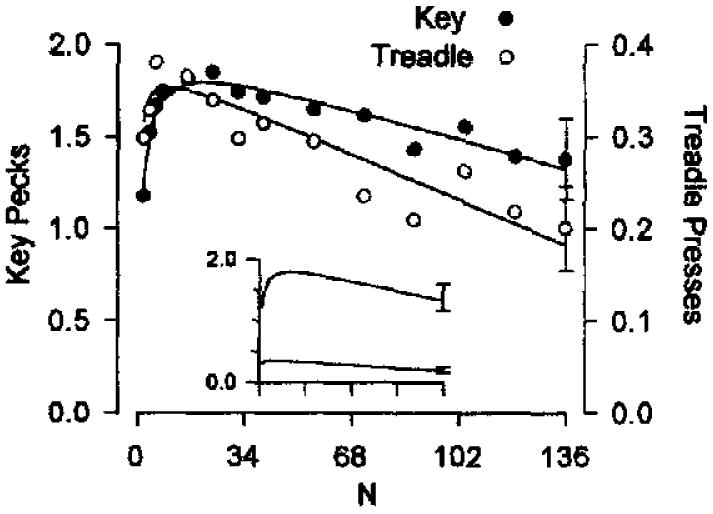
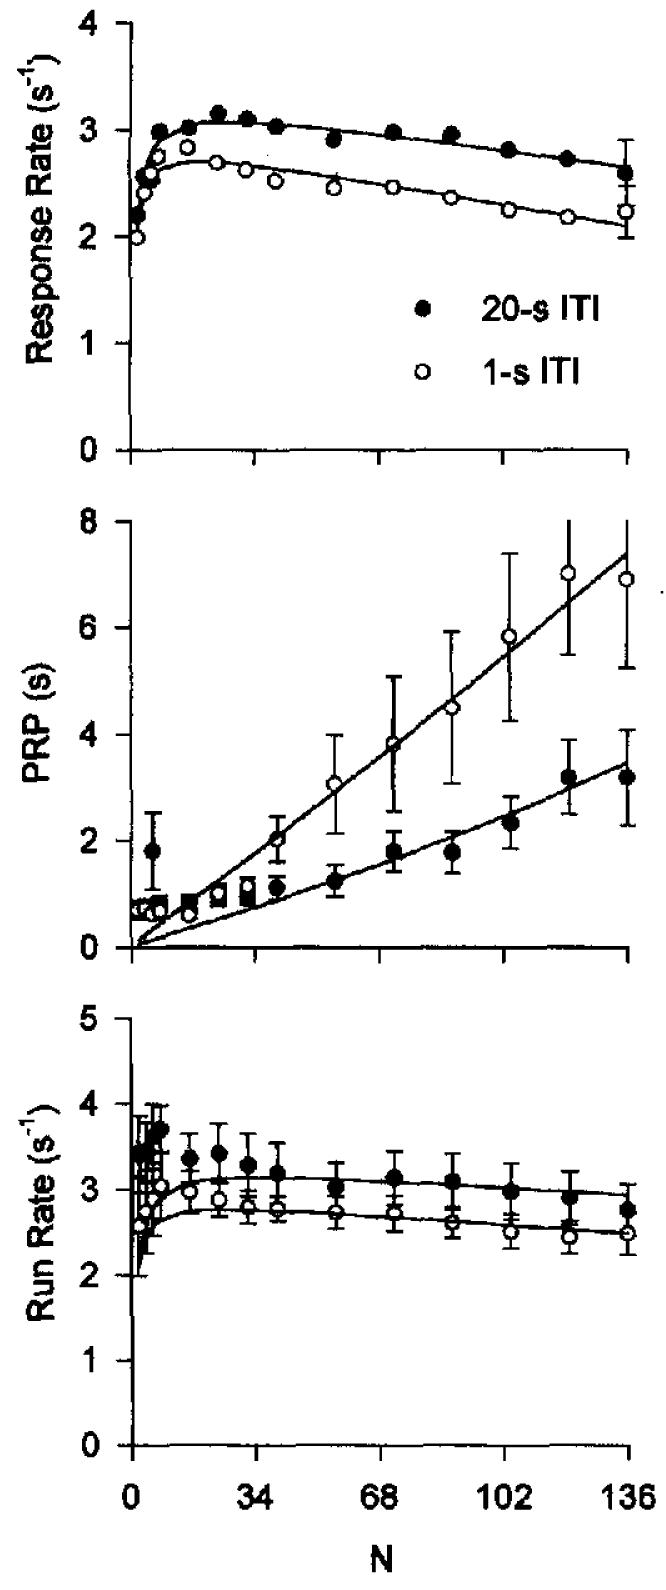
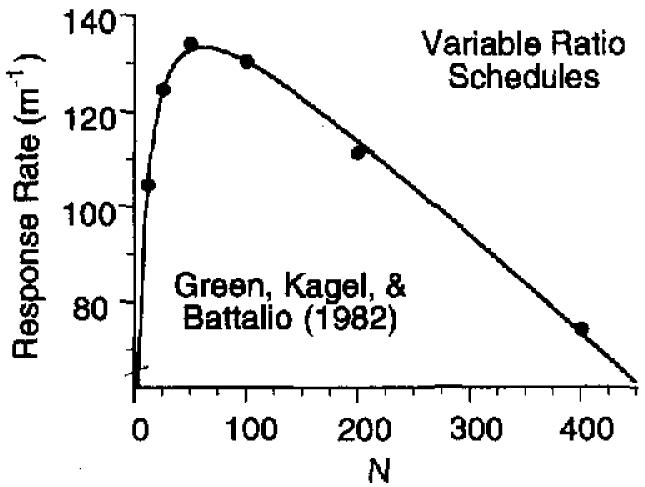
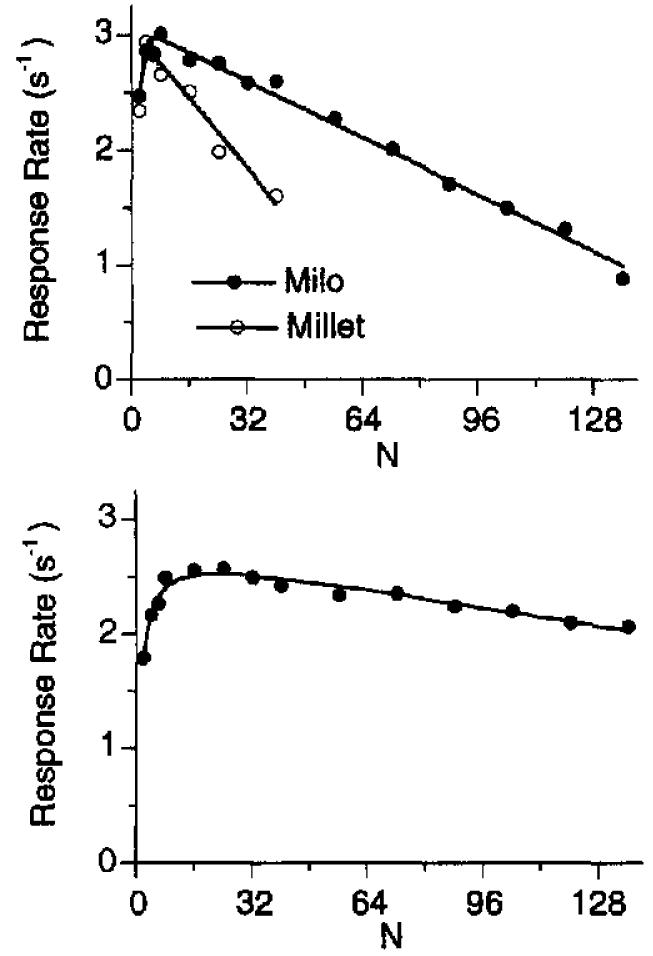
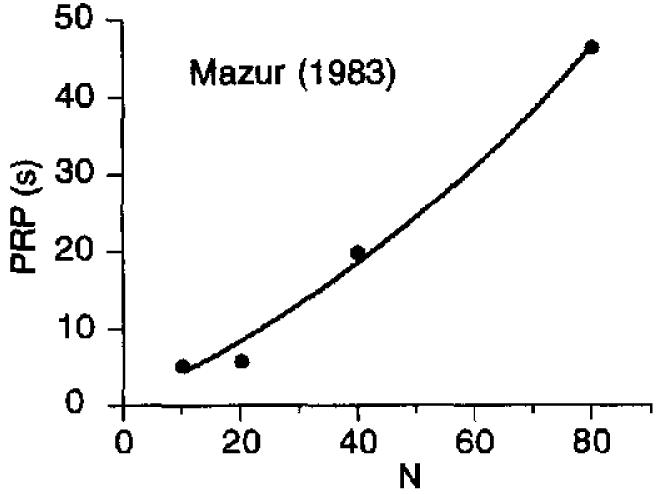
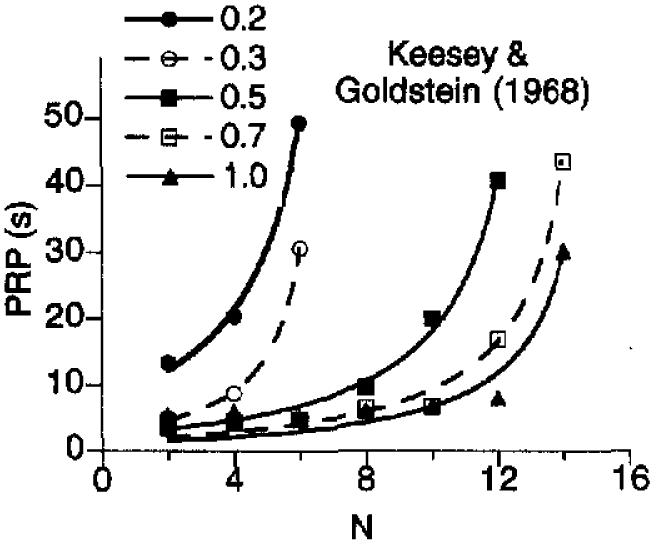
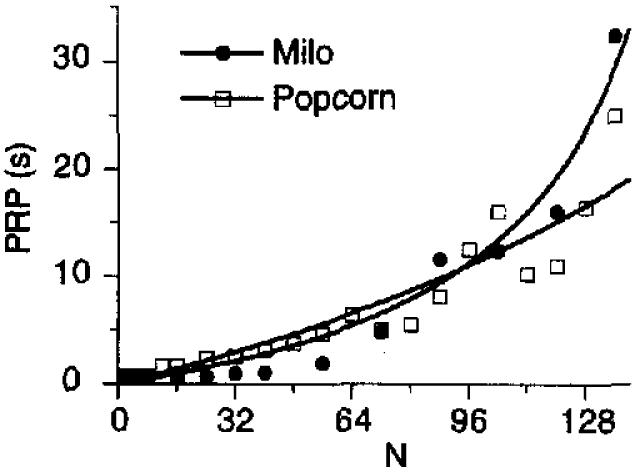
Predictions of P. R. Killeen's (1994) mathematical principles of reinforcement were tested for responding on ratio reinforcement schedules. The type of response key, the number of sessions per condition, and first vs. second half of a session had negligible effects on responding. Longer reinforcer durations and larger grain types engendered more responding, affecting primarily the parameter alpha (specific activation). Key pecking was faster than treadle pressing, affecting primarily the parameter delta (response time). Longer intertrial intervals led to higher overall response rates and shorter postreinforcement pauses and higher running rates, and ruled out some competing explanations. The treadle data required a distinction between the energetic requirements and rate-limiting properties of extended responses. The theory was extended to predict pause durations and run rates on ratio schedules.


Figures

Figure 1
Figure 1
Predicted response rates on ratio schedules given by Equation 8. The solid and dashed lines were derived from Equation 8 for fixed-ratio schedules (left panels, C given by Equation 4) and variable-ratio (VR) schedules (right panels, C given by Equation 5). The parameters of the continuous curves are a = 50, β = 0.1, and δ = 0.3. The dashed lines show the effect of a change in one of the parameters. The top panels show the effect of an increase in the specific activation a, the number of seconds of responding elicited by an incentive. The middle panels illustrate the effect of an increase in the currency parameter β (and an equivalent change in λ for VR schedules). The bottom panels illustrate the effect of an increase in the response duration δ.
Figure 2
Figure 2
Single-session response rates from Experiment 1, averaged across pigeons and displayed as a function of fixed-ratio value. The top panel shows response rate for Birds 3, 5, 14, and 15 recorded using a microswitch (circles) or a Gerbrands (disks) key. The bottom panel shows the different functions obtained from the first half of a session alone versus the second half of a session alone. The 95% confidence intervals for the regressions within each panel overlap.
Figure 3
Figure 3
Right column: Response rates for Sessions 1–4 from Experiment 1, averaged across pigeons and displayed as a function of fixed-ratio (FR) values (top panel), with the data from Sessions 1–4 compared directly (bottom panel). Left column: Response rates for the Sessions 1–5 from Experiment 2, averaged across pigeons and displayed as a function of FR values (top panel), with the data from Sessions 1–4 redisplayed in the bottom panel. The 95% confidence intervals for the regressions within each panel overlap.
Figure 4
Figure 4
Single-session response rates from Experiment 2, averaged across 4 pigeons (and across replications of Condition 2 for Bird 3). The top panel shows data for Birds 3, 5, 14, and 15. The bottom panel shows data for Birds 54, 55, 56, and 57. The curves are drawn by Equation 8 (parameters are listed in Table 1). The standard error was similar over all fixed-ratio values, and its average is shown by the error bars on the right-most points.
Figure 5
Figure 5
Single-session response rates from Experiment 3, averaged across 8 pigeons. The top panel shows overall response rates for treadle pressing (circles) and key pecking (disks) plotted against fixed-ratio (FR) value. The curves are drawn by Equation 8 (parameters are listed in Table 1). The middle and bottom panels show mean postreinforcement pause (PRP) and mean run rate (excluding PRP) plotted as a function of FR value. The theoretical curves through these data are given by Equations 11 and 12. The mean standard error is shown on the last data point for each condition in the top panel and for all conditions in the other panels.
Figure 6
Figure 6
Single-session response rates from Experiment 4, averaged across 8 pigeons. The figure shows overall response rates for treadle pressing (circles) and key pecking (disks) plotted against variable-ratio (VR) value. The curves are drawn by Equation 8 (parameters are listed in Table 2). It should be noted that the axes are normalized; the insert shows the lay of the data on standard coordinates. The standard error was similar over all VR values, and its average is shown by the error bars on the right-most points.
Figure 7
Figure 7
Single-session response rates from Experiment 5, averaged across 8 pigeons. The top panel shows overall response rates for the 1-s intertrial interval (ITI; circles) and for the 20-s ITI (disks) plotted against variable-ratio (VR) value. The curves are drawn by Equation 8 (parameters are listed in Table 2). The middle and bottom panels show mean postreinforcement pause (PRP) and mean running rate (excluding PRP) plotted as a function of VR value. The mean standard error is shown on the last data point for each condition in the top panel and for all conditions in the other panels. The curves through the PRP data are drawn by Equation 11, and those through the run rate data by Equation 12.
Figure 8
Figure 8
Variable-ratio response rates from 4 pigeons collected by Green, Kagel, & Battalio (1982). The parameters of Equation 8 are λ = 0.44 (β = .36), δ = 0.37, and a = 282.
Figure 9
Figure 9
Top panel: Average fixed-ratio response rates from Experiments 2 and 3. Bottom panel: Average variable-ratio response rates from Experiments 4 and 5. Parameters of Equation 8 are given in Table 3.
Figure 10
Figure 10
Pause durations of rats exposed to various fixed-ratio schedules. The data are from Mazur (1983); Equation 11 draws the curve. PRP = postreinforcement pause.
Figure 11
Figure 11
Pause durations of a rat exposed to progressive ratio schedules. The data are averages of 25 trials, collected by Keesey and Goldstein (1968). The reinforcer was 0.5-s stimulation with a pulse train of 50 pulses, each lasting for 0.2 ms. The current in mA is the parameter in the legend. Equation 11 draws the curves. PRP = postreinforcement pause.
Figure 12
Figure 12
Pause durations of pigeons exposed to various fixed-ratio schedules in which they earned milo or popcorn. Equation 11 draws the curve. The parameters for these curves were taken from Table 1, with the exception of k, which took the value of 0.20 for all curves. PRP = postreinforcement pause.

References

    1. Baron A, Mifcorski J, Schlund M. Reinforcement magnitude and pausing on progressive-ratio schedules. Journal ofthe Experimental Analysis of Behavior. 1992;58:377–388. - PMC - PubMed
    1. Baum WM. Performances on ratio and interval schedules of reinforcement: Data and theory. Journal of the Experimental Analysis of Behavior. 1993;59:245–264. - PMC - PubMed
    1. Beam JJ, Killeen PR, Bizo LA, Fetterman JG. Adjusting the pacemaker: The role of reinforcement context. 1997 Manuscript submitted for publication.
    1. Blakely E, ScWinger H. Determinants of pausing under variable-ratio schedules: Reinforcer magnitude, ratio size, and scheduk contiguration. Journal of the Experimental Analysis of Behavior. 1988;50:65–73. - PMC - PubMed
    1. Capehart GW, Eckerman DA, Guilkey M, Shull R. A comparison of ratio and interval reinforcement schedules with comparable interreinforcement times. Journal of the Experimental Analysis of Behavior. 1980;34:61–76. - PMC - PubMed

Publication types