. 1997 Jul 8;94(14):7263-8.
doi: 10.1073/pnas.94.14.7263.

A model of excitation and adaptation in bacterial chemotaxis

Affiliations

A model of excitation and adaptation in bacterial chemotaxis

P A Spiro et al. Proc Natl Acad Sci U S A. .

Abstract

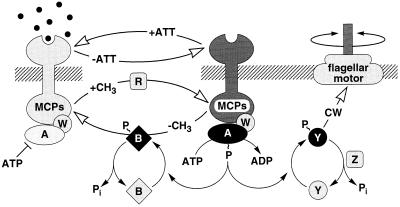
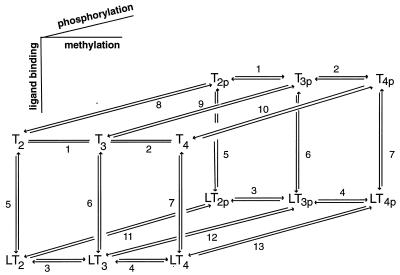
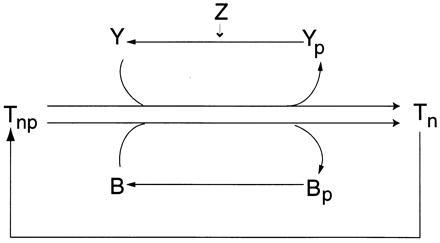
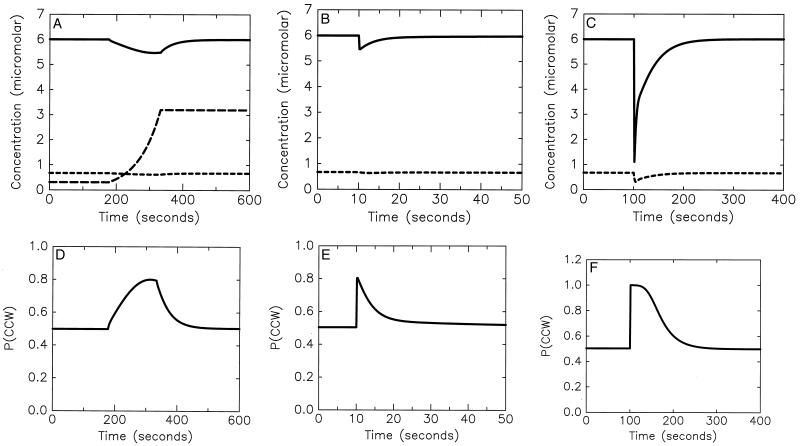
Bacterial chemotaxis is widely studied because of its accessibility and because it incorporates processes that are important in a number of sensory systems: signal transduction, excitation, adaptation, and a change in behavior, all in response to stimuli. Quantitative data on the change in behavior are available for this system, and the major biochemical steps in the signal transduction/processing pathway have been identified. We have incorporated recent biochemical data into a mathematical model that can reproduce many of the major features of the intracellular response, including the change in the level of chemotactic proteins to step and ramp stimuli such as those used in experimental protocols. The interaction of the chemotactic proteins with the motor is not modeled, but we can estimate the degree of cooperativity needed to produce the observed gain under the assumption that the chemotactic proteins interact directly with the motor proteins.


Figures

Figure 1
Figure 1
Signaling components and pathways for E. coli chemotaxis. Chemoreceptors (MCPs) span the cytoplasmic membrane (hatched lines), with a ligand-binding domain deployed on the periplasmic side and a signaling domain on the cytoplasmic side. The cytoplasmic Che signaling proteins are identified by single letters—e.g., A = CheA. MCPs form stable ternary complexes with the CheA and CheW proteins to generate signals that control the direction of rotation of the flagellar motors. The signaling currency is in the form of phosphoryl groups (∼P), made available to the CheY and CheB effector proteins through autophosphorylation of CheA. CheYp initiates flagellar responses by interacting with the motor to enhance the probability of clockwise rotation. CheBp is part of a sensory adaptation circuit that terminates motor responses. MCP complexes have two alternative signaling states. In the attractant-bound form, the receptor inhibits CheA autokinase activity; in the unliganded form, the receptor stimulates CheA activity. The overall flux of phosphoryl groups to CheB and CheY reflects the proportion of signaling complexes in the inhibited and stimulated states. Changes in attractant concentration shift this distribution, triggering a flagellar response. The ensuing changes in CheB phosphorylation state alter its methylesterase activity, producing a net change in MCP methylation state that cancels the stimulus signal (see ref. for a review).
Figure 2
Figure 2
The ligand-binding, phosphorylation, and methylation reactions of the Tar–CheA–CheW complex, denoted by T. LT indicates a ligand-bound complex. Vertical transitions involve ligand binding and release, horizontal transitions involve methylation and demethylation, and front-to-rear transitions involve phosphorylation and the reverse involve dephosphorylation. The details of the phosphotransfer steps are depicted in Fig. 3. Numerical subscripts indicate the number of methylated sites on Tar, and a subscript p indicates that CheA is phosphorylated. The rates for the labeled reaction pairs are given in Table 3.
Figure 3
Figure 3
Detail of the phosphotransfer reactions corresponding to the labels 8–13 in Fig. 2.
Figure 4
Figure 4
Response of the system depicted in Fig. 2 to various chemoattractant (aspartate) stimulus protocols: a ramp of rate 0.015 s−1 (Left), a step at t = 10 s from zero concentration to a concentration (0.11 μM) that is 11% of the Kd for ligand binding (Center), and a step at t = 100 s from zero concentration to a concentration (1 mM) that is 1,000 times the Kd for ligand binding (Right). Time series in the top row of figures are for Che Yp (solid line), CheBp (short dashes), and aspartate (long dashes). The concentrations and rates used are listed and compared to measured values in Tables 2 and 3. The maximum change in [Che Yp] from baseline for both the ramp and small step responses is 9%. Time series in the bottom row are the corresponding bias responses, using a Hill coefficient of 11 for binding of both Che Yp and the competitive inhibitor Che Y to the motor. (Compare the left trace to figure 4A in ref. ; the center trace to figure 4 in ref. , figure 2 in ref. , and figure 8 in ref. ; and the right trace to figure 8 in ref..

Similar articles

Cited by

References

    1. Berg H C. Cold Spring Harbor Symp Quant Biol. 1990;55:539–545. - PubMed
    1. Block S M, Segall J E, Berg H C. Cell. 1982;31:215–226. - PubMed
    1. Stock J B. In: Regulation of Cellular Signal Transduction Pathways by Desensitization and Amplification. Sibley D R, Houslay M D, editors. New York: Wiley; 1994. pp. 3–24.
    1. Stock J B, Surette M G. Escherichia coli and Salmonella: Cellular and Molecular Biology. Washington, DC: Am. Soc. Microbiol.; 1996.
    1. Bourret R B, Borkovich K A, Simon M I. Annu Rev Biochem. 1991;60:401–441. - PubMed

Publication types

LinkOut - more resources