. 1997 Jul 8;94(14):7269-74.
doi: 10.1073/pnas.94.14.7269.

HLA class I and II antigens are partially co-clustered in the plasma membrane of human lymphoblastoid cells

Affiliations

HLA class I and II antigens are partially co-clustered in the plasma membrane of human lymphoblastoid cells

A Jenei et al. Proc Natl Acad Sci U S A. .

Abstract

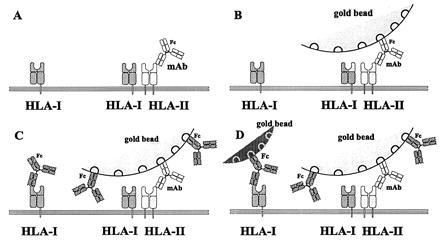
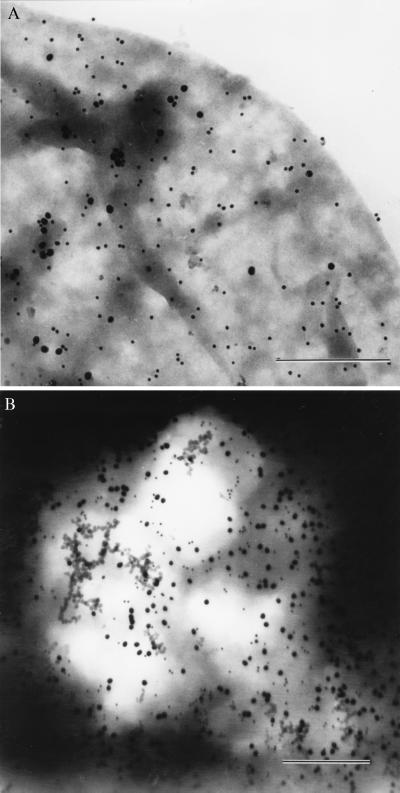
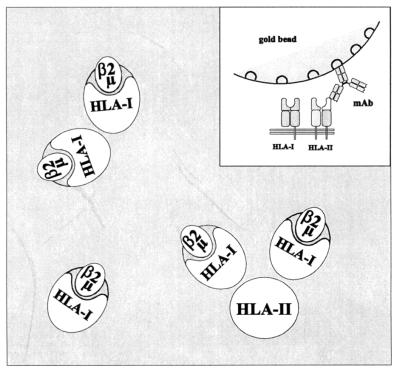
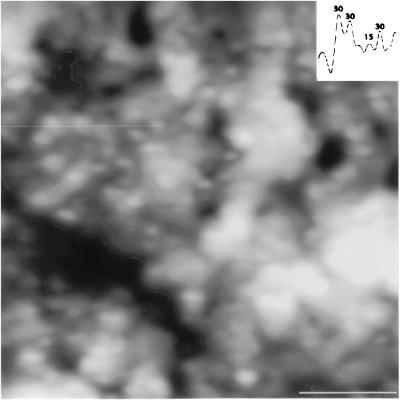
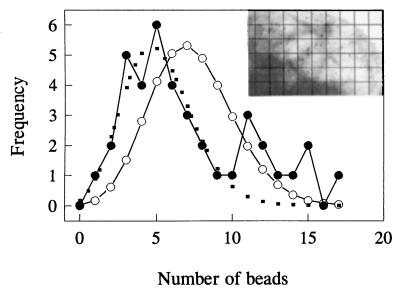
Major histocompatibility complex (MHC) class II molecules displayed clustered patterns at the surfaces of T (HUT-102B2) and B (JY) lymphoma cells characterized by interreceptor distances in the micrometer range as detected by scanning force microscopy of immunogold-labeled antigens. Electron microscopy revealed that a fraction of the MHC class II molecules was also heteroclustered with MHC class I antigens at the same hierarchical level as described by the scanning force microscopy data, after specifically and sequentially labeling the antigens with 30- and 15-nm immunogold beads. On JY cells the estimated fraction of co-clustered HLA II was 0.61, whereas that of the HLA I was 0.24. Clusterization of the antigens was detected by the deviation of their spatial distribution from the Poissonian distribution representing the random case. Fluorescence resonance energy transfer measurements also confirmed partial co-clustering of the HLA class I and II molecules at another hierarchical level characterized by the 2- to 10-nm Förster distance range and providing fine details of the molecular organization of receptors. The larger-scale topological organization of the MHC class I and II antigens may reflect underlying membrane lipid domains and may fulfill significant functions in cell-to-cell contacts and signal transduction.


Figures

Figure 1
Figure 1
Schematic view of the steps of sequential labeling of the cell surface elements. (A) First specific labeling against antigens (HLA II) with mAb. (B) Larger gold beads attached to the Fc part of the antibody. (C) Second specific labeling of antigens (HLA I). These mAbs also cover the free binding sites of the gold beads. (D) Smaller size gold beads bind the Fc part of the second antibody.
Figure 2
Figure 2
TEM images of immunogold labeled JY cells. Labeling was done first with 30-nm gold beads against MHC class II followed by 15-nm gold particles against class I molecules (A). The same labeling procedure was applied in reversed order (B). (Bars = 500 nm.)
Figure 3
Figure 3
Two-dimensional schematic model of the proximity relationships among HLA class I and class II molecules on the surface of JY cells as predicted by the fluorescence energy transfer data of Table 2. The complexes shown indicate a possible topographical arrangement of the receptors. (Inset) Schematic vertical model of immunogold bead attachment to the HLA class II. The bead covers the co-clustered class I molecule(s) as predicted by energy transfer using site-specific labels. The quantity of the heteroclusters shown on the picture is calculated as BA in the equations.
Figure 4
Figure 4
High-resolution SFM image of the membrane surface of an air dried, immunogold labeled JY cell. The picture shows a 2 μm × 2 μm area. Sequential labeling of the HLA class II and class I molecules was done by 30- and 15-nm immunogold particles, respectively. (Inset) Direct height (z) measurement of the immunogold beads. The measured z values along the indicated trajectory (thin horizontal line, upper left quarter) clearly demonstrate the presence of the two distinct gold bead sizes on the surface of the cell. (Bar = 500 nm.)
Figure 5
Figure 5
Analysis of the nonrandom spatial distribution of immunogold labeled antigens on the surface of a JY cell. •, The measured distribution of beads among the unit cells of the grid; ○, the expected Poissonian distribution calculated using the theoretical mean. The dotted line represents the best Poissonian fit. Note the significant deviations at the right side of the curve, meaning nonstochastic spatial distributions of the clusters. (Inset) Selected area of the membrane surface of the cell used for the analysis showing the characteristic distribution of the immunogold particles. The lines indicate a possible grid layout for the analysis.

References

    1. Feder T J, Brust-Mascher I, Slattery J P, Baird B, Webb W W. Biophys J. 1996;70:2767–2773. - PMC - PubMed
    1. Singer S J, Nicolson G L. Science. 1972;175:720–731. - PubMed
    1. Bene L, Balázs M, Matkó J, Möst J, Dierich M, Szöllősi J, Damjanovich S. Eur J Immunol. 1994;24:2115–2123. - PubMed
    1. Angelisova P, Hilgert I, Horejsi V. Immunogenetics. 1994;39:249–256. - PubMed
    1. Clegg R M. Curr Opin Biotechnol. 1995;6:103–110. - PubMed

Publication types

MeSH terms

Substances