. 1997 Jul 8;94(14):7394-9.
doi: 10.1073/pnas.94.14.7394.

Transcriptional abnormality in myotonic dystrophy affects DMPK but not neighboring genes

Affiliations

Transcriptional abnormality in myotonic dystrophy affects DMPK but not neighboring genes

M G Hamshere et al. Proc Natl Acad Sci U S A. .

Abstract

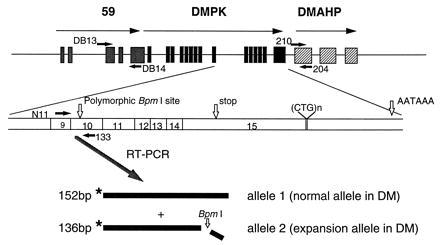
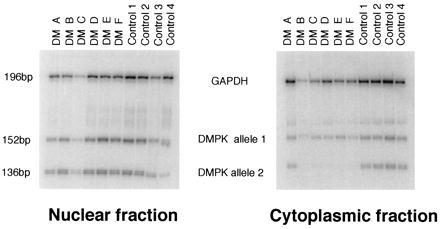
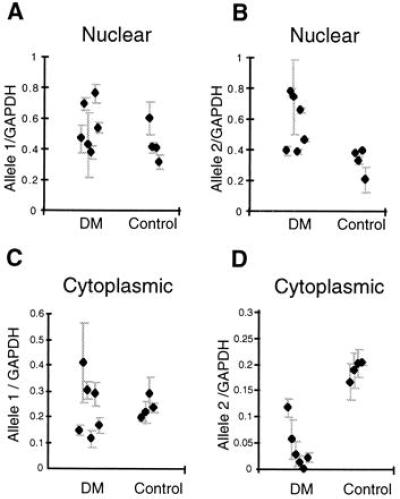
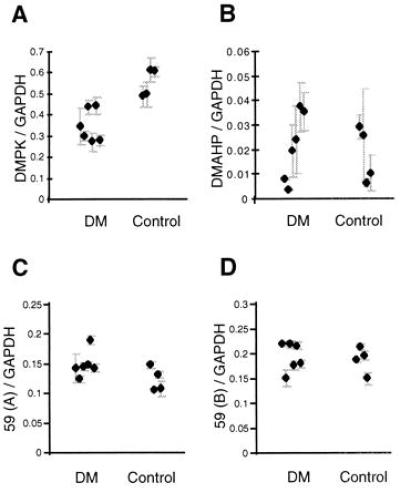
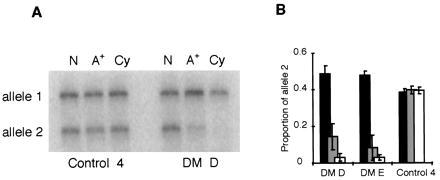
Myotonic dystrophy (DM) is caused by the expansion of a trinucleotide repeat, CTG, in the 3' untranslated region of a protein kinase gene, DMPK. We set out to determine what effect this expanded repeat has on RNA processing. The subcellular fractionation of RNA and the separate analysis of DMPK transcripts from each allele reveals that transcripts from expanded DMPK alleles are retained within the nucleus and are absent from the cytoplasm of DM cell lines. The nuclear retention of DMPK transcripts occurs above a critical threshold between 80 and 400 CTGs. Further analysis of the nuclear RNA reveals an apparent reduction in the proportion of expansion-derived DMPK transcripts after poly(A)+ selection. Quantitative analysis of RNA also indicates that although the level of cytoplasmic DMPK transcript is altered in DM patients, the levels of transcripts from 59 and DMAHP, two genes that immediately flank DMPK, are unaffected in DM cell lines.


Figures

Figure 1
Figure 1
The exon/intron organization of genes surrounding the DM-associated triplet. Gray boxes depict gene 59, black boxes DMPK, and the hatched boxes the putative exons of DMAHP. The transcriptional orientation is indicated with arrows. The positions of the polymorphic BpmI recognition site in exon 10 of DMPK, the stop codon, the (CTG)n repeat, and the polyadenylylation signal are shown in relation to the DMPK transcript. The positions of the oligonucleotide primers are indicated by short black arrows. The two isoforms of DMPK are indicated as allele 1 and allele 2.
Figure 2
Figure 2
Multiplex RT-PCR analysis of DMPK transcripts compared with those for GAPDH. The phosphor image shows RT-PCR products of DMPK allele 1 and allele 2 in the nuclear and cytoplasmic fractions. Bands were visualized by overnight exposure to a PhosphorImager screen. After scanning, the image range was set at 1.0–255.
Figure 3
Figure 3
Analysis of multiplex RT-PCR analysis of DMPK transcripts compared with those for GAPDH. (A) Results of quantitative analysis for the levels of allele 1 of DMPK in nuclear fractions from six DM cell lines and four controls. The means and errors for replicates on each sample are shown (four replicates were produced by two independent RT reactions, which were then used as substrates for two independent PCRs). (B) Results for mean levels of DMPK allele 2 in nuclear fractions. (C) Mean levels of DMPK allele 1 in cytoplasmic fractions. (D) Levels of DMPK allele 2 in cytoplasmic fractions. All RT-PCRs were repeated using an alternative RNA control (TF11S) and were shown to give similar results (data not shown).
Figure 4
Figure 4
Quantitative analysis of cytoplasmic RNA from genes around the DM triplet expansion, corrected for input amount of RNA by comparison to levels of GAPDH. (A) The means and errors for quantitative analysis of DMPK RNA in DM and Control cell lines. (B) Quantitatve analysis for the levels of DMAHP in DM and Control cell lines. (C and D) Analysis of levels of expression from 59(A) and 59(B) respectively in DM and Control cell lines. The results have been confirmed by an alternative RT-PCR in which the control RNA was TF11S (data not shown).
Figure 5
Figure 5
Analysis of nuclear DMPK transcripts. (A) Phosphor image showing the amounts of each DMPK allele in total nuclear RNA (N), poly(A)+-selected nuclear RNA (A+), and cytoplasmic RNA (Cy) from DM patient D and control cell line 4. (B) Histogram showing the proportion of DMPK allele 2 in nuclear RNA (black bars), poly(A)+-selected nuclear RNA (gray bars), and cytoplasmic RNA (open bars) from patients DM D and DM E and a normal control.

References

    1. Harper P. Myotonic Dystrophy. London: Saunders; 1989.
    1. Brook J D, McCurrach M E, Harley H G, Buckler A J, Church D, Aburatani H, Hunter K, Stanton V P, Thirion J P, Hudson T, Sohn R, Zemelman B, Snell R G, Rundle S A, Crow S, Davies J, Shelbourne P, Buxton J, Jones C, Juvonen V, Johnson K, Harper P S, Shaw D J, Housman D E. Cell. 1992;68:799–808. - PubMed
    1. Fu Y-H, Pizzuti A, Fenwick R G, King J, Rajnarayan S, Dunne P W, Dubel J, Nasser G A, Ashizawa T, Dejong P, Wieringa B, Korneluk B, Perryman M B, Epstein H F, Caskey C T. Science. 1992;255:1256–1258. - PubMed
    1. Mahadevan M, Tsilfidis C, Sabourin L, Shutler G, Amemiya C, Jansen G, Neville C, Narang M, Barcelo J, Ohoy K, Leblond S, Earle-Macdonald J, Dejong P J, Wieringa B, Korneluk R G. Science. 1992;255:1253–1255. - PubMed
    1. Carango P, Noble J E, Marks H G, Funanage V L. Genomics. 1993;18:340–348. - PubMed

Publication types

Substances

LinkOut - more resources