

doi: 10.1073/pnas.94.14.7612.
Aggregation and disaggregation of senile plaques in Alzheimer disease
Affiliations
- PMID: 9207140
- PMCID: PMC23870
- DOI: 10.1073/pnas.94.14.7612
Item in Clipboard
Aggregation and disaggregation of senile plaques in Alzheimer disease
Proc Natl Acad Sci U S A.
.
Abstract
We quantitatively analyzed, using laser scanning confocal microscopy, the three-dimensional structure of individual senile plaques in Alzheimer disease. We carried out the quantitative analysis using statistical methods to gain insights about the processes that govern Abeta peptide deposition. Our results show that plaques are complex porous structures with characteristic pore sizes. We interpret plaque morphology in the context of a new dynamical model based on competing aggregation and disaggregation processes in kinetic steady-state equilibrium with an additional diffusion process allowing Abeta deposits to diffuse over the surface of plaques.
Figures
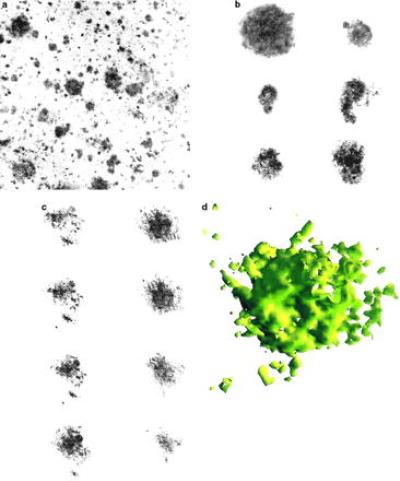
(a) Photomicrograph from a Bio-Rad 1024 confocal microscope of a section of cerebral tissue of dimensions 600 × 600 μm in area, displaying plaque aggregates as dark regions. Immunofluorescence used anti-Aβ mAb 10D5 on 50-μm thick frozen sections as described (17). Immunoreactivity was visualized using a Cy-5-labeled secondary antibody (Jackson ImmunoResearch) to overcome potential problems due to tissue autofluorescence. Qualitative analysis of the figure shows that the Aβ aggregates are of roughly spherical shape. Quantitative analysis shows that the size distributions are peaked around a characteristic size. (b) Typical plaques and (c) consecutive cross-sections of an individual plaque, as observed under a confocal microscope, are shown. (d) Three-dimensional reconstruction of an SP (of diameter ≈60 μm) from 18 images (×100 oil immersion objective) separated by 0.3 μm. Each cross-sectional image represents the average of three scans combined with a Kalman filter. All images were obtained from the multimodal superior temporal sulcus neocortex of six Alzheimer cases from the Massachusetts Alzheimer Disease Research Center Brain Bank.
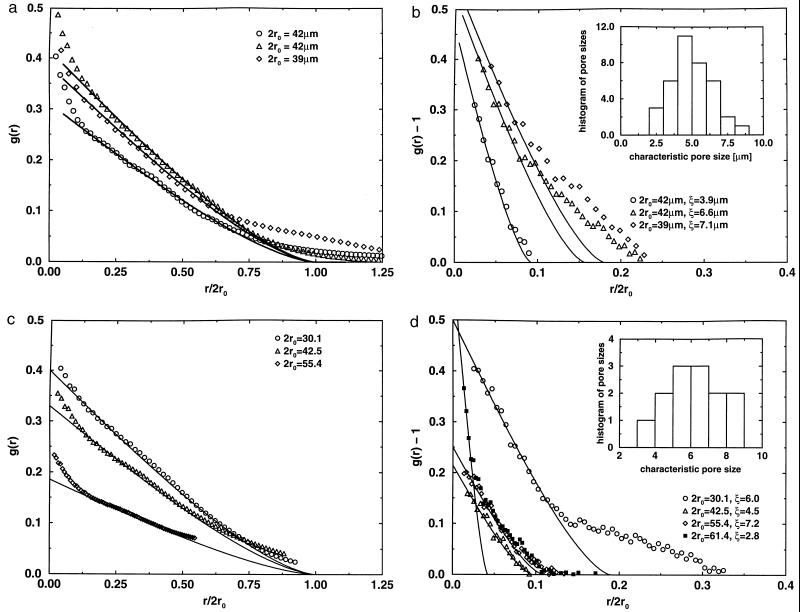
Correlation functions calculated for the cross-sections of over 500 images representing 37 plaques from the superficial layers of the superior temporal sulcus cortex in tissue of Alzheimer brain (a and b) and for the cross-sections of computer-simulated model plaques (c and d). Plaques from tissue were not selected to represent any morphological subtype. In fact, it is difficult to categorize with certainty the three-dimensional confocal images of Aβ deposits into “classic,” “cored,” or “primitive” plaques. In a, the calculation considers the plaque and its surroundings. In b, only the interior region of a plaque is considered in the correlation function calculation. Our choice of normalization in the correlation function is such that, as r → ∞, the correlation function tends to the normalized density of the system [g(∞) = 0 in a and = 1 in b]. The parameter ro for each graph indicates the characteristic radius of the entire plaque and is obtained from the solid disk fit. The characteristic size, ξ, of the porosity inside plaques is obtained from the x-axis intercept of the small-r fits to a solid disk of g(r) calculated as in b. The fit is carried out exclusively over the small-r region because we were interested in the smallest homogeneous structure inside the plaque. The Inset in b shows a histogram of pore sizes from plaques that peaks at ≈5 μm (much larger than the resolution of the images). (c) Correlation function for the computer-simulated model plaques taking into account the model plaque with the surroundings and (d) taking into account only the interior of the model plaque. In both c and d, the solid lines are fits to a correlation function of a solid disk. The Inset in d shows a histogram of pore sizes in cross-sections of 13 different model plaques of different diameters. The histogram shows a peak at a characteristic pore size of ≈6 pixels. The curve in d with the black squares is the interior correlation function for the model plaque without surface relaxation (top of Fig. 2b), giving a considerably smaller value than that for the model with surface relaxation.
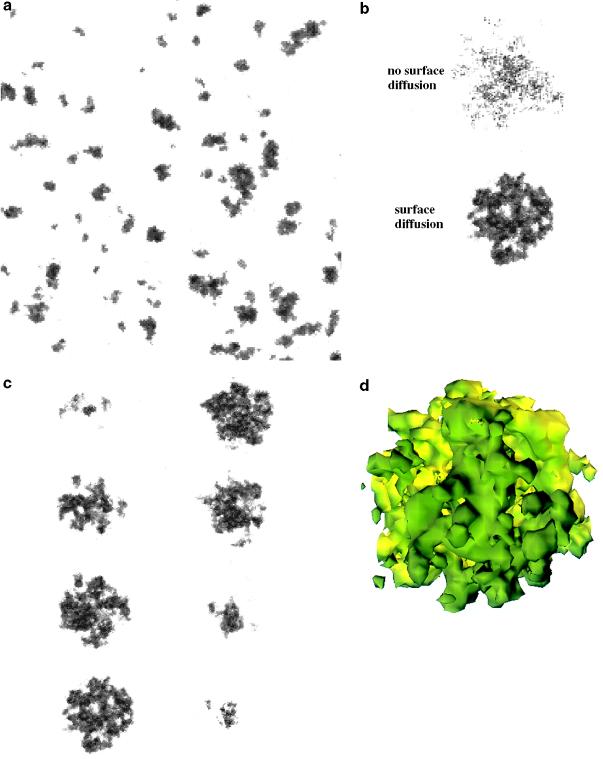
The dynamical model is defined on a discrete three-dimensional lattice with lattice sites that can be either empty or occupied. At each time step in the simulation, each occupied site either grows with probability Pg or is cleared with probability Pc. Depending on the relative values, a system may be predisposed to create plaques or to dissolve them. Nearest neighbor rules are incorporated such that aggregation at a site is more likely if its neighboring sites are empty and less likely if they are occupied. On the other hand, an occupied site is more likely to be dissolved as the number of empty nearest sites increases. These rules follow from considering that, in real SP, the more exposed sites have a greater probability of being surrounded by Aβ. At the same time, these exposed sites are more likely to be disaggregated by external agents. To avoid the final state in which either all sites are occupied or empty (inevitable under the given rules), it is necessary to incorporate a dynamic feedback that allows the system to evolve into a steady state characterized by a burden that is, on average, conserved in time. The feedback modifies Pc by an amount that is proportional to the rate of change in the total burden. In addition, the model allows for a diffusion of aggregated particles on the model plaque. This diffusion permits a given occupied site to explore its immediate neighborhood and choose to change its position only if it ends up surrounded by more neighboring sites. This selective diffusive process allows for the system to relax so that the overall surface is smooth. In a, a cross-section of a system defined on a three-dimensional lattice of the size 400 × 400 × 20 after 500 time steps. The initial configuration corresponds to randomly scattered seeds covering 2% of the lattice sites. The initial values of the disaggregation and aggregation probabilities are Pc = Pg = 0.8. The surface diffusion is set to allow sites to move up to 10 steps around its initial position at every time step. (b) Typical cross-sections of two model plaques (of diameter ≈50 pixels) after 500 time steps, illustrating the effect of surface diffusion. The initial value of the disaggregation and growth probabilities are the same as in a. Starting with a small solid sphere as an initial condition, the model with no surface diffusion evolves into a too diffuse object with less well defined pores when compared with the lower one, which is a result of the model with diffusion. c and d show eight consecutive two-dimensional cross-sections and three-dimensional reconstruction of the model plaque from b, respectively.
References
-
- Selkoe D. J Neuropathol Exp Neurol. 1994;53:438–447. - PubMed
-
- Goate A, Chartier-Harlin M-C, Mullan M. Nature (London) 1991;349:704–707. - PubMed
-
- Cai X-D, Golde T E, Younkin S G. Science. 1993;259:514–516. - PubMed
-
- de Gennes P-G. Scaling Concepts in Polymer Physics. Ithaca, NY: Cornell Univ. Press; 1979.
-
- Family F, Landau D P, editors. Kinetics of Aggregation and Gelation. Amsterdam: Elsevier; 1984.
Publication types
MeSH terms
Grants and funding
LinkOut - more resources
Full Text Sources
Medical
