. 1997 Jul 14;138(1):55-64.
doi: 10.1083/jcb.138.1.55.

Multiple exocytotic pathways in pancreatic beta cells

Affiliations

Multiple exocytotic pathways in pancreatic beta cells

N Takahashi et al. J Cell Biol. .

Abstract

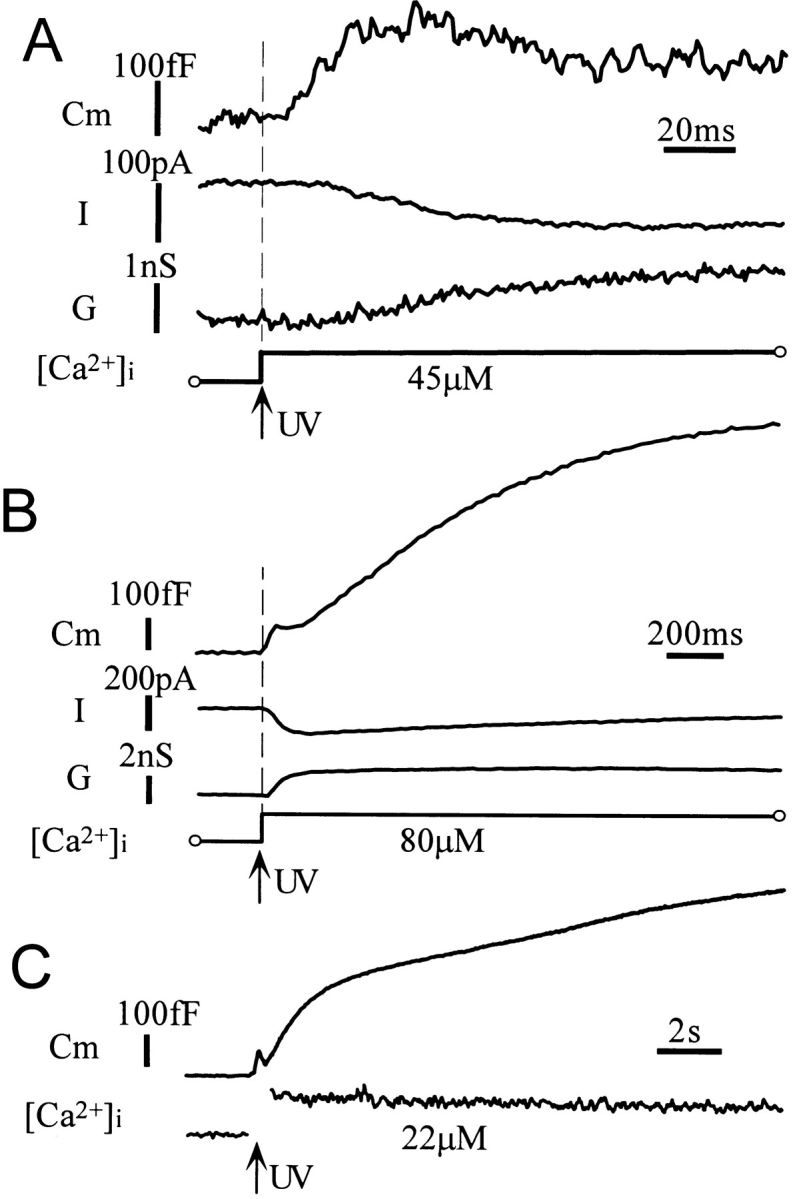
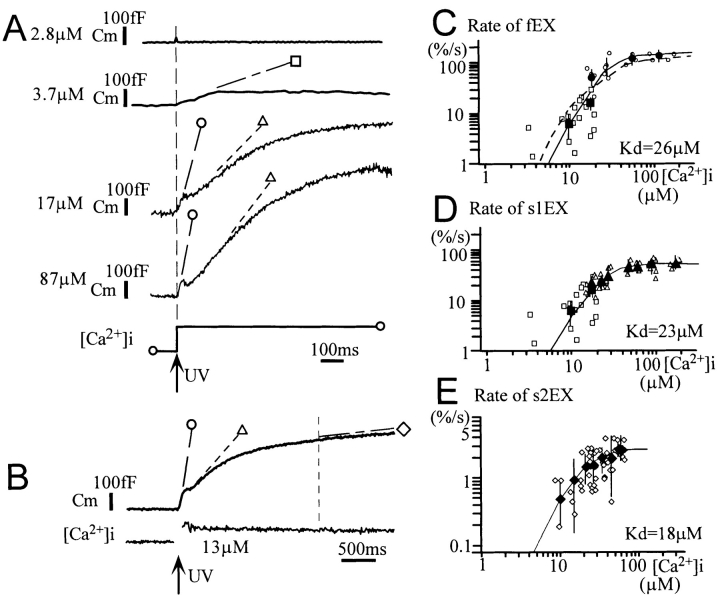
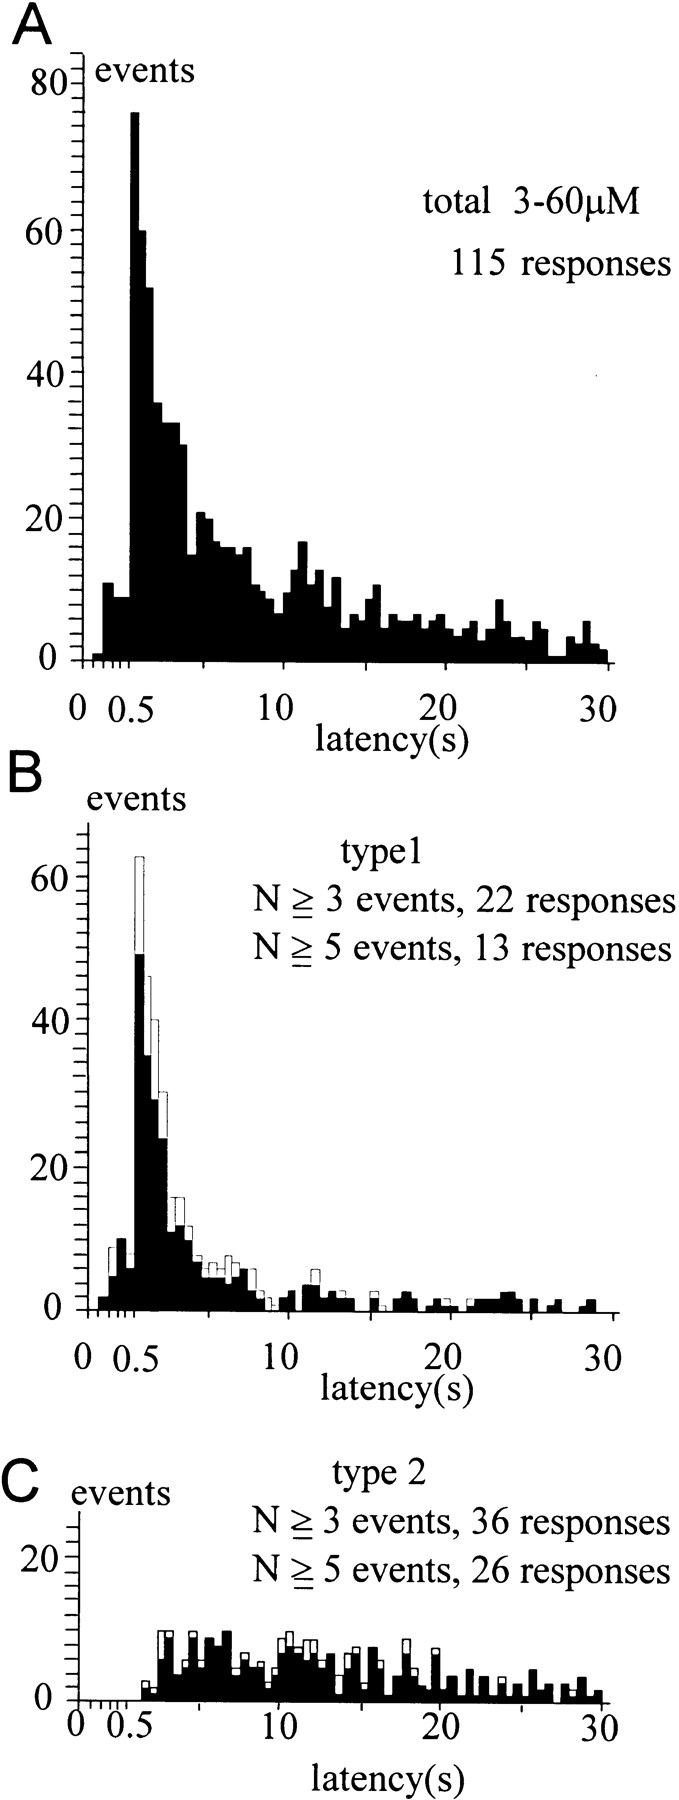
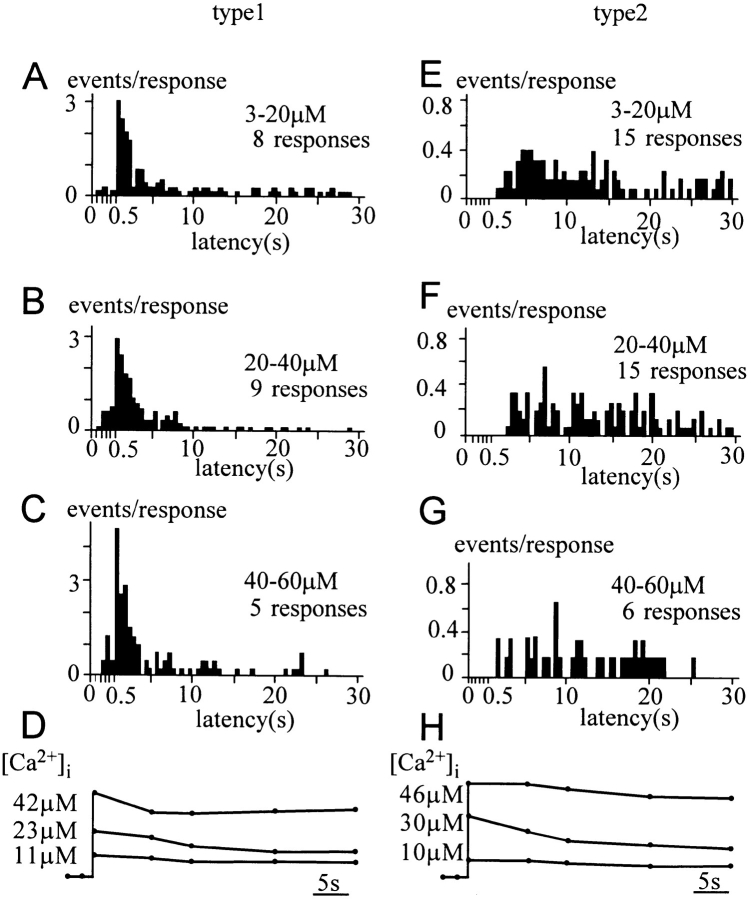
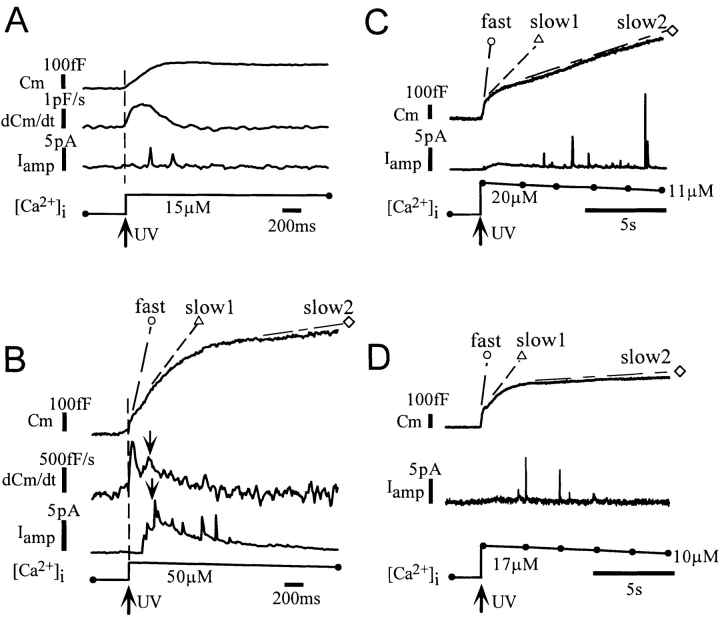
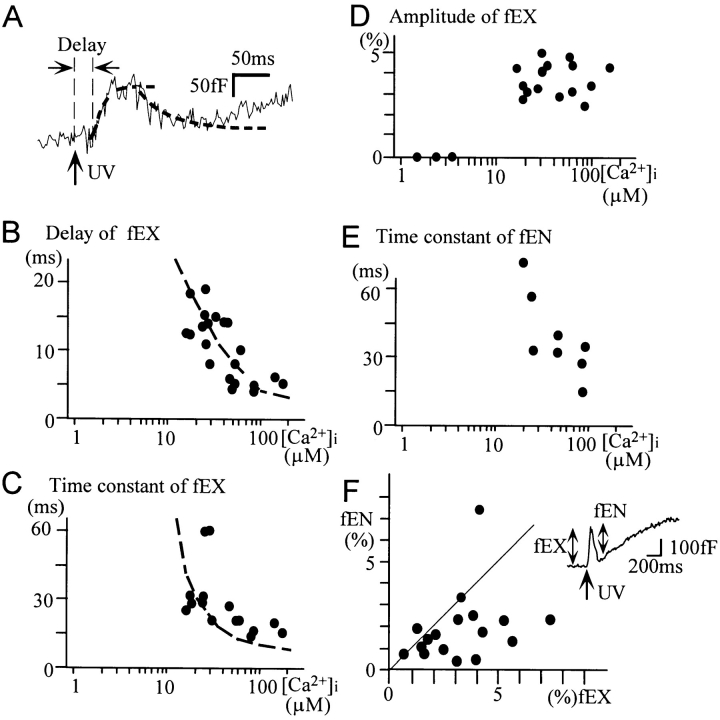
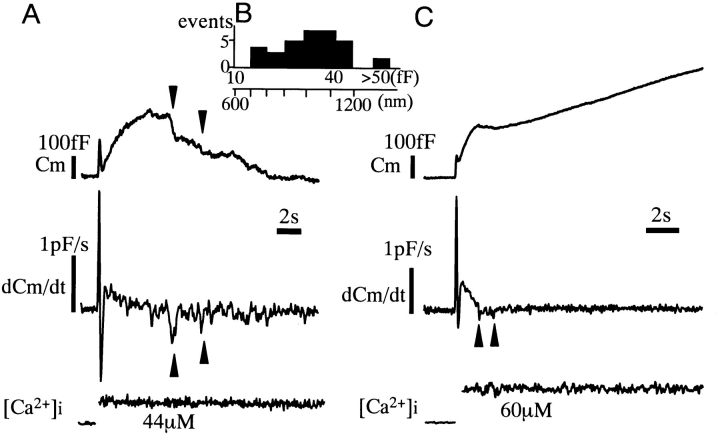
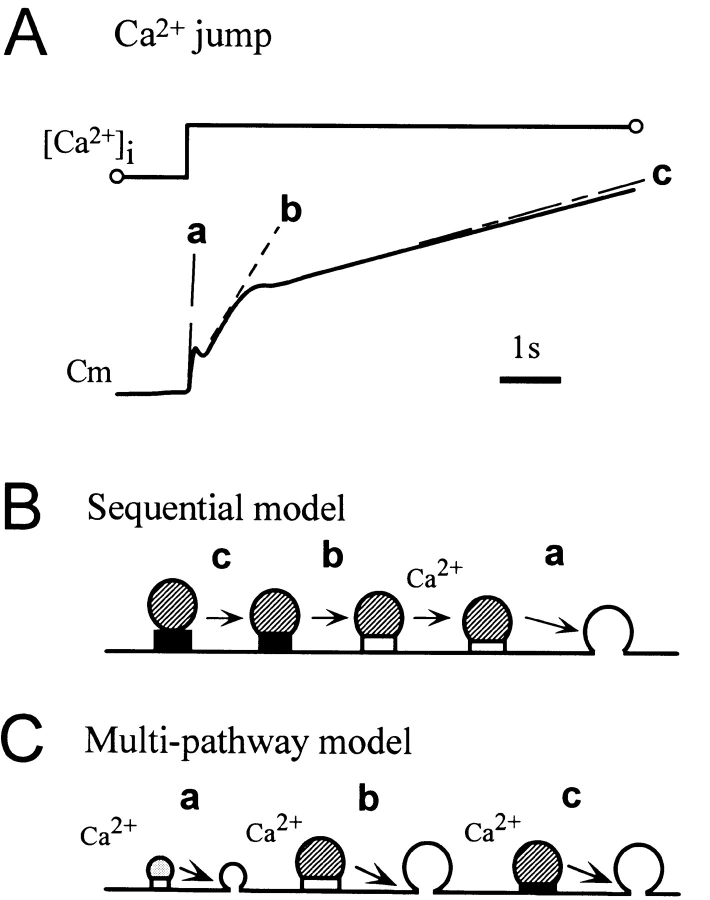
Ca2+-dependent exocytotic pathways in mouse pancreatic beta cells were investigated using both capacitance measurement and amperometric detection of vesicular contents. Serotonin was preloaded into large dense-core vesicles for the amperometry. Exocytosis was induced by rapid elevation of cytosolic Ca2+ concentrations using caged-Ca2+ compounds. Capacitance measurement revealed two major components of exocytosis, and only the slow component was accompanied by amperometric events reflecting quantal serotonin secretion. Moreover, the fast and slow exocytoses induced the two forms of endocytosis that were reported to follow the exocytoses of small-clear and large dense-core vesicles, respectively. Interestingly, we recorded two types of responses of quantal events: in the type-1 response, most quantal events occurred with a delay of 0.2 s and were rapidly exhausted with a time constant of 1.7 s, while, in the type-2 response, quantal events occurred with a delay of 2.5 s and were sustained. This suggests the existence of two pathways or modes of the exocytosis involving large dense-core vesicles. Thus, we have revealed three exocytotic pathways with divergent fusion kinetics in beta cells, which provide a new basis for the understanding of the physiology and pathology of beta cells.


Figures

Figure 1
Figure 1
Membrane capacitance changes evoked by Ca2+ jumps in mouse β cells. Capacitance changes recorded from three cells. (A) The onset of the capacitance increases (Cm) preceded any changes in current (I) and conductance (G). The fast exocytotic component occurred with a delay and was followed by rapid endocytosis. (B) The slow exponential component of capacitance increase after the fast exocytotic component. This slow component was not associated with any changes in current (I) or conductance (G). (C) A linear increase in capacitance after the slow exponential component. This type of response frequently appeared when [Ca2+]i increases were sustained.
Figure 2
Figure 2
Ca2+ dependence of the three components of capacitance increases in β cells. (A) Typical capacitance traces recorded from four different cells where [Ca2+]i was elevated to the levels indicated on the left of each trace. Symbols denote the slope of each of the two components of capacitance increases (see text). (B) An example of a capacitance trace where increase in [Ca2+]i was sustained and a linear slow phase of capacitance increase occurred. The slope of the linear component of capacitance increase was measured 2 s after the onset of Ca2+ jumps to minimize a contribution from the exponential component. (C–E) Ca2+ dependence of the rate of the fast component (fEX) and the two phases in the slow component of the increase in capacitance (s1EX and s2EX). The ordinate represents the maximal slope (rate) of each capacitance trace normalized by the total cell capacitance in each cell. Open small symbols represent data from individual cells, and large filled symbols represent means of the data obtained at certain intervals of [Ca2+]i increases. Vertical bars in the filled symbols denote the SD for 3–12 data points. Smooth lines are drawn according to the Hill equation with Hill coefficients of 3.2, 2.8, and 2.3 in C, D, and E, respectively. The dotted line in C is drawn according to Eq. 1 and predicted parameters in the text.
Figure 4
Figure 4
Type-1 and type-2 distributions. (A) The distribution of quantal events induced by Ca2+ jumps resulting in [Ca2+]i between 3 and 60 μM. (B) Estimated type-1 distribution obtained from the typical type-1 responses that contained at least N events (five and three for solid and open columns, respectively) within 1.5 s after the Ca2+ jumps. (C) Estimated type-2 distribution obtained from the typical type-2 responses that contained at least N events (five and three for solid and open columns, respectively) >1.5 s after the Ca2+ jumps. The width of the bin is set as 0.1 s until 0.5 s after the onset of Ca2+ jumps, when it is set as 0.5 s.
Figure 5
Figure 5
Ca2+ dependence of type-1 and type-2 distributions. (A–C and E–G) Estimated type-1 (A–C) and type-2 (E–G) distributions obtained from the typical type-1 and type-2 responses, respectively, induced by Ca2+ jumps resulting in [Ca2+]i between 3 and 20 μM (A and E), between 20 and 40 μM (B and F), and between 40 and 60 μM (C and G). (D and H) Superimposed traces for time courses of [Ca2+]i, each trace corresponding to (A and E), (B and F), and (C and G). Each point is an average for more than five experiments.
Figure 3
Figure 3
Simultaneous measurement of membrane capacitance and serotonin secretion. (A) A single component of capacitance increase for which a quantal secretory event was not detected in its early period. (B) An example of a type-1 response showing multiple quantal events within 1.5 s from the onset of Ca2+ jumps. (C and D) Two examples of type-2 responses where all of at least five quantal events were detected >1.5 s after the Ca2+ jump. The fast, slow-1, and slow-2 phases of capacitance increases are indicated by open circles, open triangles, and open diamonds, respectively.
Figure 6
Figure 6
Fast exo- and endocytosis. (A) Time courses of the fast exo- and endocytosis. The dashed curve is an exponential fit of the data. (B–D) Ca2+ dependence of the delays (B), time constants (C), and amplitudes (D) of the fast exocytosis. Smooth dashed curves in B and D are drawn according to Eq. 1 and parameters in the text. (E) Ca2+ dependence of the time constants of the fast endocytosis. (F) Correlation between the amplitudes of the fast exocytosis and endocytosis. The solid line indicates the relationship fEX = fEN. The correlation coefficient is 0.449 (P < 0.025). The width of the bin is set as 0.1 s until 0.5 s after the onset of Ca2+ jumps, when it is set as 0.5 s.
Figure 7
Figure 7
Slow endocytosis. (A) An example of the slow endocytosis that occurred after the slow-2 phase of capacitance increase. Arrows indicate the stepwise decreases in capacitance, which appear as negative spikes in the time derivative of capacitance (Cm/dt). (B) Amplitude distribution of the stepwise capacitance decreases, representing endocytosis of large vesicles. Diameters of the vesicles are calculated assuming a spherical shape of the vesicles and a membrane capacitance of 1 μF/cm2. (C) An example of the slow endocytosis that occurred immediately after the slow-1 phase of capacitance increase.
Figure 8
Figure 8
Exocytotic events induced by Ca2+ jumps in a pancreatic β cell. (A) Three phases (a, b, and c) in the increase in membrane capacitance induced by Ca2+ jumps. (B) Sequential model. This model contains only one fusion step with a rate constant (a) preceded by two sequential steps with rate constants (b and c). This model is inconsistent with our data for β cells, first because quantal serotonin secretion was only associated with the slow capacitance increase, suggesting a separate SV pathway, and second because the two types of responses of quantal events were detected during the slow capacitance increase, indicating the existence of two LV pathways (see text). (C) Multi-pathway model. Three pathways, one SV and two LV pathways, undergo exocytosis with time constants reflected by a, b, and c. The two LV pathways either represent two independent pathways or two modes of the same pathway where the modes are regulated by cellular metabolic states.

References

    1. Almers W, Neher E. The Ca signal from fura-2 loaded mast cells depends strongly on the method of dye-loading. FEBS Lett. 1985;192:13–18. - PubMed
    1. Ämmälä C, Eliasson L, Bokvist K, Larsson O, Ashcroft FM, Rorsman P. Exocytosis elicited by action potentials and voltage-clamp calcium currents in individual mouse pancreatic B-cells. J Physiol. 1993;472:665–688. - PMC - PubMed
    1. Ämmälä C, Eliasson L, Bokvist K, Berggren P, Honkanen RE, Sjoeholm A, Rorsman P. Activation of protein kinases and inhibition of protein phophatases play a central role in the regulation of exocytosis in mouse pancreatic β cells. Proc Natl Acad Sci USA. 1994;91:4343–4347. - PMC - PubMed
    1. Andersson PO, Bloom SR, Edwards AV. Effects of stimulation of the chorda tympani in bursts on submaxilliary responses in the cat. J Physiol. 1982;322:469–483. - PMC - PubMed
    1. Back N, Soinila S, Virtanen I. Endocytotic pathways in the melanotroph of the rat pituitary. Histochem J. 1993;23:133–139. - PubMed

Publication types