. 1997 Jul 14;138(1):131-42.
doi: 10.1083/jcb.138.1.131.

Translational diffusion of macromolecule-sized solutes in cytoplasm and nucleus

Affiliations

Translational diffusion of macromolecule-sized solutes in cytoplasm and nucleus

O Seksek et al. J Cell Biol. .

Abstract

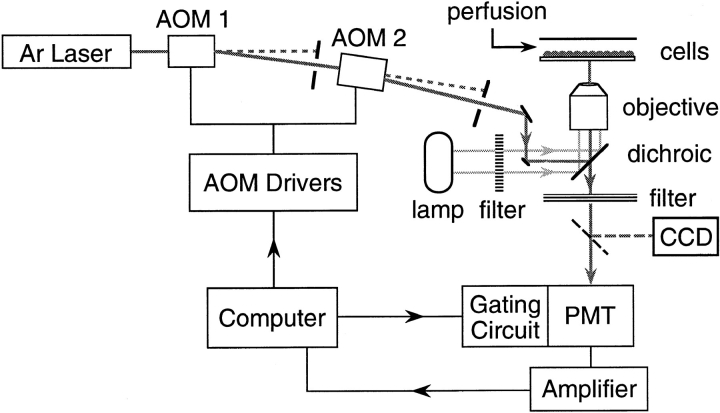
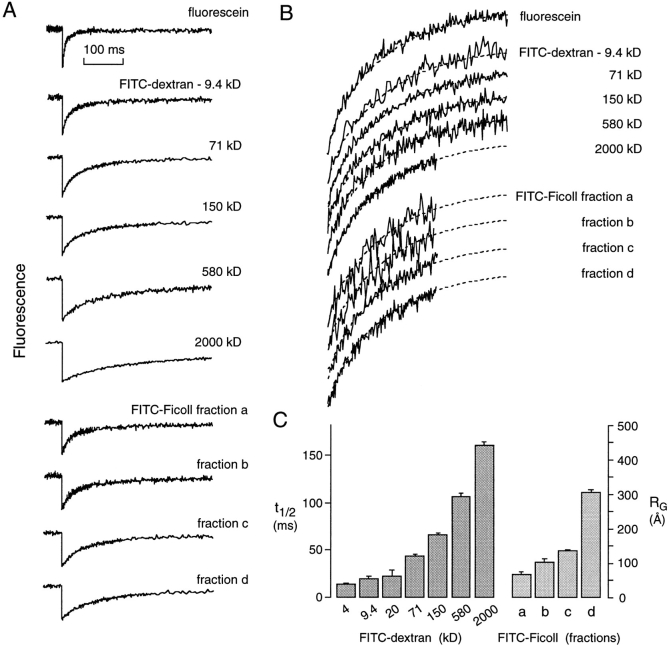
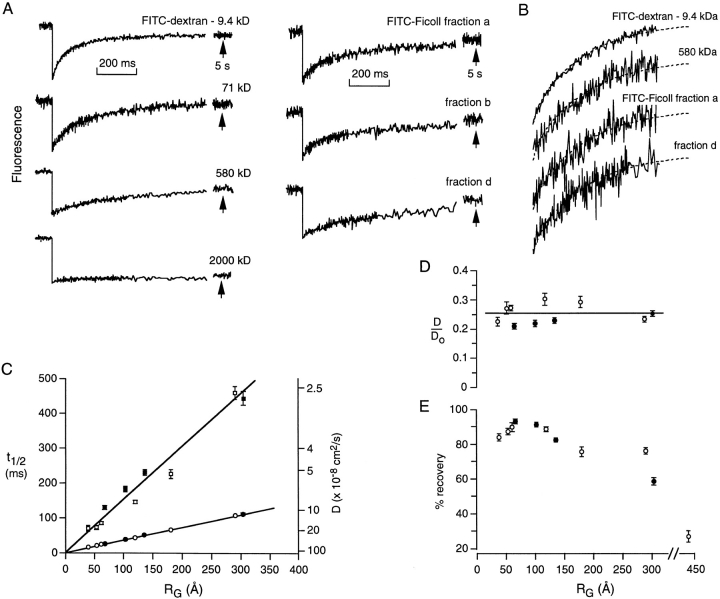
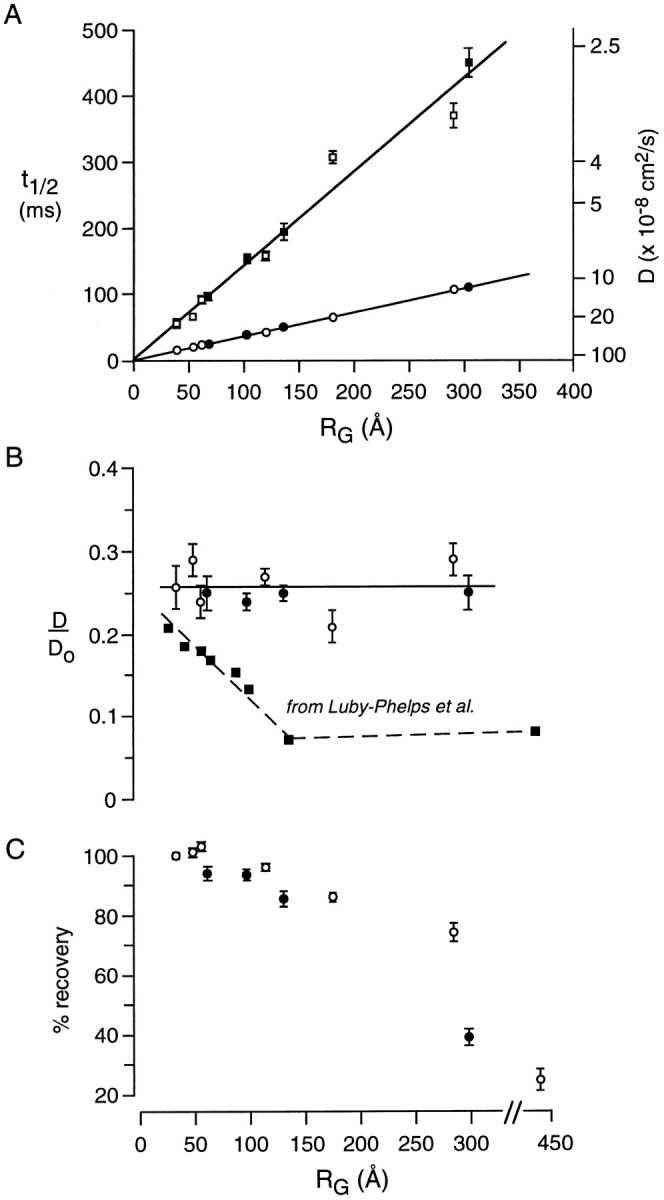
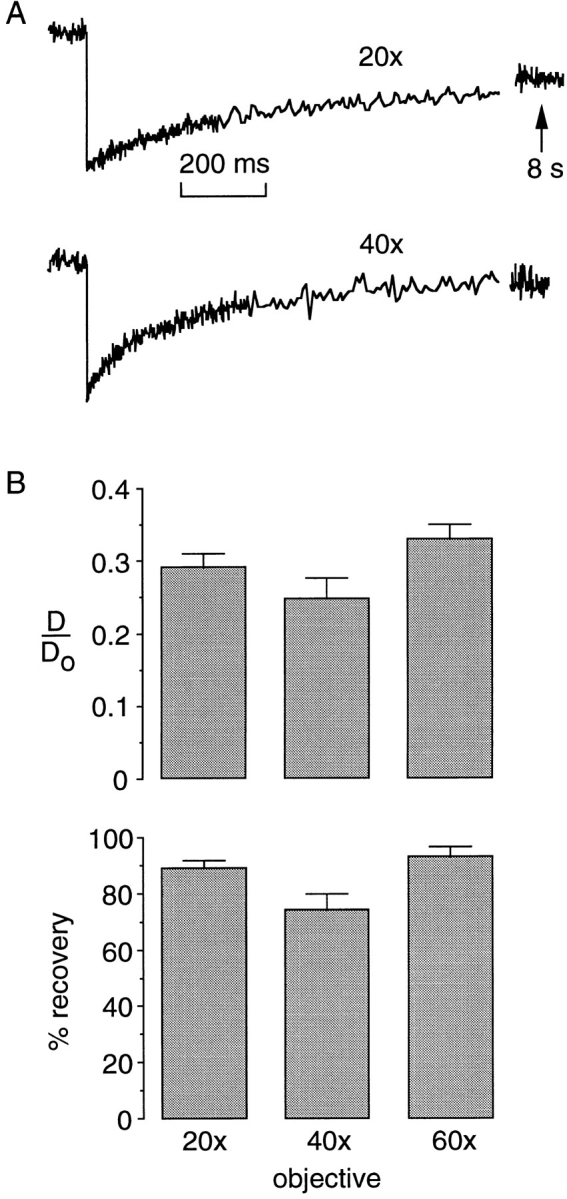
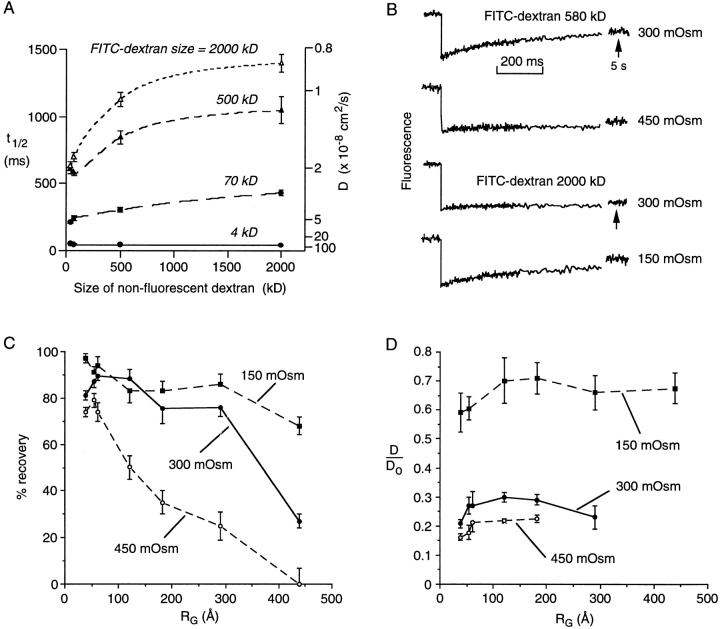
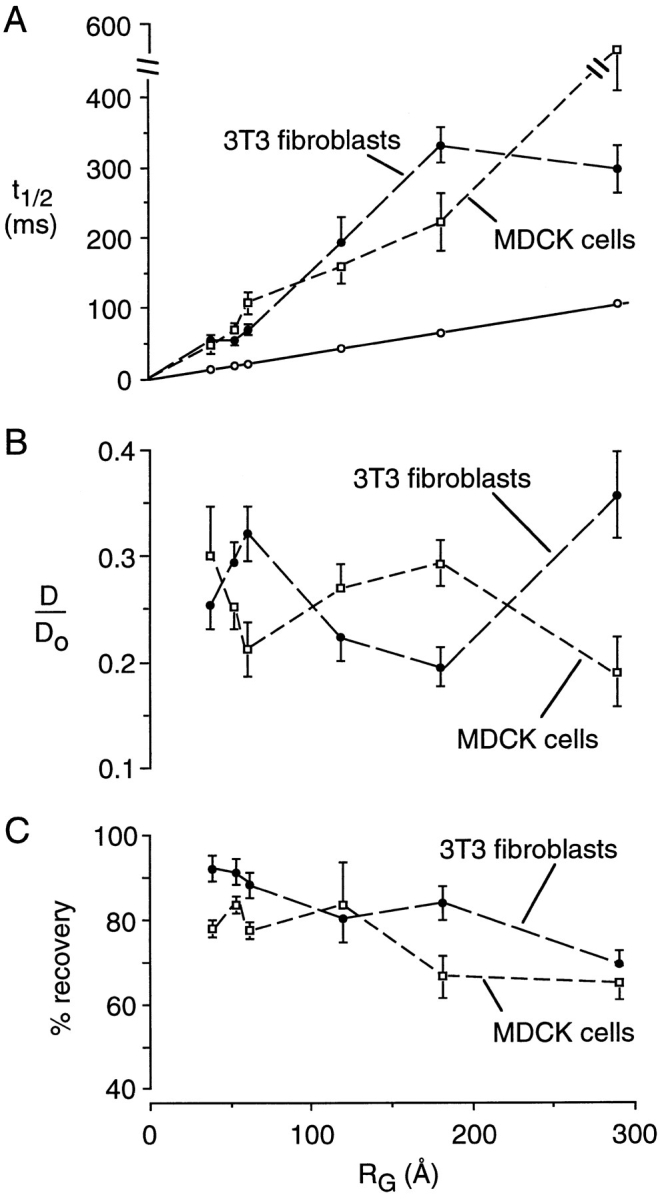
Fluorescence recovery after photobleaching (FRAP) was used to quantify the translational diffusion of microinjected FITC-dextrans and Ficolls in the cytoplasm and nucleus of MDCK epithelial cells and Swiss 3T3 fibroblasts. Absolute diffusion coefficients (D) were measured using a microsecond-resolution FRAP apparatus and solution standards. In aqueous media (viscosity 1 cP), D for the FITC-dextrans decreased from 75 to 8.4 x 10(-7) cm2/s with increasing dextran size (4-2,000 kD). D in cytoplasm relative to that in water (D/Do) was 0.26 +/- 0.01 (MDCK) and 0.27 +/- 0.01 (fibroblasts), and independent of FITC-dextran and Ficoll size (gyration radii [RG] 40-300 A). The fraction of mobile FITC-dextran molecules (fmob), determined by the extent of fluorescence recovery after spot photobleaching, was >>0.75 for RG << 200 A, but decreased to <<0.5 for RG >> 300 A. The independence of D/Do on FITC-dextran and Ficoll size does not support the concept of solute "sieving" (size-dependent diffusion) in cytoplasm. Photobleaching measurements using different spot diameters (1.5-4 micron) gave similar D/Do, indicating that microcompartments, if present, are of submicron size. Measurements of D/Do and fmob in concentrated dextran solutions, as well as in swollen and shrunken cells, suggested that the low fmob for very large macromolecules might be related to restrictions imposed by immobile obstacles (such as microcompartments) or to anomalous diffusion (such as percolation). In nucleus, D/Do was 0.25 +/- 0.02 (MDCK) and 0.27 +/- 0.03 (fibroblasts), and independent of solute size (RG 40-300 A). Our results indicate relatively free and rapid diffusion of macromolecule-sized solutes up to approximately 500 kD in cytoplasm and nucleus.


Figures

Figure 1
Figure 1
Schematic of the photobleaching apparatus. The laser beam is modulated by acoustooptic modulators (AOM 1 and AOM 2) and fluorescence is recorded from a focused spot using a photomultiplier that is gated off during the photobleaching pulse. See Materials and Methods for details.
Figure 2
Figure 2
Photobleaching recovery measurements on aqueous solutions of FITC-dextrans and Ficolls. (A) Recovery curves for fluorescein (0.1 mM) and indicated FITC-dextrans and Ficolls (4 mg/ml) in PBS at 23°C. Bleach time was 0.5 ms, solution layer thickness was 5 μm, and the ×20 objective lens was used. Final fluorescence (at 10 s) was 98–101% of initial (prebleach) fluorescence. (B) Curves shown in A were scaled in time and amplitude to compare shape. Identical dashed curves are shown overlying each data curve to facilitate visual comparison. (C) Averaged recovery half-times (t1/2, mean ± SEM, n = 15–25) for FITC-dextrans and Ficolls. Purchased FITC-dextrans (molecular sizes indicated) and synthesized FITC-Ficolls were size fractionated twice (see Materials and Methods). Gyration radii (RG) were computed according to Luby-Phelps et al. (1986) and a measured fluorescein diffusion coefficient of 2.6 × 10⁻⁶ cm2/s from the relation, RG (in Å) = 2.74 t1/2 (in ms).
Figure 3
Figure 3
Micrographs of labeled MDCK cells. (A) Cell cytoplasm or nucleus was microinjected with 580-kD FITC-dextran as described in Materials and Methods. Confocal micrographs (z-resolution ∼1 μm) were obtained using a ×60 oil objective (N.A. 1.4) and cooled CCD camera detector. (Inset) Low magnification (×20) wide-field micrograph showing laser spot (arrow). (B) Confocal micrograph of MDCK cells microinjected with 20-kD FITC-dextran. (C) Size-exclusion chromatograms of FITC-dextran (70 kD) and FITC-Ficoll (fraction c) before (filled circles) vs after (open circles, dashed lines) remaining in cytoplasm for 6 h. No change in size distribution was found. Bars, 20 μm.
Figure 3
Figure 3
Micrographs of labeled MDCK cells. (A) Cell cytoplasm or nucleus was microinjected with 580-kD FITC-dextran as described in Materials and Methods. Confocal micrographs (z-resolution ∼1 μm) were obtained using a ×60 oil objective (N.A. 1.4) and cooled CCD camera detector. (Inset) Low magnification (×20) wide-field micrograph showing laser spot (arrow). (B) Confocal micrograph of MDCK cells microinjected with 20-kD FITC-dextran. (C) Size-exclusion chromatograms of FITC-dextran (70 kD) and FITC-Ficoll (fraction c) before (filled circles) vs after (open circles, dashed lines) remaining in cytoplasm for 6 h. No change in size distribution was found. Bars, 20 μm.
Figure 4
Figure 4
Photobleaching recovery measurements of FITC-dextran and Ficoll diffusion in MDCK cell cytoplasm. (A) Representative spot photobleaching recovery data (0.5 ms bleach time, ×20 objective) for cells microinjected with indicated FITC-dextrans and Ficolls. Cells were incubated for 4–6 h at 37°C before measurements done at 23°C. (B) Curves shown in A were scaled in time and amplitude to compare shape. Identical dashed curves over each experimental curve are the same as in Fig. 2 B. (C) Dependence of recovery half-time (t1/2) and deduced diffusion coefficient (D) on gyration radius. Each point is the mean ± SEM for 30–45 independent measurements done with FITC-dextrans (open circles) and FITC-Ficolls (filled circles). For comparison, the t1/2 vs RG data are shown for diffusion in aqueous solutions (from Fig. 2 C). (D) Ratio of the relative FITC-dextran diffusion coefficient in cells to that in aqueous solution (D/ Do) as a function of RG. (E) Percentage fluorescence recovery as a function of RG.
Figure 5
Figure 5
Photobleaching recovery measurements of FITC-dextran and Ficoll diffusion in cytoplasm of Swiss 3T3 fibroblasts. Measurements were carried out as in Fig. 4. (A) Dependence of recovery half time (t1/2) and deduced diffusion coefficient (D) on RG. Each point is the mean ± SEM for 30–45 independent measurements done with FITC-dextrans (open circles) and FITC-Ficolls (filled circles). For comparison, the t1/2 vs RG line data are shown for diffusion in aqueous solutions. (B) Ratio of the relative FITC-dextran diffusion coefficient in cells to that in aqueous solution (D/Do) as a function of RG. For comparison, data from Luby-Phelps et al. (1986) are plotted on the same scale. (C) Percentage fluorescence recovery as a function of RG.
Figure 6
Figure 6
Reversible photobleaching of FITC-dextran in cytoplasm of Swiss 3T3 fibroblasts at 37°C. Spot photobleaching experiments were done in cells microinjected with 580-kD FITC-dextran (RG 291 nm). Measurements were made as indicated at 23°C vs 37°C, in solutions equilibrated with air vs 100% O2, and with the ×20 vs ×40 objectives.
Figure 8
Figure 8
Effect of spot size on apparent solute diffusion. (A) Representative photobleaching recovery curves for MDCK cells microinjected in the cytoplasm with 580-kD FITC-dextran. (B) Relative diffusion in cytoplasm vs water (D/Do) and percentage recoveries shown (n = 4). Objective lenses were: ×20 (dry, N.A. 0.75), ×40 (dry, N.A. 0.55), and ×60 (oil, N.A. 1.4). Bleach times were 1 (×20), 0.5 (×40), and 0.2 ms (×60).
Figure 7
Figure 7
Influence of cell volume on diffusion of FITC-dextrans in MDCK cell cytoplasm. (A) Photobleaching of FITC-dextrans in 5-μm solution films containing 15% vol unlabeled dextran (10 mg/ ml). Recovery t1/2 as a function of the size of the nonfluorescent dextran. (B) MDCK cells were microinjected with FITC-dextrans, incubated for 4–6 h, and then subjected to photobleaching measurements after a 5–20-min incubation in PBS (300 mosM), PBS diluted 1:1 with water (150 mosM), and PBS containing 150 mM sucrose (450 mosM). Bleach time was 1 ms and the ×20 objective lens was used. Representative recovery curves for 580- and 2,000-kD FITC-dextran and indicated solution osmolalities. (C) Dependence of percentage recovery on RG. (D) Dependence of D/Do on RG.
Figure 9
Figure 9
Photobleaching recovery measurements of FITC-dextran diffusion in nuclei of MDCK cells and Swiss 3T3 fibroblasts. Experiments were done as in Figs. 4 and 5 after intranuclear injection of FITC-dextrans. (A) Dependence of t1/2 on FITC-dextran RG. For comparison, the t1/2 vs RG data are shown for diffusion in aqueous solutions. (B) Dependence of D/Do on RG. (C) Dependence of percentage recovery on RG.

References

    1. Almeida, P.F.F., and W.L.C. Vaz. 1995. Lateral diffusion in membranes. In Handbook of Biological Physics. R. Lipowsky and E. Sackmann, editors. Elsevier Science Publishing Co., Inc., New York. 305–345.
    1. Alexander SP, Rieder CL. Chromosome motion during attachment to the vertebrate spindle: initial saltatory-like behavior of chromosomes and quantitative analysis of force production by nascent kinetochore fibers. J Cell Biol. 1991;113:805–815. - PMC - PubMed
    1. Axelrod D, Koppel DE, Schlessinger J, Elson E, Webb WW. Mobility measurement by analysis of fluorescence photobleaching recovery kinetics. Biophys J. 1976;16:1055–1069. - PMC - PubMed
    1. Berezney R. The nuclear matrix: a heuristic model for investigating genomic organization and function in the cell nucleus. J Cell Biochem. 1991;47:109–123. - PubMed
    1. Bicknese S, Periasamy N, Shohet SB, Verkman AS. Cytoplasmic viscosity near the cell plasma membrane: measurement by evanescent field frequency-domain microfluorimetry. Biophys J. 1993;165:1272–1282. - PMC - PubMed

Publication types

MeSH terms