Ca2+- and voltage-dependent inactivation of Ca2+ channels in nerve terminals of the neurohypophysis
- PMID: 9221775
- PMCID: PMC6573212
- DOI: 10.1523/JNEUROSCI.17-15-05772.1997
Ca2+- and voltage-dependent inactivation of Ca2+ channels in nerve terminals of the neurohypophysis
Abstract
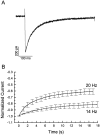
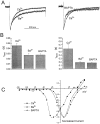
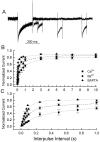
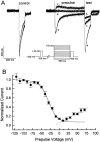
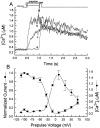
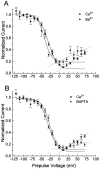
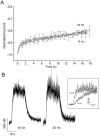
Ca2+ channel inactivation was investigated in neurohypophysial nerve terminals by using patch-clamp techniques. The contribution of intracellular Ca2+ to inactivation was evaluated by replacing Ca2+ with Ba2+ or by including BAPTA in the internal recording solution. Ca2+ channel inactivation during depolarizing pulses was primarily voltage-dependent. A contribution of intracellular Ca2+ was revealed by comparing steady-state inactivation of Ca2+ channels with Ca2+ current and with intracellular [Ca2+]. However, this contribution was small compared to that of voltage. In contrast to voltage-gated Ca2+ channels in other preparations, in the neurohypophysis Ba2+ substitution or intracellular BAPTA increased the speed of inactivation while reducing the steady-state level of inactivation. Ca2+ channel recovery from inactivation was studied by using a paired-pulse protocol. The rate of Ca2+ channel recovery from inactivation at negative potentials was increased dramatically by Ba2+ substitution or intracellular BAPTA, indicating that intracellular Ca2+ inhibits recovery. Stimulation with trains of brief pulses designed to mimic physiological bursts of electrical activity showed that Ca2+ channel inactivation was much greater with 20 Hz trains than with 14 Hz trains. Inactivation induced by 20 Hz trains was reduced by intracellular BAPTA, suggesting an important role for Ca2+-dependent inactivation during physiologically relevant forms of electrical activity. Inhibitors of calmodulin and calcineurin had no effect on Ca2+ channel inactivation, arguing against a mechanism of inactivation involving these Ca2+-dependent proteins. The inactivation behavior described here, in which voltage effects on Ca2+ channel inactivation predominate at positive potentials and Ca2+ effects predominate at negative potentials, may be relevant to the regulation of neuropeptide release.
Figures

Similar articles
-
Regulation of secretory granule recruitment and exocytosis at rat neurohypophysial nerve endings.J Physiol. 1997 Feb 1;498 ( Pt 3)(Pt 3):735-51. doi: 10.1113/jphysiol.1997.sp021898. J Physiol. 1997. PMID: 9051585 Free PMC article.
-
Two types of high-threshold calcium currents inhibited by omega-conotoxin in nerve terminals of rat neurohypophysis.J Physiol. 1992 Jan;445:181-99. doi: 10.1113/jphysiol.1992.sp018919. J Physiol. 1992. PMID: 1323666 Free PMC article.
-
Membrane excitability and secretion from peptidergic nerve terminals.Cell Mol Neurobiol. 1998 Feb;18(1):45-63. doi: 10.1023/a:1022523109900. Cell Mol Neurobiol. 1998. PMID: 9524729 Free PMC article. Review.
-
Calcium-dependent inactivation of neuronal calcium channel currents is independent of calcineurin.Neuroscience. 2000;95(1):235-41. doi: 10.1016/s0306-4522(99)00434-0. Neuroscience. 2000. PMID: 10619480
-
Membrane excitability in the neurohypophysis.Adv Exp Med Biol. 1998;449:193-200. doi: 10.1007/978-1-4615-4871-3_25. Adv Exp Med Biol. 1998. PMID: 10026805 Review.
Cited by
-
Mathematical modelling of the oxytocin and vasopressin secretory system.Curr Opin Endocr Metab Res. 2022 Jun;24:100341. doi: 10.1016/j.coemr.2022.100341. Curr Opin Endocr Metab Res. 2022. PMID: 36632281 Free PMC article. Review.
-
Activity-dependent depression of excitability and calcium transients in the neurohypophysis suggests a model of "stuttering conduction".J Neurosci. 2003 Dec 10;23(36):11352-62. doi: 10.1523/JNEUROSCI.23-36-11352.2003. J Neurosci. 2003. PMID: 14672999 Free PMC article.
-
Ca2+/calmodulin-dependent facilitation and inactivation of P/Q-type Ca2+ channels.J Neurosci. 2000 Sep 15;20(18):6830-8. doi: 10.1523/JNEUROSCI.20-18-06830.2000. J Neurosci. 2000. PMID: 10995827 Free PMC article.
-
Voltage- and calcium-dependent inactivation of calcium channels in Lymnaea neurons.J Gen Physiol. 1999 Oct;114(4):535-50. doi: 10.1085/jgp.114.4.535. J Gen Physiol. 1999. PMID: 10498672 Free PMC article.
-
A mutation in the first intracellular loop of CACNA1A prevents P/Q channel modulation by SNARE proteins and lowers exocytosis.Proc Natl Acad Sci U S A. 2010 Jan 26;107(4):1672-7. doi: 10.1073/pnas.0908359107. Epub 2010 Jan 8. Proc Natl Acad Sci U S A. 2010. PMID: 20080591 Free PMC article.
References
-
- Armstrong D. Calcium channel regulation by calcineurin, a Ca2+-activated phosphatase in mammalian brain. Trends Neurosci. 1989;12:117–122. - PubMed
-
- Artalejo CR, Fox ME, Fox AP. Three types of Ca channel trigger secretion with different efficacies in chromaffin cells. Nature. 1994;367:72–76. - PubMed
-
- Augustine GJ, Neher E. Neuronal Ca2+ signaling takes the local route. Curr Opin Neurobiol. 1992;2:302–307. - PubMed
-
- Bechem M, Pott L. Removal of Ca current inactivation in dialysed guinea-pig atrial cardioballs by Ca chelators. Pflügers Arch. 1985;404:10–20. - PubMed
Publication types
MeSH terms
Substances
Grants and funding
LinkOut - more resources
Full Text Sources
Miscellaneous
