. 1997 Jun;109(6):767-78.
doi: 10.1085/jgp.109.6.767.

Role of transmembrane segment S5 on gating of voltage-dependent K+ channels

Affiliations

Role of transmembrane segment S5 on gating of voltage-dependent K+ channels

C C Shieh et al. J Gen Physiol. 1997 Jun.

Abstract

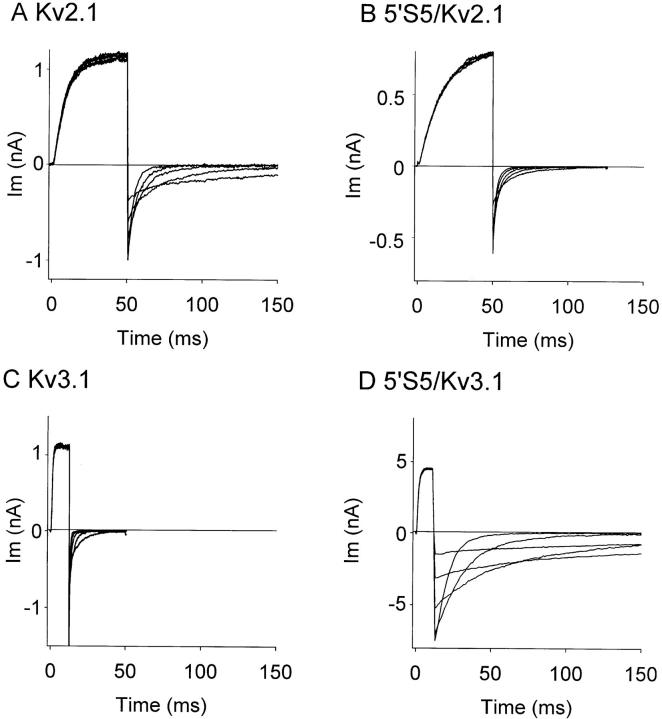
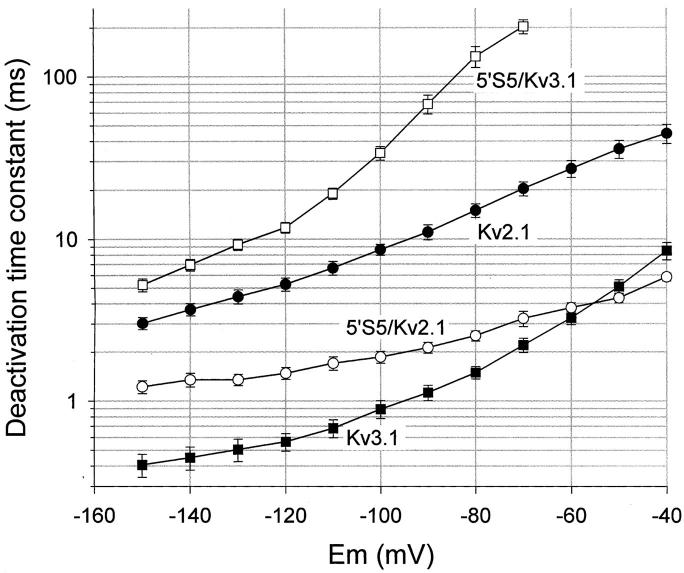
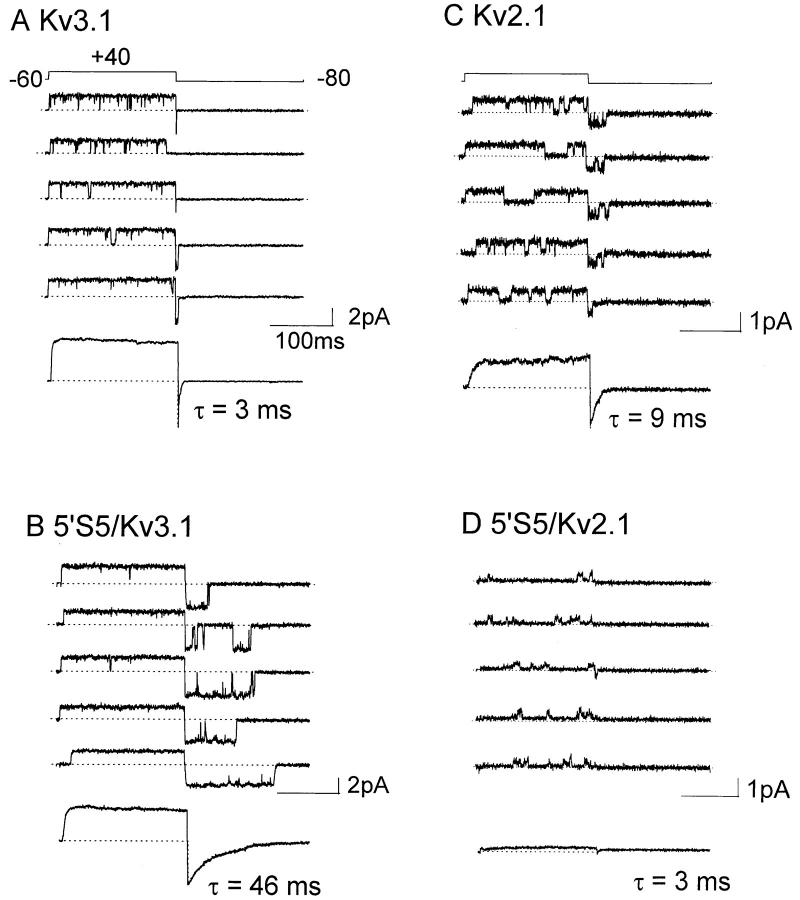
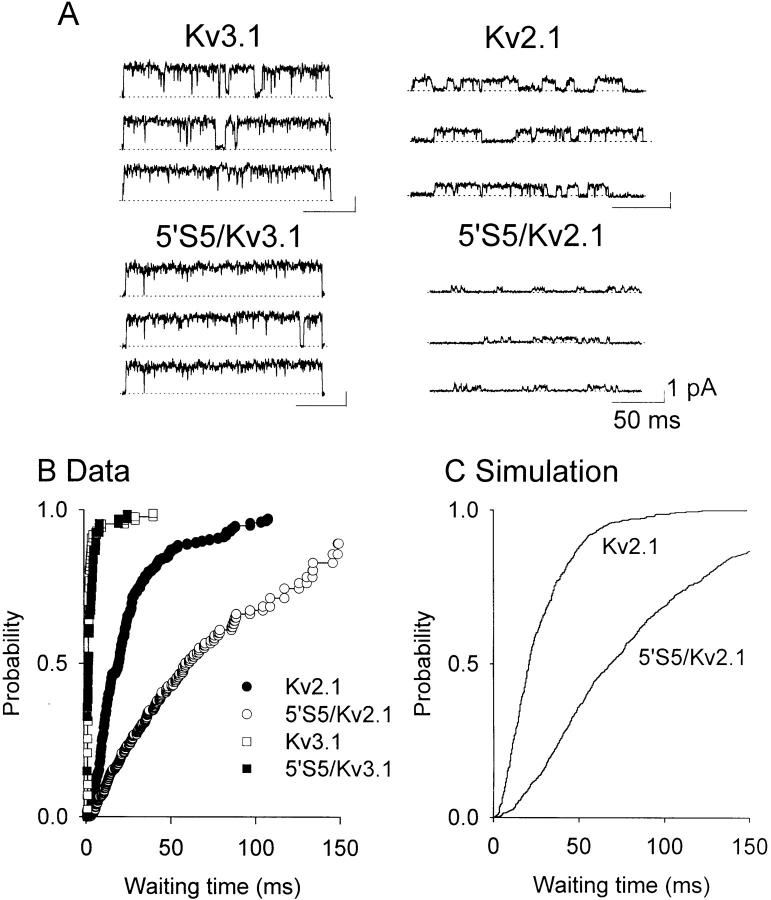
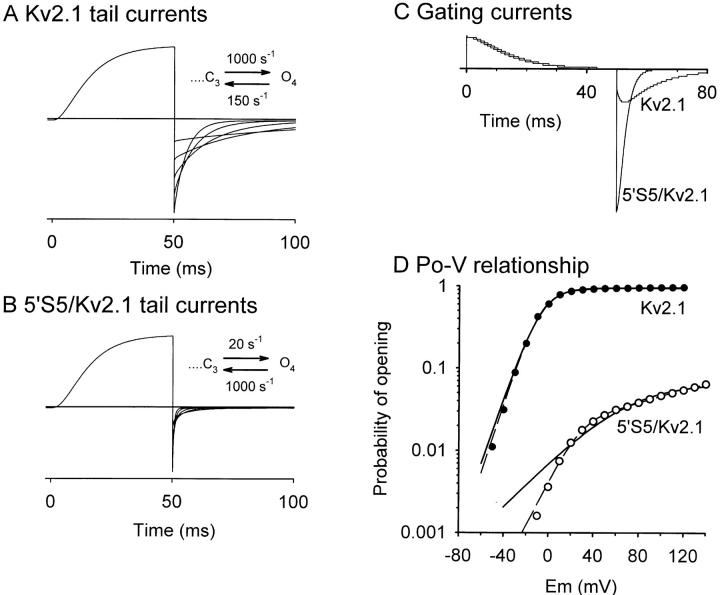
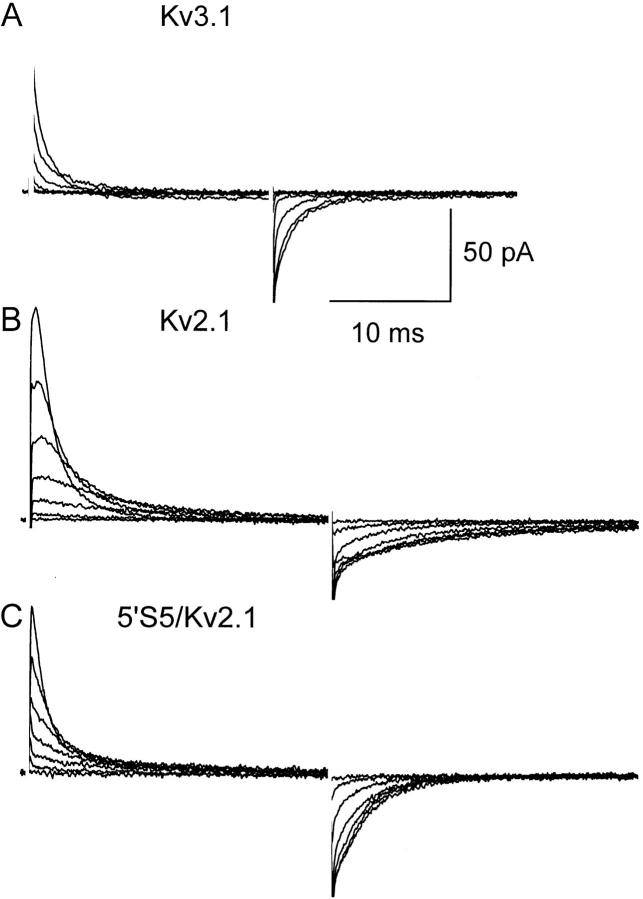
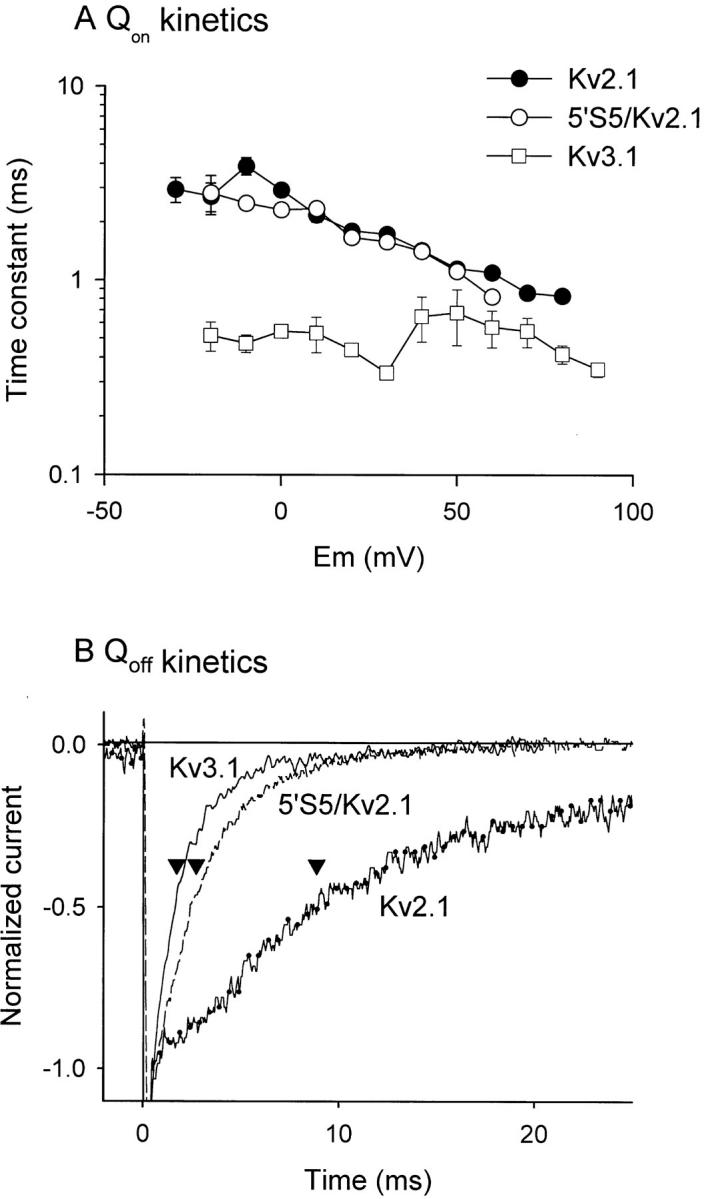
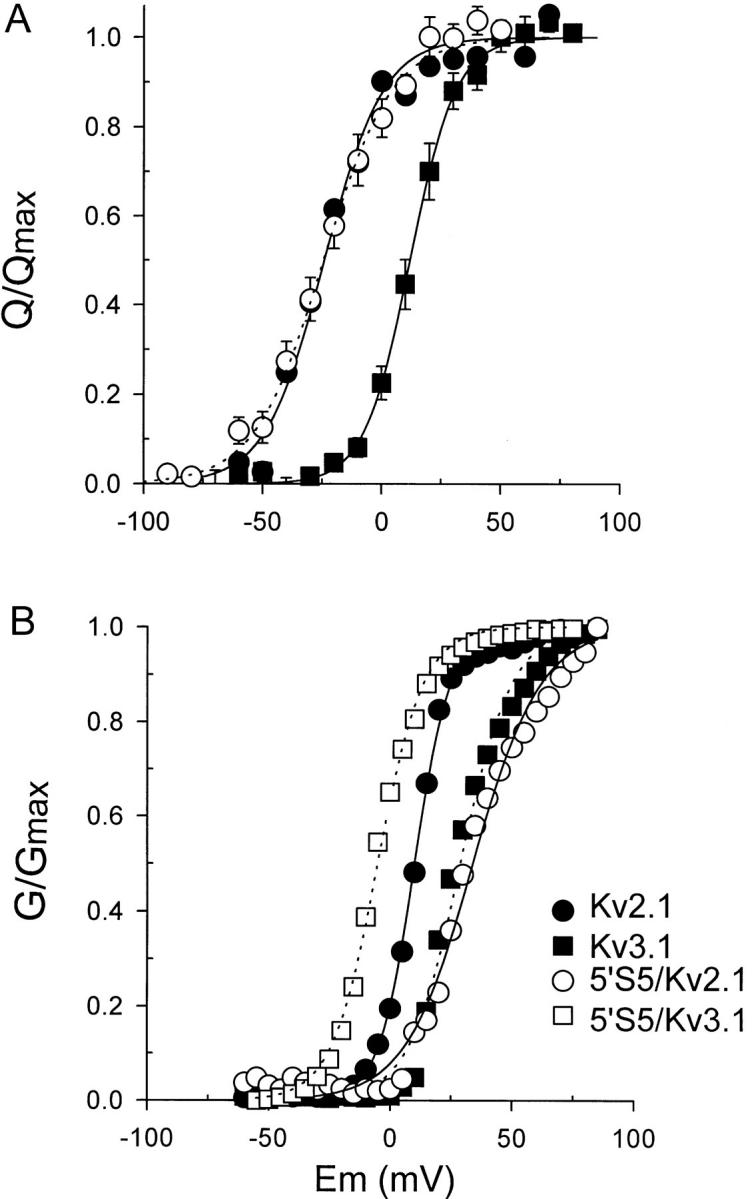
The cytoplasmic half of S5 (5'S5) has been identified as part of the inner mouth of the pore based on evidence that mutations in this region greatly alter single channel conductance, 4-aminopyridine (4-AP) block and the rate of channel closing upon repolarization (deactivation). The latter effect, suggestive of a role for 5'S5 in channel gating was investigated in the present study. The biophysical properties of chimeric channels, in which the 5'S5 regions were exchanged between two host channels (Kv2.1 and Kv3.1) that differ in 4-AP sensitivity and deactivation rate, were examined in a Xenopus oocyte expression system. Exchange of 5'S5 between Kv2.1 and Kv3.1 confers steady-state voltage dependence of activation and rates of channel deactivation similar to those of the donor channel. The involvement of voltage-dependent gating was confirmed by the observation that exchanging the 5'S5 segment of Kv2.1 with that of Kv3.1 confers a change from slow to fast deactivation kinetics by accelerating the decay of off-gating charge movement. We suggest that a conformational change that extends from the voltage-sensor in S4 to the region of the pore lined by S5 regulates the stability of the open state. Therefore, the cytoplasmic end of S5, in addition to forming part of the conduction pathway near the inner mouth of the pore, also participates in the conformational rearrangements associated with late steps in channel activation and early steps in deactivation.


Figures

Figure 1
Figure 1
Effect of chimeric S5 mutation in Kv2.1 on macroscopic activation and deactivation. Macroscopic currents were recorded from cell-attached membrane patches containing many channels in oocytes injected with cRNA: Kv2.1 (A), 5′S5/Kv2.1 (B), Kv3.1 (C), or 5′S5/Kv3.1 (D). The pipette (extracellular) solution contained 60 mM KCl to facilitate measurement of inward tail currents. A conditioning potential to +60 mV from a holding potential of −80 mV maximally activated the channels. Each panel illustrates outward currents during the conditioning step and inward tail currents during return steps to test potentials from −120 to −40 mV in 20-mV increments.
Figure 2
Figure 2
Voltage dependence of deactivation rate. Deactivation time constants were obtained by fitting the tail currents to monoexponential decay functions and were plotted semilogarithmically versus test potential: Kv2.1 (  filled circles), 5′S5/Kv2.1 (open circles), Kv3.1 (  filled squares), or 5′S5/Kv3.1 (open squares). The first 0.3 ms of the tail current was ignored during curve fitting to avoid limitations imposed by the clamp settling time. Each symbol represents average data from 5–10 membrane patches.
Figure 3
Figure 3
Effects of S5 mutations on single channel tail currents. Single-channel currents in Kv3.1 (A), 5′S5/Kv3.1 (B), Kv2.1 (C), and 5′S5/Kv2.1 (D) were recorded from cell-attached patches and the ensemble averages of 300–500 traces (except 5′S5, 128 traces). The patch membrane was pulsed to +40 mV for 200 ms and then returned to the holding potential of −80 mV. Pipette solution containing 60 mM NaCl and 60 mM KCl, and oocytes were bathed in a depolarizing isotonic KCl solution.
Figure 4
Figure 4
Cumulative first latency distributions. First latency distributions were obtained at +40 mV by patch-clamp single channel recording in the cell-attached mode. (A) Shows representative records in Kv3.1, 5′S5/Kv3.1, Kv2.1, and 5′S5/Kv2.1 channels. Pipette solution was normal Ringer containing 120 mM NaCl, and 2.5 mM KCl. Oocytes were bathed in a depolarizing isotonic KCl solution. (B) Shows the cumulative distribution of first latencies (from the representative experiments in A) at test potential +40 mV: Kv3.1 (open squares), 5′S5/Kv3.1 (  filled squares), Kv2.1 (f illed circles), and 5′S5/Kv2.1 (open circles), respectively. All data were obtained from single channel patches except 5′S5/Kv2.1 (3–8 channels/patch estimated from the maximum number of overlapping open channel events). These data were corrected (Aldrich et al., 1983) by taking the Nth root of the cumulative distribution (expressed as a survivor function, where N = 4, the estimated number of channels/patch in this experiment). As discussed in the text, because of the low Po of this mutant channel, the correction underestimates the slowing effect. (C) Compares the first latency distributions for Kv2.1 and 5′S5 obtained from the kinetic model described in Fig. 6.
Figure 6
Figure 6
Numeric simulation of macroscopic currents in Kv2.1 and 5′S5/Kv2.1 using a sequential model. The effect of the mutation was assumed to be a destabilization of the open state caused by a sevenfold acceleration of the first closing step, O4→ C3, and a 50-fold slowing of the last opening step, C3→ O4. A and B show simulated tail currents, comparable to the actual records illustrated in Fig. 1. C and D show the predicted gating currents and Po-V relationships for the two channels. In D the smooth curves represent fits to single Boltzmann distributions with midpoint potentials (and slope factors) of −6 (11) and 68 (31.5) mV, respectively in Kv2.1 and 5′S5/Kv2.1. As indicated by the broken lines a better fit of the 5′S5/Kv2.1 data was obtained by using the sum of two Boltzmann distributions.
Figure 5
Figure 5
Voltage dependence of single channel open time in Kv2.1. Mean open times were estimated from the time constant obtained by fitting a single exponential to the open time histogram. Each histogram was constructed from >100 events in a patch at a given test potential, and each plotted point gives the time constant obtained from a single patch. Data were obtained in cell-attached patches exposed extracellularly to high [K+]o solution (either 120 or 60 mM). The solid line was fit according to the equation:formula image where z = equivalent valence, 0.22 e and τ0 = 6.4 ms.
Figure 7
Figure 7
Gating currents measurements. Nonlinear capacitative currents in Kv3.1 (A), Kv2.1 (B), and 5′S5/Kv2.1 (C) were recorded in inside-out patches in the absence of permeant cations (NMG and TEA, respectively, were substituted in the internal and external solutions). The traces illustrate typical recordings obtained at test pulse potentials of −60 to +60 mV (20-mV increments) for Kv3.1, or −80 to +40 mV (20-mV increments) for Kv2.1 and 5′S5/Kv2.1 were applied from a holding potential of −90 mV. Linear components of the leak and capacitative currents were subtracted on-line using a P/−4 protocol (subtraction holding potential = −100 mV). No signal averaging was used. In A and B the first 0.3 ms of the ON and OFF transients are blanked because of imperfect subtraction.
Figure 8
Figure 8
Mutations in 5′S5 selectively affect OFF gating current kinetics. A shows a semilogarithmic plot of the time constant of the major component of Ion decay in Kv2.1 ( filled circles), 5′S5/Kv2.1 (open squares), and Kv3.1 (open triangles) versus test potential. Time constants were obtained by fitting the decay phase of the on-gating current to a biexponential function and at each potential the time constant of the component that accounted for >90% of the decay was selected. Each symbol represents the average of 5–10 patches for each channel. B compares the time course of Ioff decay in peak-normalized Ioff records obtained from Kv3.1 (solid line), 5′S5/Kv2.1 (broken line), and Kv2.1 (dotted line) at a return potential of −90 mV after conditioning steps to produce near maximum activation (+60 mV for Kv3.1, 5′S5/Kv2.1 and +40 mV for Kv2.1). The arrowheads mark the time constants obtained by fitting the traces to monoexponential functions. The average time constants obtained from 5 to 10 membrane patches for each channel was 0.75 ± 0.15, 0.80 ± 0.51, and 8.10 ± 1.39 ms, respectively, in Kv3.1, 5′S5/Kv2.1, and Kv2.1.
Figure 9
Figure 9
Voltage dependence of steady-state activation. Gating charge (A) was obtained from the time integral of Ion and was normalized to the maximal gating charge (Q max). Normalized charge was plotted versus test potential (Q-V) for Kv2.1 ( filled circles), 5′S5/Kv2.1 (open circles), and Kv3.1 ( filled squares). The conductance-voltage (G-V) relationship (B) was obtained by normalizing ionic conductances at each test potential by the maximal conductance. Normalized conductance was plotted for 5′S5/Kv3.1 (open squares), Kv2.1 ( filled circles), Kv3.1 ( filled squares), and 5′S5/Kv2.1 (open circles). Both Q-V and G-V data were fit to single Boltzmann functions (smooth curves). Data were pooled from >5 experiments (patches or oocytes, respectively, in A and B). For Kv2.1 the midpoint (V0.5) potentials were 10 and −25 mV, respectively for the G-V and Q-V curves, whereas V0.5 values for Kv3.1 were 20 and 0.9 mV. The midpoint of the Q-V curve for the 5′S5/Kv2.1 chimera was nearly identical to that of Kv2.1 (V0.5 = −22 mV), but the G-V curve (B; V0.5 = 22 mV) was shifted toward that of Kv3.1. The valence z for the gating charge (obtained from the slope of the Q-V curve) was the same in both Kv2.1 and the 5′S5/Kv2.1 chimera.

References

    1. Aldrich RW, Corey DP, Stevens CF. A reinterpretation of mammalian sodium channel gating based on single channel recording. Nature (Lond) 1983;306:436–441. - PubMed
    1. Aggarwal SK, MacKinnon R. Contribution of the S4 segment to gating charge in the Shaker K+channel. Neuron. 1996;16:1169–1177. - PubMed
    1. Bezanilla F, Perozo E, Stefani E. Gating of Shaker K+channels. II. The components of gating currents and a model of channel activation. Biophys J. 1994;66:1011–1021. - PMC - PubMed
    1. Bezanilla F, Stefani E. Voltage-dependent gating of ionic channels. Annu Rev Biophys Biomol Struct. 1994;23:819–846. - PubMed
    1. Catterall WA. Structure and function of voltage-sensitive ion channels. Science (Wash DC) 1988;242:50–61. - PubMed

Publication types