Origin of genes
- PMID: 9223251
- PMCID: PMC33679
- DOI: 10.1073/pnas.94.15.7698
Origin of genes
Abstract
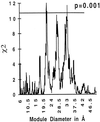
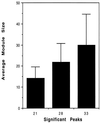
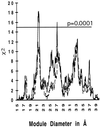
We discuss two tests of the hypothesis that the first genes were assembled from exons. The hypothesis of exon shuffling in the progenote predicts that intron phases will be correlated so that exons will be an integer number of codons and predicts that the exons will be correlated with compact regions of polypeptide chain. These predictions have been tested on ancient conserved proteins (proteins without introns in prokaryotes but with introns in eukaryotes) and hold with high statistical significance. We conclude that introns are correlated with compact features of proteins 15-, 22-, or 30-amino acid residues long, as was predicted by "The Exon Theory of Genes."
Figures


References
-
- Doolittle W F. Nature (London) 1978;272:581–582.
-
- Gilbert W. Cold Spring Harbor Symp Quant Biol. 1987;52:901–905. - PubMed
-
- Palmer J D, Logsdon J M J. Curr Opin Genet Dev. 1991;1:470–477. - PubMed
-
- Cavalier-Smith, C. C. F. (1978) J. Cell Sci. - PubMed
-
- Stoltzfus A, Spencer D F, Zuker M, Logsdon J M J, Doolittle W F. Science. 1994;265:202–207. - PubMed
Publication types
MeSH terms
Grants and funding
LinkOut - more resources
Full Text Sources
Other Literature Sources
Medical

