

Long term trends in the evolution of H(3) HA1 human influenza type A
- PMID: 9223253
- PMCID: PMC33681
- DOI: 10.1073/pnas.94.15.7712
Long term trends in the evolution of H(3) HA1 human influenza type A
Abstract
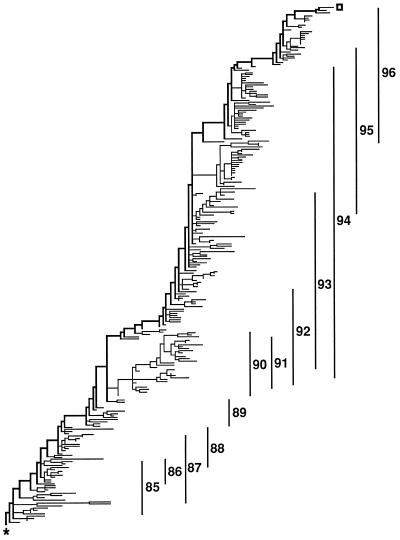
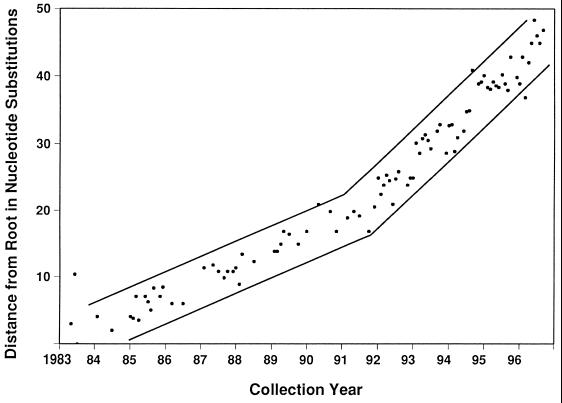
We have studied the HA1 domain of 254 human influenza A(H3N2) virus genes for clues that might help identify characteristics of hemagglutinins (HAs) of circulating strains that are predictive of that strain's epidemic potential. Our preliminary findings include the following. (i) The most parsimonious tree found requires 1,260 substitutions of which 712 are silent and 548 are replacement substitutions. (ii) The HA1 portion of the HA gene is evolving at a rate of 5.7 nucleotide substitutions/year or 5.7 x 10(-3) substitutions/site per year. (iii) The replacement substitutions are distributed randomly across the three positions of the codon when allowance is made for the number of ways each codon can change the encoded amino acid. (iv) The replacement substitutions are not distributed randomly over the branches of the tree, there being 2.2 times more changes per tip branch than for non-tip branches. This result is independent of how the virus was amplified (egg grown or kidney cell grown) prior to sequencing or if sequencing was carried out directly on the original clinical specimen by PCR. (v) These excess changes on the tip branches are probably the result of a bias in the choice of strains to sequence and the detection of deleterious mutations that had not yet been removed by negative selection. (vi) There are six hypervariable codons accumulating replacement substitutions at an average rate that is 7.2 times that of the other varied codons. (vii) The number of variable codons in the trunk branches (the winners of the competitive race against the immune system) is 47 +/- 5, significantly fewer than in the twigs (90 +/- 7), which in turn is significantly fewer variable codons than in tip branches (175 +/- 8). (viii) A minimum of one of every 12 branches has nodes at opposite ends representing viruses that reside on different continents. This is, however, no more than would be expected if one were to randomly reassign the continent of origin of the isolates. (ix) Of 99 codons with at least four mutations, 31 have ratios of non-silent to silent changes with probabilities less than 0.05 of occurring by chance, and 14 of those have probabilities <0.005. These observations strongly support positive Darwinian selection. We suggest that the small number of variable positions along the successful trunk lineage, together with knowledge of the codons that have shown positive selection, may provide clues that permit an improved prediction of which strains will cause epidemics and therefore should be used for vaccine production.
Figures
References
MeSH terms
Substances
Associated data
- Actions
- Actions
- Actions
- Actions
- Actions
- Actions
- Actions
- Actions
- Actions
- Actions
- Actions
- Actions
- Actions
- Actions
- Actions
- Actions
- Actions
- Actions
- Actions
- Actions
- Actions
- Actions
- Actions
- Actions
- Actions
- Actions
- Actions
LinkOut - more resources
Full Text Sources
Other Literature Sources
Research Materials
