. 1997 Jul 22;94(15):7748-55.
doi: 10.1073/pnas.94.15.7748.

Phylogenetics and the origin of species

Affiliations

Phylogenetics and the origin of species

J C Avise et al. Proc Natl Acad Sci U S A. .

Abstract

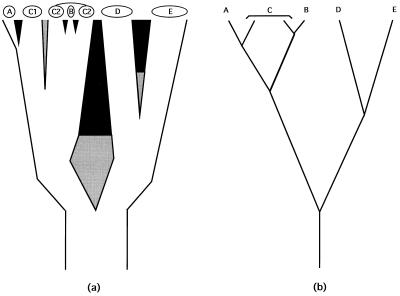
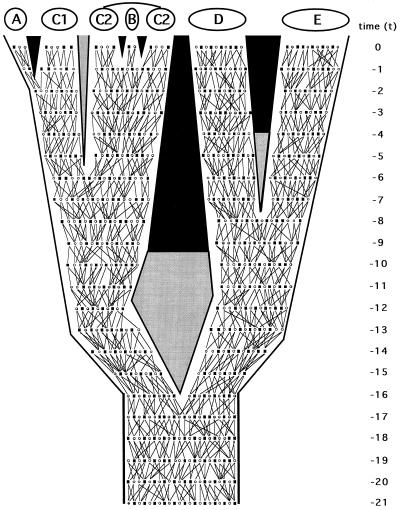
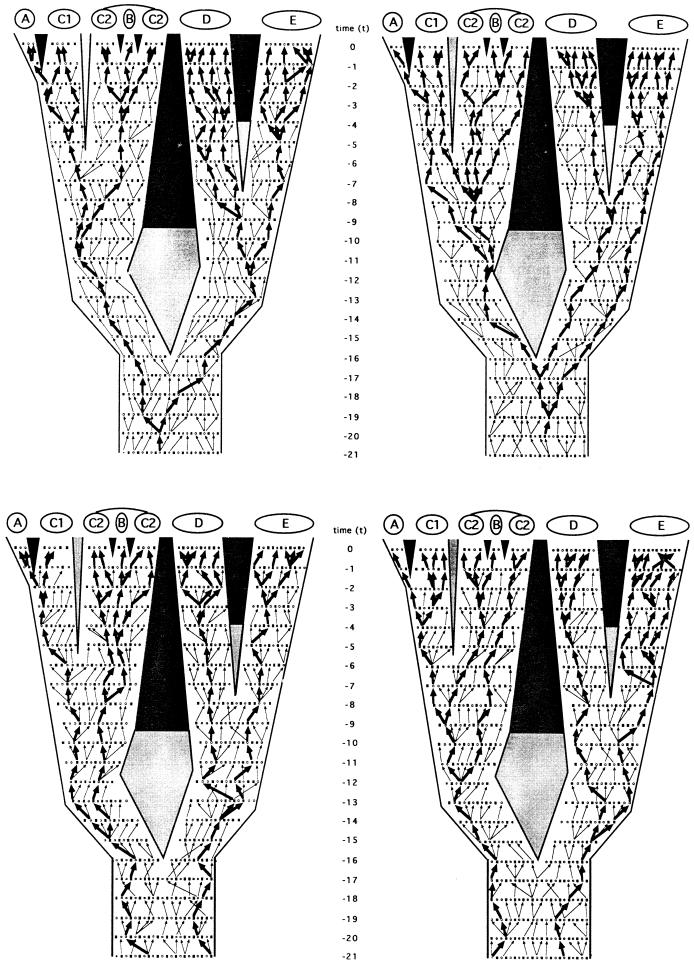
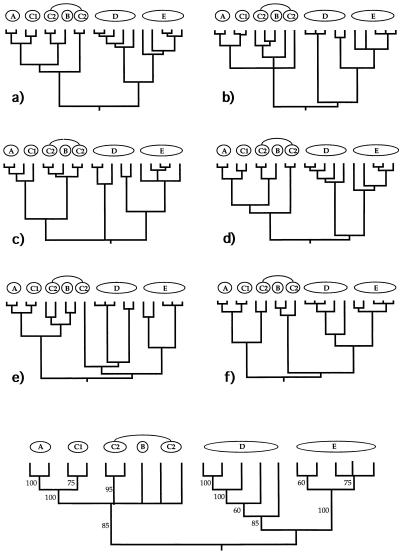
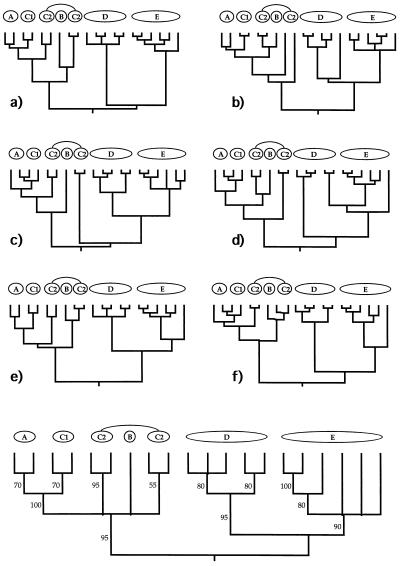
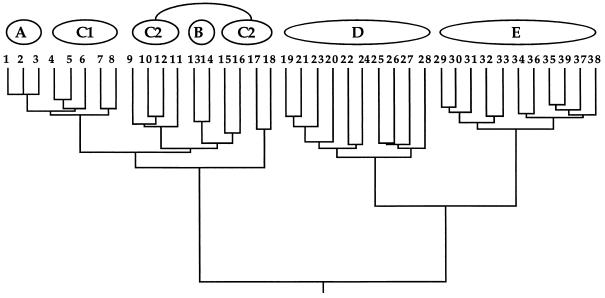
A recent criticism that the biological species concept (BSC) unduly neglects phylogeny is examined under a novel modification of coalescent theory that considers multiple, sex-defined genealogical pathways through sexual organismal pedigrees. A competing phylogenetic species concept (PSC) also is evaluated from this vantage. Two analytical approaches are employed to capture the composite phylogenetic information contained within the braided assemblages of hereditary pathways of a pedigree: (i) consensus phylogenetic trees across allelic transmission routes and (ii) composite phenograms from quantitative values of organismal coancestry. Outcomes from both approaches demonstrate that the supposed sharp distinction between biological and phylogenetic species concepts is illusory. Historical descent and reproductive ties are related aspects of phylogeny and jointly illuminate biotic discontinuity.


Figures

Figure 1
Figure 1
(a) Phylogeny for five biological species (A–E) and two geographically separated populations (C1 and C2) of C. Branch widths are proportional to the populations’ or species’ sizes and also indicate a geographic orientation. Thus, A is a peripheral isolate from C1, and B arose within the range of C2. The sundering agents are intrinsic RIBs (black areas), extrinsic barriers to gene flow (gray areas), or both in temporal order of appearance (gray then black). (b) Simplified “stick” representation of the phylogeny in a.
Figure 2
Figure 2
Same phylogeny as in Fig. 1 but here depicting organismal pedigrees through 21 discrete generations leading to the present. The two lines tracing from each male (▪) or female (○) in any generation identify the parents of that individual. They also describe the geographic dispersal of offspring (which is assumed to be distance-limited) and the mating events.
Figure 3
Figure 3
Identical phylogeny and pedigree to Fig. 2, but here in which the four allelic transmission pathways that are mutually exclusive in every generation have been highlighted by arrows. (Upper Left) Matrilineal pathway reflecting the “F → F → F → F … ” transmission route (e.g., of mtDNA). (Upper Right) Patrilineal pathway reflecting the “M → M → M → M … ” transmission route (e.g., of the Y chromosome). (Lower Left) Generation-to-generation pathway through alternating genders “M → F → M → F… . ” (Lower Right) The reciprocal of the latter, “F → M → F → M… . ” Heavy arrows mark transmission routes through this pedigree that extend to the current generation; light arrows mark the same respective transmission routes that terminated before reaching the extant generation.
Figure 4
Figure 4
Examples of six (af) additional gender-defined allelic transmission pathways (analogous to those in Fig. 3) through the organismal pedigree (Fig. 2). Each genealogy terminated in extant females and, hence, is a “female-tip” gene tree. Lineages that did not coalesce at t − 21 were assumed to do so at t − 22. At the bottom of the figure is a consensus tree for 20 such randomly chosen female-tip genealogies. Numbers on branches indicate the percentage of allelic trees in which that “clade” was found.
Figure 5
Figure 5
Examples of six (af) additional “male-tip” allelic pathways through the organismal pedigree of Fig. 2 and a consensus tree for 20 such randomly chosen male-tip genealogies (see legend to Fig. 4).
Figure 6
Figure 6
Phenogram based on a cluster analysis of the matrix of coancestry coefficients for the 39 extant individuals in the pedigree of Fig. 2. Note the close resemblance of this representation to that of the original pedigree.

References

    1. Dobzhansky T. Genetics and the Origin of Species. New York: Columbia Univ. Press; 1937.
    1. Mayr E. Am Nat. 1940;74:249–278.
    1. Otte D, Endler J A, editors. Speciation and Its Consequences. Sunderland, MA: Sinauer; 1989.
    1. Martin G. Nature (London) 1996;380:666–667.
    1. McKitrick M C, Zink R M. Condor. 1988;90:1–14.

Publication types