. 1997 Jul 22;94(15):8047-51.
doi: 10.1073/pnas.94.15.8047.

Fusion genes resulting from alternative chromosomal translocations are overexpressed by gene-specific mechanisms in alveolar rhabdomyosarcoma

Affiliations

Fusion genes resulting from alternative chromosomal translocations are overexpressed by gene-specific mechanisms in alveolar rhabdomyosarcoma

R J Davis et al. Proc Natl Acad Sci U S A. .

Abstract

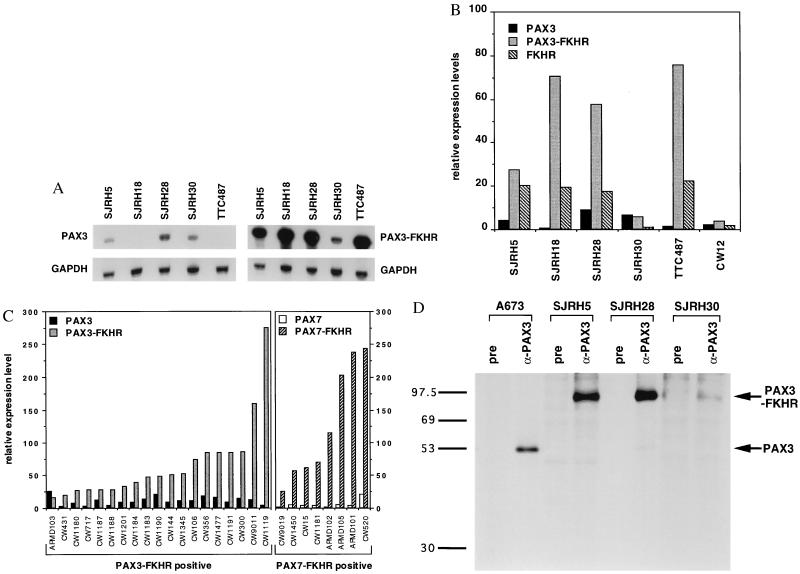
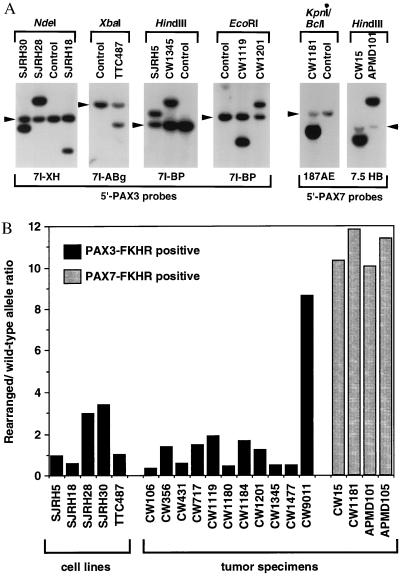
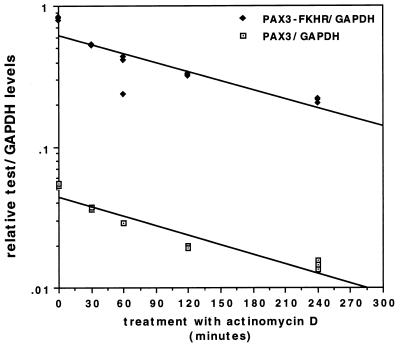
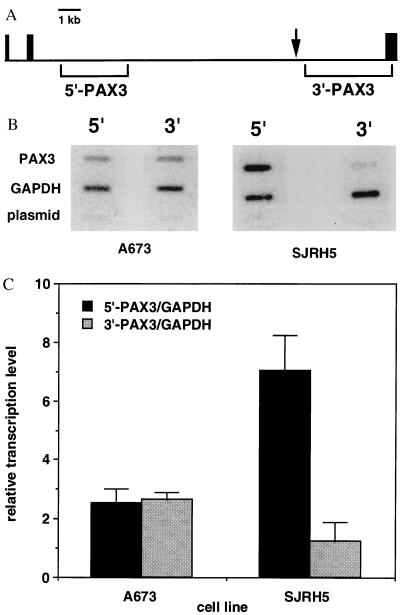
Chromosomal translocations identified in hematopoietic and solid tumors result in deregulated expression of protooncogenes or creation of chimeric proteins with tumorigenic potential. In the pediatric solid tumor alveolar rhabdomyosarcoma, a consistent t(2;13)(q35;q14) or variant t(1;13)(p36;q14) translocation generates PAX3-FKHR or PAX7-FKHR fusion proteins, respectively. In this report, we demonstrate that in addition to functional alterations these translocations are associated with fusion product overexpression. Furthermore, PAX3-FKHR and PAX7-FKHR overexpression occurs by distinct mechanisms. Transcription of PAX3-FKHR is increased relative to wild-type PAX3 by a copy number-independent process. In contrast, PAX7-FKHR overexpression results from fusion gene amplification. Thus, gene-specific mechanisms were selected to overexpress PAX3-FKHR and PAX7-FKHR in alveolar rhabdomyosarcoma, presumably due to differences in regulation between the wild-type loci. We postulate that these overexpression mechanisms ensure a critical level of gene product for the oncogenic effects of these fusions.


Figures

Figure 1
Figure 1
RNase protection (A-C) and immunoprecipitation (D) analyses of ARMS cell lines and tumor specimens. (A) Total RNA (5–10 μg) from the indicated cell lines was hybridized with the indicated [32P]UTP-labeled test and control riboprobes. Shown are equivalent exposures of the PAX3 and PAX3-FKHR protected fragments (Upper) and the corresponding GAPDH-protected fragments (Lower). (B) Relative expression levels of PAX3, PAX3-FKHR, and FKHR transcripts in six t(2;13)-containing cell lines. RNase protection analysis was performed on the indicated cell lines, the protected bands were quantified using a PhosphorImager and normalized for the number of uridines in each antisense riboprobe, and a test RNA/GAPDH RNA ratio was calculated. Results are shown as expression units relative to PAX3 levels in the embryonal rhabdomyosarcoma cell line RD (arbitrarily set to 10 units). Wild-type and fusion transcripts are indicated as: PAX3, black columns; PAX3-FKHR, stippled column; and FKHR, diagonal columns. (C) Relative expression levels of wild-type and fusion transcripts in PAX3-FKHR-positive (Left) or PAX7-FKHR-positive (Right) tumor specimens. Results are shown as in B. Differences in absolute expression levels among tumors may be partly attributed to variable numbers of nontumor cells within the specimens. Wild-type and fusion transcripts are indicated as: PAX3, black columns; PAX3-FKHR, stippled columns; PAX7, open columns; PAX7-FKHR, diagonal columns. (D) Immunoprecipitation analysis. Lysates from the indicated cell lines were incubated with either anti-PAX3 (α-PAX3) or pre-immune (pre) IgG. Immunoprecipitates were collected and resolved by SDS/PAGE. ARMS cell lines with the t(2;13) are SJRH5, SJRH28, and SJRH30. A673 is a peripheral primitive neuroectodermal tumor cell line lacking the t(2;13). Arrows indicate the PAX3 and PAX3-FKHR proteins. The sizes (in kDa) of protein markers are shown to the left.
Figure 2
Figure 2
Quantitative Southern blot analysis of wild-type and rearranged PAX3 and PAX7 alleles. (A) Identification of t(2;13) and t(1;13) rearrangements in cell lines and tumor specimens. The indicated restriction enzymes (above each panel) and hybridization probes (below each panel) were selected to identify the wild-type PAX3 or PAX7 and rearranged PAX3-FKHR or PAX7-FKHR alleles (see Materials and Methods for a description of the probes). The wild-type alleles are indicated by arrowheads. (B) Wild-type and rearranged allele copy numbers. The intensities of the wild-type and rearranged alleles were quantified using a PhosphorImager, and a rearranged to wild-type allele ratio was calculated. The PAX3-FKHR-positive or PAX7-FKHR-positive cell lines and tumors are indicated by black or stippled columns, respectively. Please note that amplification of PAX7-FKHR in case CW15 was not detected in our previous analysis (12); this result can be explained by the presence of additional copies of wild-type FKHR or FKHR-PAX7, which will lower the 3′ to 5′ FKHR signal ratio but will not affect the PAX7-FKHR to PAX7 signal ratio in the current assay.
Figure 3
Figure 3
Stability analysis of PAX3 and PAX3-FKHR transcripts. SJRH28 cells were treated with 10 μg/ml actinomycin D for the indicated times. RNA was isolated, and the level of expression was determined by RNase protection in triplicate. Mock-treatment did not significantly alter RNA expression (data not shown). Results are shown as relative test (PAX3, open box; PAX3-FKHR, closed diamond) to GAPDH ratios.
Figure 4
Figure 4
Nuclear runoff analysis. Nuclei were isolated from A673 and SJRH5, and nuclear transcription was performed with [α-32P]UTP. 32P-labeled RNA was purified and hybridized to linearized plasmids immobilized onto slot blots. (A) PAX3 intron 7/exon 8 sequences used as 5′- and 3′-PAX3 hybridization probes. Exons 6–8 are represented by the black boxes. The 5′-and 3′-PAX3 hybridization probes are indicated by the brackets below the horizontal line. The t(2;13) breakpoint region in SJRH5 is indicated by the arrow. (B) 32P-labeled RNA from A673 lacking the t(2;13) (Left) and SJRH5 containing the t(2;13) (Right) was hybridized to filters containing either 5′-or 3′-PAX3 hybridization probes. Plasmids GAPDH and pBluescript served as internal and negative controls, respectively. (C) Relative transcription levels were determined by normalizing hybridization signals for the number of uridines in the sense strands of the 5′- or 3′-PAX3 hybridization probes and calculating a 5′- or 3′-PAX3 to GAPDH ratio. Averages and standard deviations were calculated from three experiments.

Similar articles

Cited by

References

    1. Rabbitts T H. Nature (London) 1994;372:143–149. - PubMed
    1. Whang-Peng J, Knutsen T, Theil K, Horowitz M E, Triche T. Genes Chromosomes Cancer. 1992;5:299–310. - PubMed
    1. Biegel J A, Meek R S, Parmiter A H, Conard K, Emanuel B S. Genes Chromosomes Cancer. 1991;3:483–484. - PubMed
    1. Barr F G, Galili N, Holick J, Biegel J A, Rovera G, Emanuel B S. Nat Genet. 1993;3:113–117. - PubMed
    1. Galili N, Davis R J, Fredericks W J, Mukhopadhyay S, Rauscher F J, III, Emanuel B S, Rovera G, Barr F G. Nat Genet. 1993;5:230–235. - PubMed

Publication types

MeSH terms