. 1997 Jul 22;94(15):8168-72.
doi: 10.1073/pnas.94.15.8168.

Gene expression from plasmids containing the araBAD promoter at subsaturating inducer concentrations represents mixed populations

Affiliations

Gene expression from plasmids containing the araBAD promoter at subsaturating inducer concentrations represents mixed populations

D A Siegele et al. Proc Natl Acad Sci U S A. .

Abstract

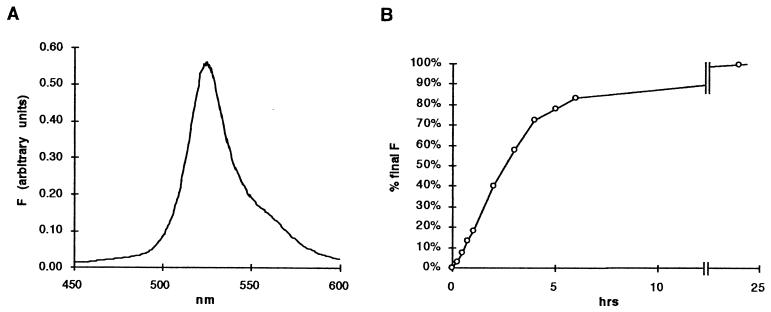
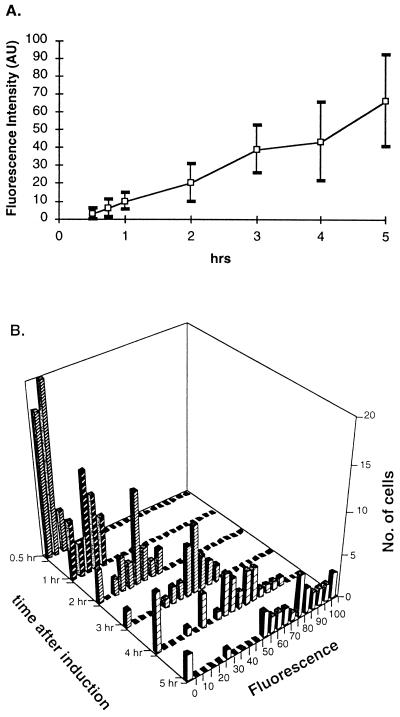
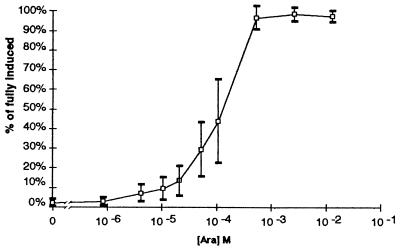
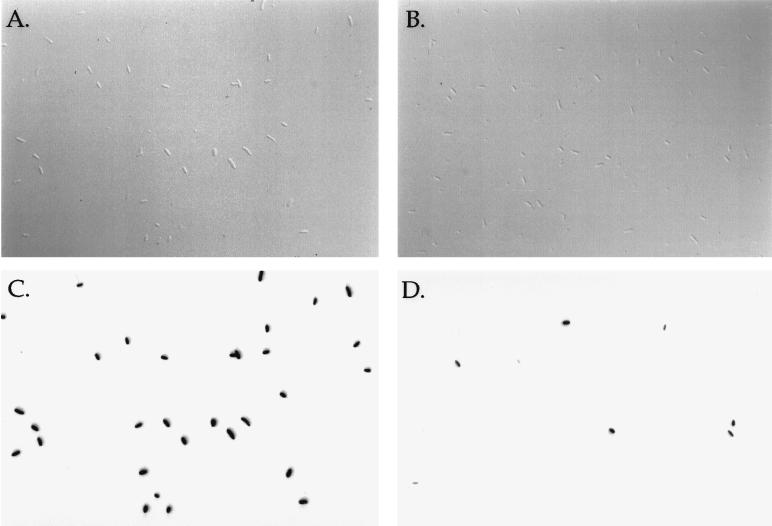
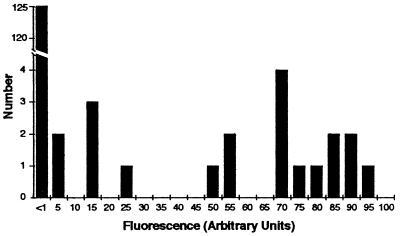
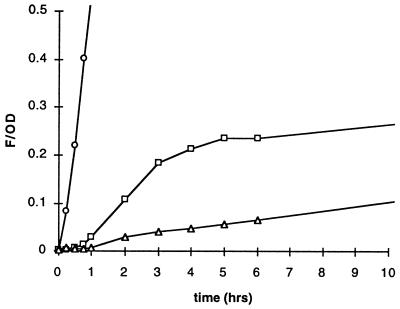
Gene expression from plasmids containing the araBAD promoter can be regulated by the concentration of arabinose in the growth medium. Guzman et al. [Guzman, L.-M., Belin, D., Carson, M. J. & Beckwith, J. (1995) J. Bacteriol. 177, 4121-4130] showed that expression of a cloned gene could be modulated over several orders of magnitude in cultures grown in the presence of subsaturating concentrations of arabinose. We constructed plasmids expressing a fast-folding mutant Aequorea victoria green fluorescent protein from the araBAD promoter to examine the distribution of expressed gene products in individual cells at intermediate induction levels. Microscopic examination of cells grown at low arabinose concentrations shows mixtures of brightly fluorescent and dark cells, suggesting that intermediate expression levels in cultures reflect a population average of induced and uninduced cells. The kinetics of green fluorescent protein induction suggest that this reflects an "autocatalytic" induction mechanism due to accumulation of the inducer by active transport. This mechanism, which is analogous to the induction of the lac operon at subsaturating inducer concentrations in lacY+ cells, was described 40 years ago by Novick and Weiner [Novick, A. & Weiner, M. (1957) Proc. Natl. Acad. Sci. USA 43, 553-566].


Figures

Figure 1
Figure 1
GFP fluorescence measured in cell suspensions. Cultures were grown and samples were prepared as described in Materials and Methods. (A) Emission spectrum for cells containing pDS439 (ParaBAD-GFPmut2) after growth for 6 hr in the presence of 1.33 mM arabinose. The excitation wavelength used was 420 nm. Fluorescence is expressed in arbitrary units. (B) Induction kinetics after addition of arabinose to 1.33 mM.
Figure 2
Figure 2
Induction kinetics in individual cells after addition of arabinose to 1.33 mM. Cultures were grown and samples were prepared as described in Materials and Methods. The fraction of measurably fluorescent cells at each time point was determined by comparing the number of cells visible in scanned fluorescence photomicrographs to the number visible in Nomarski photomicrographs; for each time point 100 to 200 total cells were examined. The fluorescence intensities of 25 to 30 individual bright cells were quantitated as described in Materials and Methods using only well separated cells. Because not every cell in any field was quantitated, the number of dark cells at each time point was calculated (using the fraction of measurably bright cells) as the expected number of cells that would be too faint to be detected by scanning in a population with the observed number of bright cells. Dark cells, which include both completely dark cells and cells that were visibly fluorescent, but too faint to detect by scanning, were assigned an intensity of zero. (A) The average fluorescence intensity at different times after induction. The average fluorescence includes both bright cells and a calculated number of dark cells determined as described above. Error bars indicate one SD above and below the average values at each time point. (B) Histogram showing the distribution of fluorescence intensities for individual cells at each time point.
Figure 3
Figure 3
Dependence of GFP levels on inducer concentration. Cultures were grown in the presence of the indicated concentrations of arabinose for 5 hr as described in Materials and Methods. Fluorescence was measured on suspensions of intact cells as in Fig. 1. Data shown are the average values for three independent experiments. Error bars indicate one SD above and below the average values at each inducer concentration.
Figure 4
Figure 4
Photomicrographs of cells grown in different arabinose concentrations for 5 hr. (A) Sample from high arabinose culture (2.66 mM arabinose) visualized with Nomarski optics. (B) Sample from low arabinose culture (106 μM arabinose) visualized with Nomarski optics. (C) Sample from high arabinose culture (2.66 mM arabinose) visualized with epifluorescent illumination. (D) Sample from low arabinose culture (106 μM arabinose) visualized with epifluorescent illumination. In the high arabinose culture, 79% of the cells were bright. In the low arabinose sample shown, 89% of the cells became bright after addition of arabinose to 6.6 mM (0.1%).
Figure 5
Figure 5
Histogram of the fluorescence intensities of cells in the low arabinose (106 μM) culture. Fluorescence intensities of 145 cells were quantitated based on scanned photomicrographs as described in Materials and Methods and are expressed in arbitrary units. Due to day-to-day fluctuations in lamp intensity, the units in this figure cannot be directly compared with the values shown in Fig. 2.
Figure 6
Figure 6
Kinetics of induction at different arabinose concentrations. GFP fluorescence was measured at the indicated times after addition of arabinose to 1.3 mM (○), 10 μM (□), and 1 μM (▵). Fluorescence was measured for intact cell suspensions as in Fig. 1.

References

    1. Oehler S, Eismann E R, Krämer H, Müller-Hill B. EMBO J. 1990;9:973–979. - PMC - PubMed
    1. Guzman L-M, Belin D, Carson M J, Beckwith J. J Bacteriol. 1995;177:4121–4130. - PMC - PubMed
    1. Novick A, Weiner M. Proc Natl Acad Sci USA. 1957;43:553–566. - PMC - PubMed
    1. Casadaban M J, Cohen S N. J Mol Biol. 1980;138:179–207. - PubMed
    1. Cormack B P, Valdivia R H, Falkow S. Gene. 1996;173:33–38. - PubMed

Publication types

Substances

LinkOut - more resources