. 1997 Jul 22;94(15):8173-8.
doi: 10.1073/pnas.94.15.8173.

Acetylcholinesterase-transgenic mice display embryonic modulations in spinal cord choline acetyltransferase and neurexin Ibeta gene expression followed by late-onset neuromotor deterioration

Affiliations

Acetylcholinesterase-transgenic mice display embryonic modulations in spinal cord choline acetyltransferase and neurexin Ibeta gene expression followed by late-onset neuromotor deterioration

C Andres et al. Proc Natl Acad Sci U S A. .

Abstract

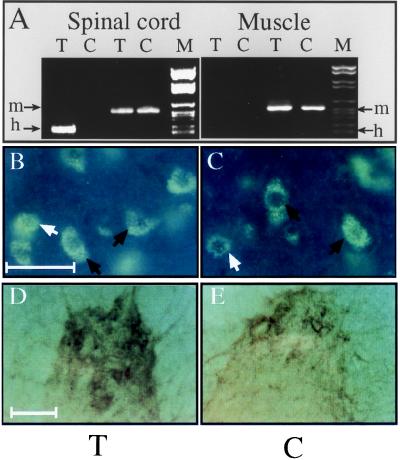
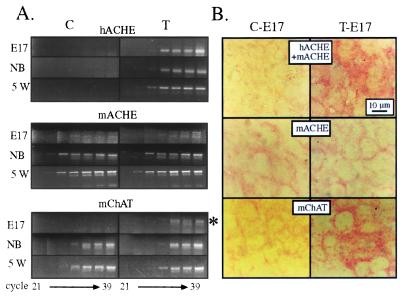
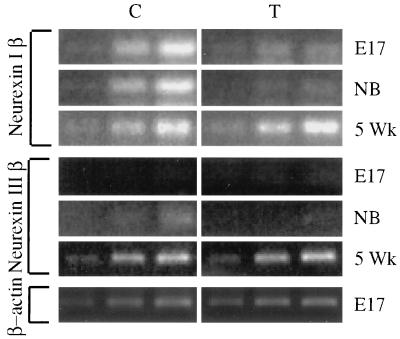
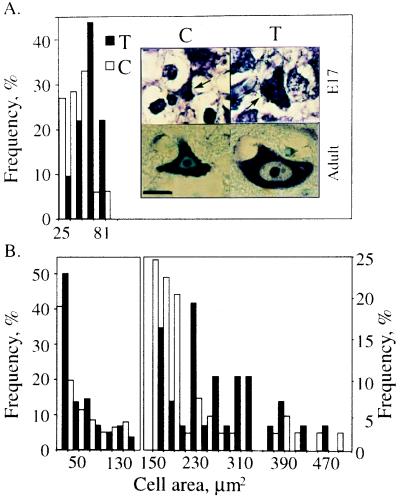
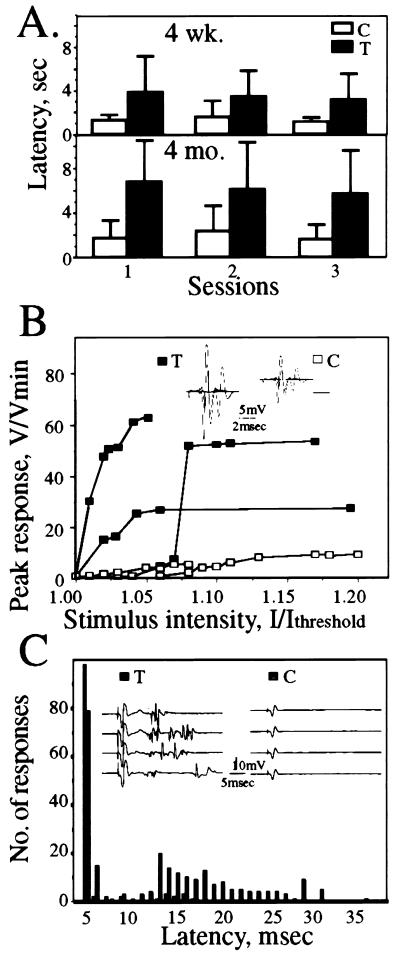
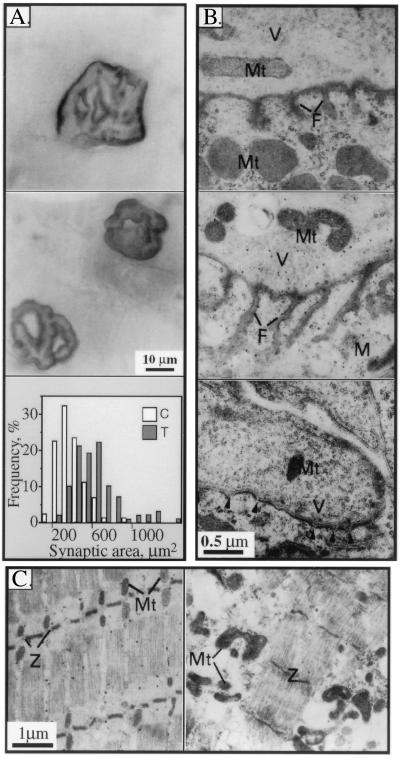
To explore the possibility that overproduction of neuronal acetylcholinesterase (AChE) confers changes in both cholinergic and morphogenic intercellular interactions, we studied developmental responses to neuronal AChE overexpression in motoneurons and neuromuscular junctions of AChE-transgenic mice. Perikarya of spinal cord motoneurons were consistently enlarged from embryonic through adult stages in AChE-transgenic mice. Atypical motoneuron development was accompanied by premature enhancement in the embryonic spinal cord expression of choline acetyltransferase mRNA, encoding the acetylcholine-synthesizing enzyme choline acetyltransferase. In contrast, the mRNA encoding for neurexin-Ibeta, the heterophilic ligand of the AChE-homologous neuronal cell surface protein neuroligin, was drastically lower in embryonic transgenic spinal cord than in controls. Postnatal cessation of these dual transcriptional responses was followed by late-onset deterioration in neuromotor performance that was associated with gross aberrations in neuromuscular ultrastructure and with pronounced amyotrophy. These findings demonstrate embryonic feedback mechanisms to neuronal AChE overexpression that are attributable to both cholinergic and cell-cell interaction pathways, suggesting that embryonic neurexin Ibeta expression is concerted in vivo with AChE levels and indicating that postnatal changes in neuronal AChE-associated proteins may be involved in late-onset neuromotor pathologies.


Figures

Figure 1
Figure 1
Human AChE cDNA is expressed in spinal cord neurons but not muscle. (A) RT-PCR analyses. Primers specific for mouse (m) or human (h) AChE mRNA indicates expression of the transgene in transgenic (T) spinal cord, but not muscle. Control (C) mice express the endogenous mRNA in both tissues. (B and C) In situ hybridization. A probe detecting both mouse and human AChE mRNAs labeled neurons in 50-μm cervical spinal cord sections from both transgenic (B) and control (C) mice. Black arrows indicate large polygonal α motoneurons; white arrows indicate γ motoneurons and/or interneurons. ELF kit 6605 (Molecular Probes) diluted 1:250 was used for detection. (Size bar, 50 μm.) Note that labeling is restricted to cells with neuronal morphology. (D and E) Enzyme activity. Fixed sections from the anterior horn of lumbar spinal cord of transgenic (D) or control (E) mice were cytochemically stained for catalytically active AChE. Note the enhanced activity in nerve fibers and cell bodies from the transgenic spinal cord. (Size bar, 100 μm.)
Figure 2
Figure 2
Transgenic human AChE (hAChE) mRNA expression induces a transient embryonic enhancement in ChAT mRNA levels. (A) RT-PCR analyses. RNA extracted from spinal cord of control (C) and transgenic (T) mice at the noted ages was subjected to kinetic RT-PCR using primers for the noted mRNAs (see Experimental Procedures). Aliquots of amplified DNA representing human (h) or mouse (m) AChE or ChAT mRNAs were removed every third cycle from cycle 21, representing differences of ca. 8-fold between samples. Products were electrophoresed and stained with ethidium bromide. Note that hAChE mRNA is present only in transgenic mice, that endogenous AChE mRNA levels are similar in control and transgenic animals, and that while mChAT levels are undetectable in control E17 embryos, a prominent signal, marked by an asterisk, is observed in transgenic embryos. In postnatal mice, ChAT mRNA levels in transgenic and control spinal cord are indistinguishable. NB, newborn. (B) In situ hybridization. Seven-micrometer sections from the lumbar spinal cord of control (C) and transgenic (T) E17 embryos were subjected to in situ hybridization. Fast-red (Boehringer Mannheim) served for detection. Note the intense AChE and ChAT mRNA signals in transgenic cell bodies.
Figure 3
Figure 3
Neurexin Iβ mRNA is dramatically suppressed in embryonic and newborn transgenic mice. Primers specific for neurexin Iβ and IIIβ mRNAs (see Experimental Procedures) were used in semiquantitative RT-PCR on spinal cord RNA from control (C) and transgenic (T) mice at the noted ages. Note the dramatic reduction in signal intensities for neurexin Iβ in embryonic (E17) and newborn (NB) transgenic mice compared with controls and to 5-week-old (5 Wk) mice. Primers for β-actin mRNA served to verify quantity and quality of RNA in each sample. Shown are PCR products sampled every third cycle (i.e., reflecting 8-fold differences) from cycle 21 for β-actin and cycle 24 for neurexins.
Figure 4
Figure 4
AChE overexpression is associated with enlarged motoneuron perikarya. (A) Embryonic enlargement. Thoracic spinal cord sections from E17 transgenic (T) and control (C) mice were stained with cresyl violet, and the perikaryal areas in μm2 of ventral horn cells measured. Presented are percent fractions of the total number of cresyl violet positive cells in each size group (67 control and 32 transgenic cells were measured). This analysis revealed overall enlargement of neurons in transgenic embryonic spinal cord (P < 0.05). (Inset) Representative cresyl violet-positive control (C) and transgenic (T) neurons from embryonic (E17) and 3-month-old (adult) mice are presented. Note that the enlarged neurons characteristic of transgenic animals maintain the normal polygonal morphology. (Size bar, 10 μm.) Arrows indicate motoneurons. (B) Adult enlargement. Separate size distributions for ventral horn neurons up to 150 μm2 (Left) and larger than 150 μm2 (Right) from adult mice are presented. Smaller cells (202 control and 186 transgenic cells), presumably interneurons and γ-motoneurons, showed similar perikaryal area distributions in transgenic and control animals. In contrast, the larger ventral horn cells, presumably α-motoneurons (44 control and 27 transgenic cells), preserved the embryonic trend of enlarged perikarya observed in transgenic animals (P < 0.02).
Figure 5
Figure 5
Postnatal motor function impairments worsen with age. (A) Grip test performance. Groups of 5–10 mice at the ages of 4 weeks and 4 months [transgenic (T) and control (C)] were suspended with their forelegs on a 3-mm diameter rope and the time taken to securely grip the rope with their hindlegs was noted (latency) (see Experimental Procedures). Presented are escape latencies in seconds (average ± SD). Note the slower performance of transgenics as compared with controls at both age groups and the worsening of this phenotype with age. (B) Electromyographic profiles. Evoked muscle fiber potentials (V/Vmin) after sciatic nerve stimulation were recorded by a microelectrode placed on the surface of the gastrocnemius muscle in three transgenic (▪) and three control (□) mice. (Inset) Superposition of responses evoked by increasing stimulus intensity up to 1.0 mA at 1 Hz as in the enclosed scale. Saturation of response occurred only at high stimulus intensities and required more stimuli in transgenics than in controls. Note that in the transgenic muscle several negative peaks were observed in response to a single stimulus. (C) Delayed repetitive firing of action potentials. After 100 supramaximal stimulations at 1 Hz, abnormal late potentials (filled bars) appeared in four transgenic animals for up to 40 msec poststimulation as compared with a few signals in four control animals (empty bars). Presented are numbers of response spikes as a function of latency time for 10 different measurements.
Figure 6
Figure 6
Enlargement and shape modifications in diaphragm neuromuscular junctions of transgenic animals. (A) NMJ surface changes. Wholemount cytochemical staining of AChE activity was performed on fixed diaphragms from 4-month-old transgenic (Top) and control (Middle) animals. Transgenic NMJs displayed larger circumference and fading boundaries as compared with the complex, sharp contours in controls. Representative endplates from 12 control and transgenic mice. Similar results were obtained using methylene blue staining for total proteins (not shown). (Bottom) Stained areas in μm2 for motor endplates illustrated above (for 90 control, 100 transgenic terminals) are presented as a frequency distribution plot. (B) Postsynaptic fold changes. Electron microscopy of 80-nm crosssections of terminal diaphragm zones reveals variable deformities in NMJ from transgenic mice. (Top) Normal NMJ. (Middle) Transgenic NMJ with exaggerated postsynaptic folds. (Bottom) Transgenic NMJ with short, undeveloped folds marked by arrowheads. V, vesicles; M, muscle; F, postsynaptic folds. (C) Muscle abnormalities. (Left) Longitudinal section from normal diaphragm muscle. Note the organization of mitochondria (Mt) at well-aligned Z bands (Z). (Right) Transgenic diaphragm muscle with fiber atrophy, loss of muscle fiber organization, and swelling of mitochondria at disrupted Z bands.

Similar articles

Cited by

References

    1. Small D H, Reed G, Whitefield B, Nurcombe V. J Neurosci. 1995;15:144–151. - PMC - PubMed
    1. Layer P G, Willbold E. Prog Histochem Cytochem. 1995;29:1–99. - PubMed
    1. Jones S A, Holmes C, Budd T C, Greenfield S A. Cell Tissue Res. 1995;279:323–330. - PubMed
    1. Shapira M, Seidman S, Sternfeld M, Timberg R, Kaufer D, Patrick J, Soreq H. Proc Natl Acad Sci USA. 1994;91:9072–9076. - PMC - PubMed
    1. Seidman S, Sternfeld M, Ben Aziz-Aloya R, Timberg R, Kaufer-Nachum D, Soreq H. Mol Cell Biol. 1995;14:459–473. - PMC - PubMed

Publication types

LinkOut - more resources