. 1997 Jul 28;138(2):255-70.
doi: 10.1083/jcb.138.2.255.

Plasma membrane translocation of fluorescent-labeled phosphatidylethanolamine is controlled by transcription regulators, PDR1 and PDR3

Affiliations

Plasma membrane translocation of fluorescent-labeled phosphatidylethanolamine is controlled by transcription regulators, PDR1 and PDR3

L S Kean et al. J Cell Biol. .

Abstract

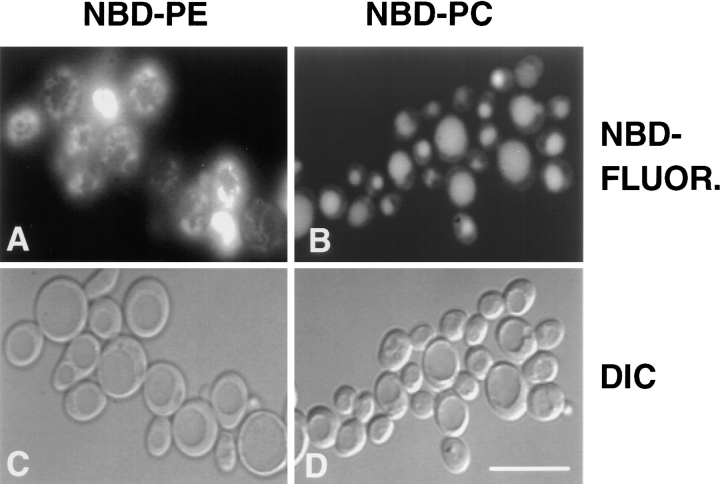
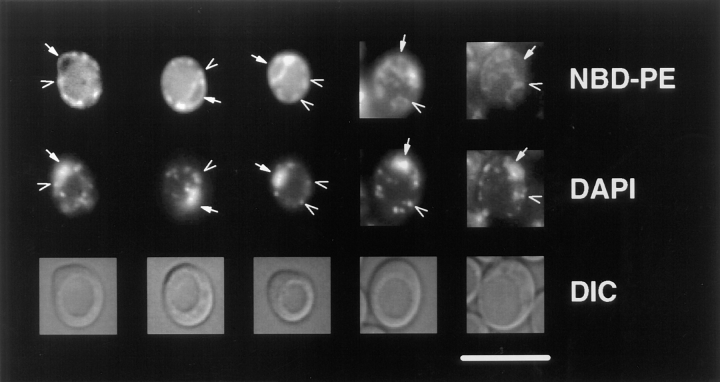
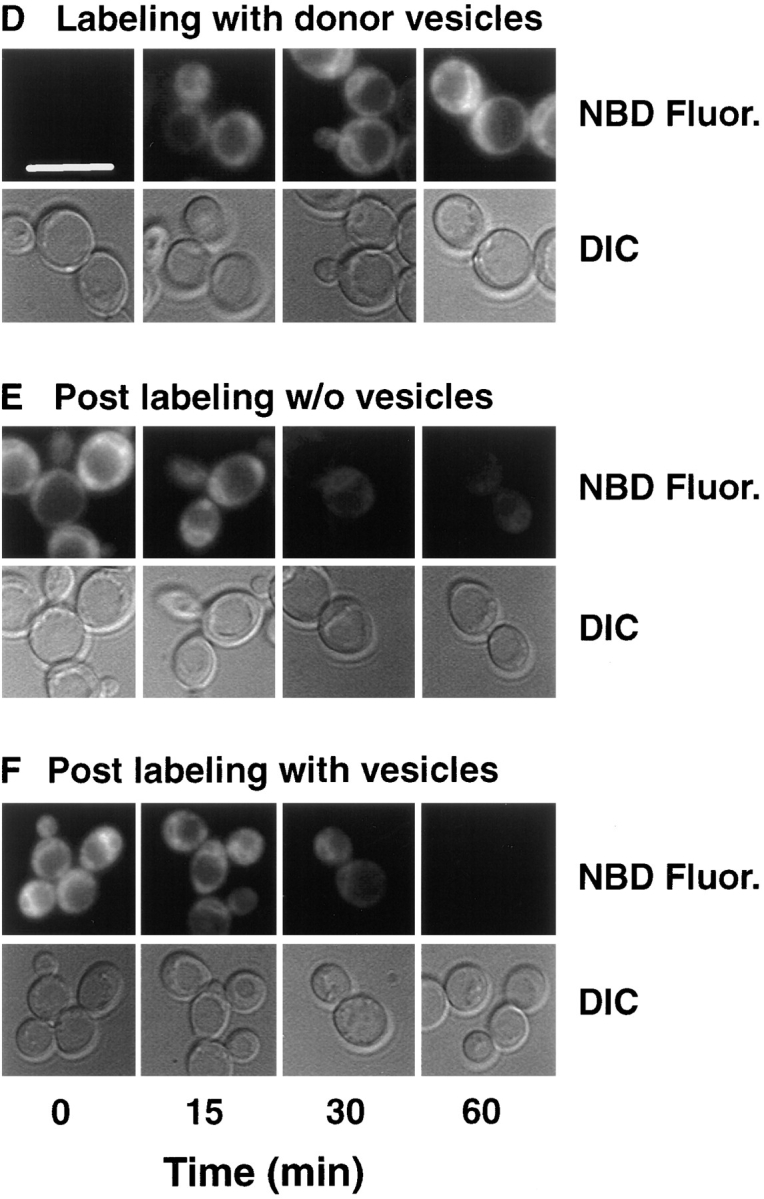
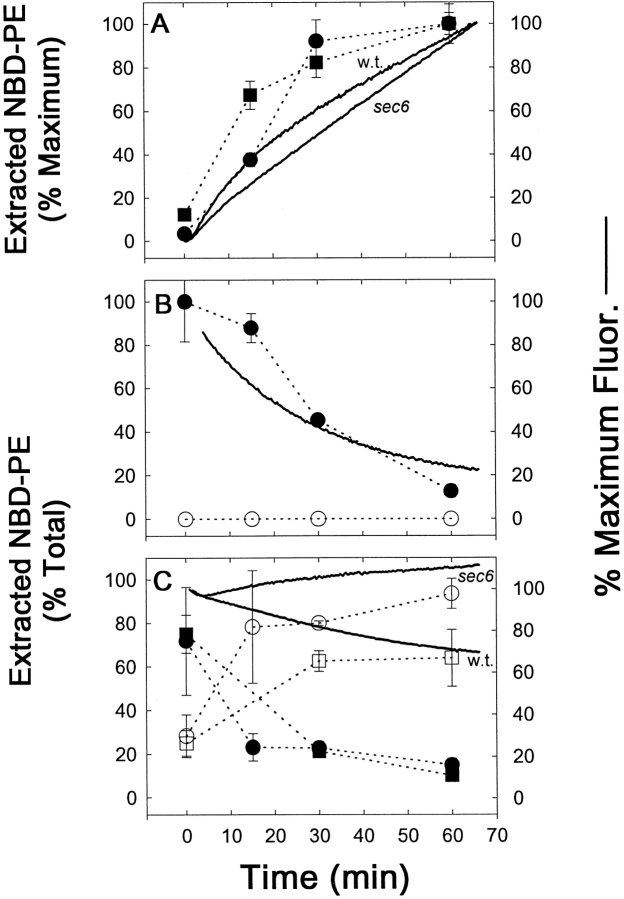
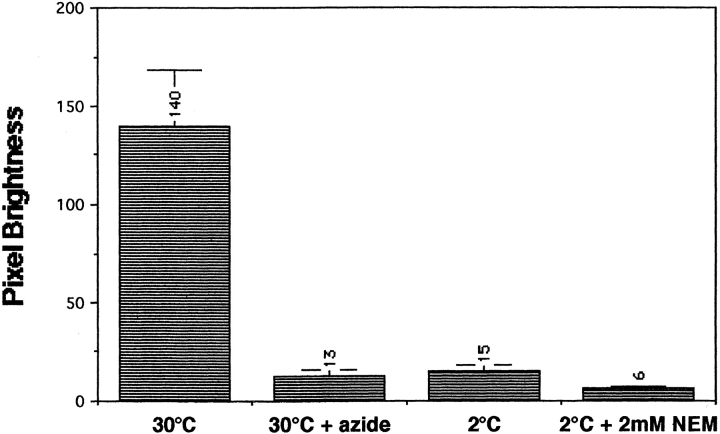
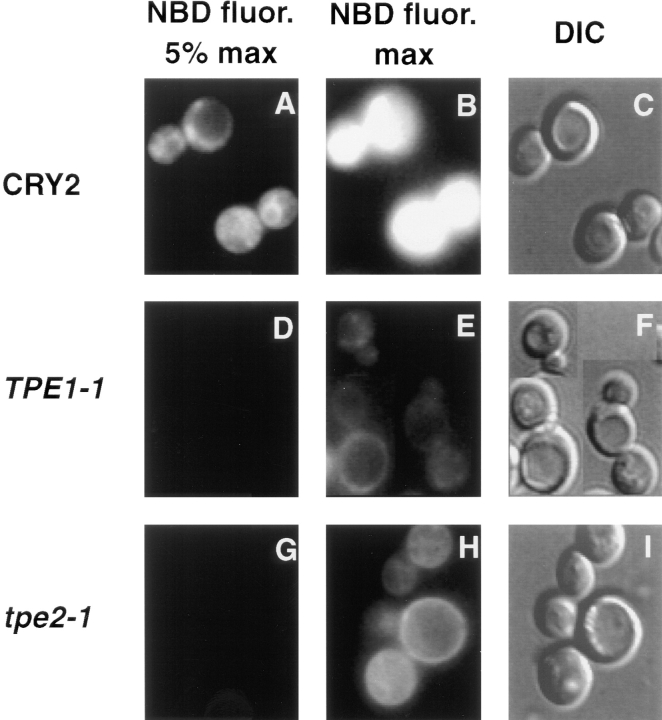
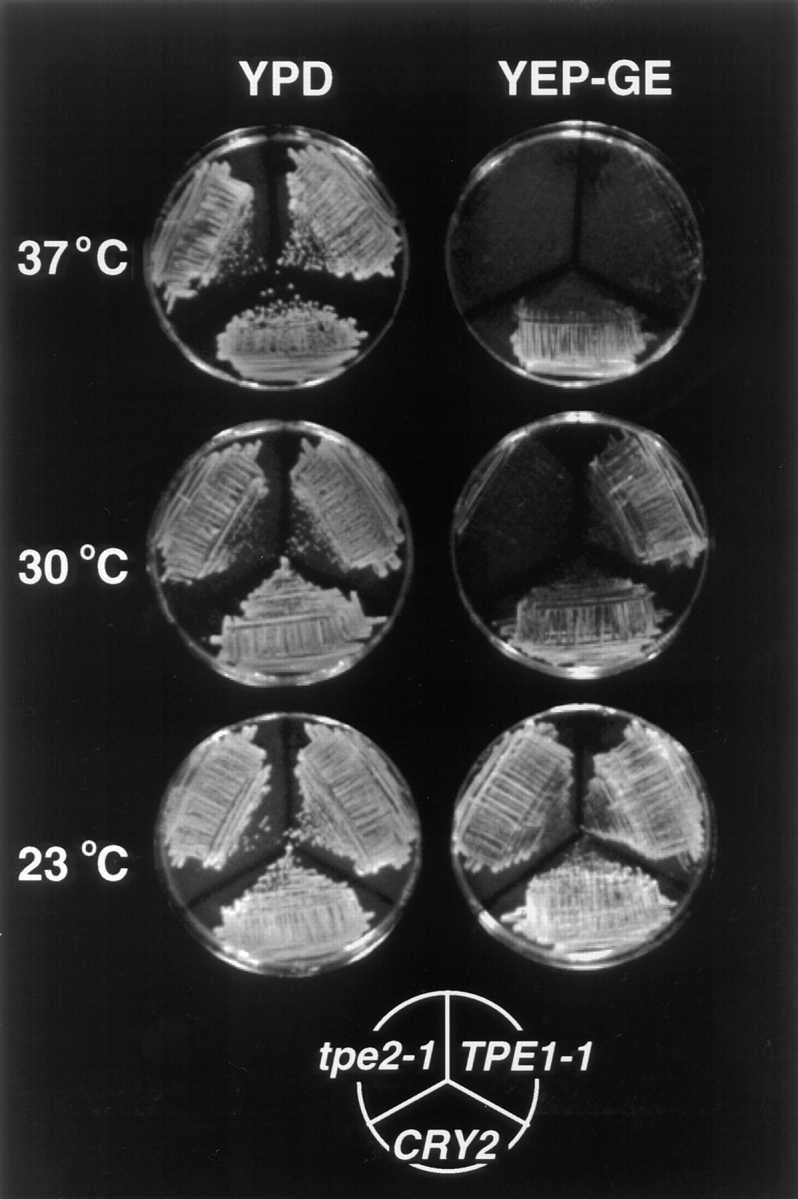
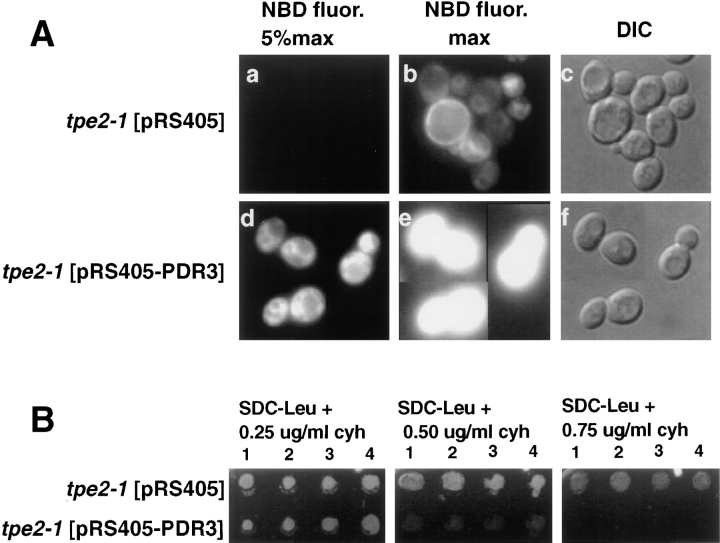
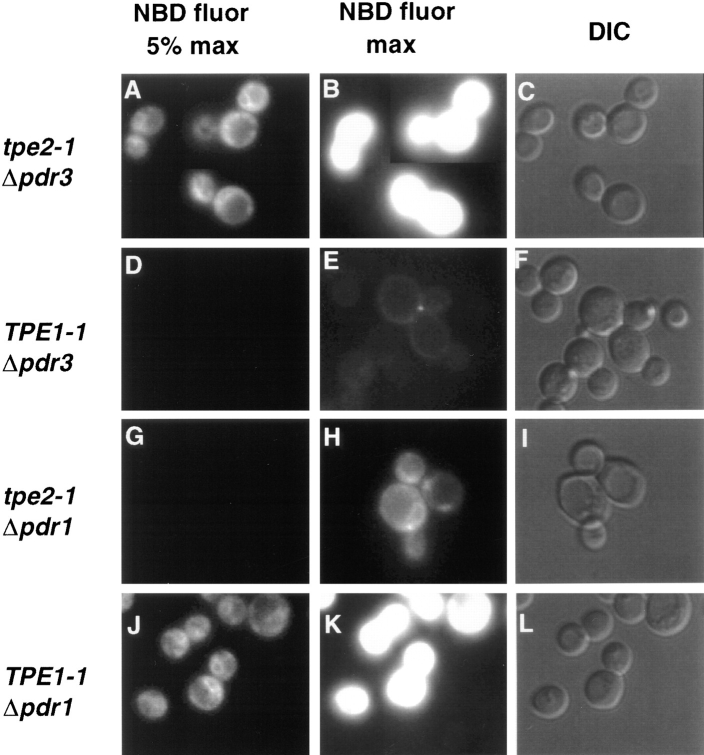
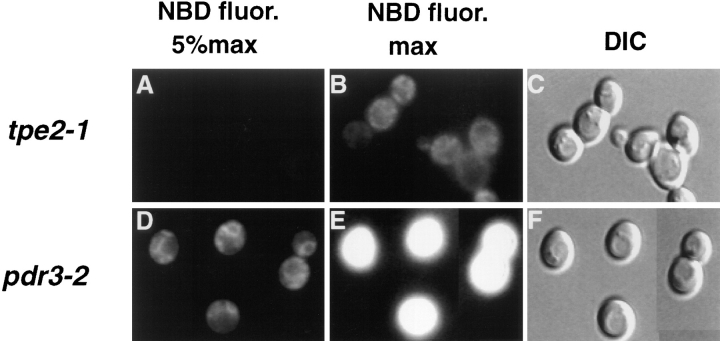
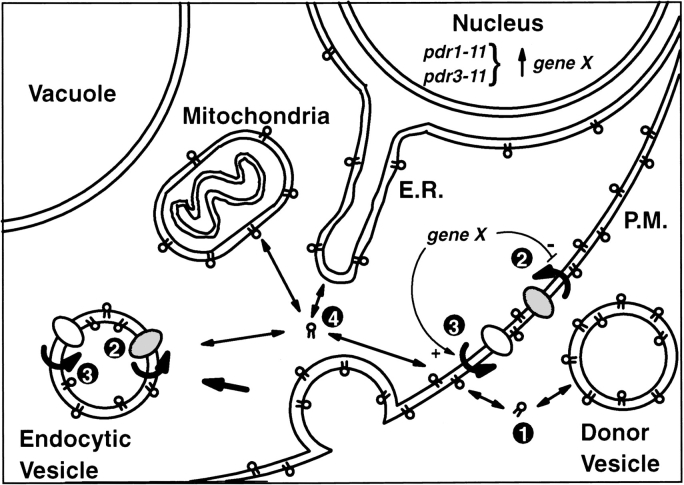
The transcription regulators, PDR1 and PDR3, have been shown to activate the transcription of numerous genes involved in a wide range of functions, including resistance to physical and chemical stress, membrane transport, and organelle function in Saccharomyces cerevisiae. We report here that PDR1 and PDR3 also regulate the transcription of one or more undetermined genes that translocate endogenous and fluorescent-labeled (M-C6-NBD-PE) phosphatidylethanolamine across the plasma membrane. A combination of fluorescence microscopy, fluorometry, and quantitative analysis demonstrated that M-C6-NBD-PE can be translocated both inward and outward across the plasma membrane of yeast cells. Mutants, defective in the accumulation of M-C6-NBD-PE, were isolated by selectively photokilling normal cells that accumulated the fluorescent phospholipid. This led to the isolation of numerous trafficking in phosphatidylethanolamine (tpe) mutants that were defective in intracellular accumulation of M-C6-NBD-PE. Complementation cloning and linkage analysis led to the identification of the dominant mutation TPE1-1 as a new allele of PDR1 and the semidominant mutation tpe2-1 as a new allele of PDR3. The amount of endogenous phosphatidylethanolamine exposed to the outer leaflet of the plasma membrane was measured by covalent labeling with the impermeant amino reagent, trinitrobenzenesulfonic acid. The amount of outer leaflet phosphatidylethanolamine in both mutant strains increased four- to fivefold relative to the parent Tpe+ strain, indicating that the net inward flux of endogenous phosphatidylethanolamine as well as M-C6-NBD-PE was decreased. Targeted deletions of PDR1 in the new allele, PDR1-11, and PDR3 in the new allele, pdr3-11, resulted in normal M-C6-NBD-PE accumulation, confirming that PDR1-11 and pdr3-11 were gain-of-function mutations in PDR1 and PDR3, respectively. Both mutant alleles resulted in resistance to the drugs cycloheximide, oligomycin, and 4-nitroquinoline N-oxide (4-NQO). However, a previously identified drug-resistant allele, pdr3-2, accumulated normal amounts of M-C6-NBD-PE, indicating allele specificity for the loss of M-C6-NBD-PE accumulation. These data demonstrated that PDR1 and PDR3 regulate the net rate of M-C6-NBD-PE translocation (flip-flop) and the steady-state distribution of endogenous phosphatidylethanolamine across the plasma membrane.


Figures

Figure 1
Figure 1
M-C6-NBD-PC and M-C6-NBD-PE are sorted to different organelles in yeast. The diploid strain CRY3 was grown to mid-log phase in SDC medium at 30°C and incubated with donor vesicles containing 58 mol% DOPC, 2 mol% N-Rh-DOPE, and either 40 mol% M-C6-NBD-PC or 40 mol% M-C6-NBD-PE at 30°C for 2 h (M-C6-NBD-PC) or 1 h (M-C6-NBD-PE). Microscopy was performed as described in Materials and Methods. (A and C) Cells incubated with M-C6-NBD-PE. (B and D) Cells incubated with M-C6-NBD-PC. (A and B) NBD fluorescence. (C and D) Differential interference contrast (DIC) optics. The identification of organelles colocalizing with M-C6-NBD-PE fluorescence is shown in Fig. 2. Bar: 10 μm.
Figure 2
Figure 2
M-C6-NBD-PE is sorted to the mitochondria and nuclear envelope from the yeast plasma membrane. CRY3 was grown to mid-log phase in SDC medium at 30°C and incubated with M-C6-NBD-PE–containing vesicles for 1 h as described in Materials and Methods. Colocalization of NBD fluorescence with DAPI fluorescence of nuclear and mitochondrial DNA was performed by including 2.5 μg/ml DAPI with the M-C6-NBD-PE–containing vesicles. Top row, NBD fluorescence; middle row, DAPI fluorescence; bottom row, DIC optics. Solid arrows point to nuclear envelope (NBD fluorescence) and nuclear DNA (DAPI fluorescence); open arrows point to mitochondria (NBD fluorescence) and mitochondrial DNA (DAPI fluorescence). Bar, 10 μm.
Figure 3
Figure 3
Cellular M-C6-NBD-PE influx and efflux measured by fluorescence microscopy, fluorometry, and quantitative TLC. CRY2 was grown to mid-log phase in SDC medium at 30°C. NY17 (sec6-4) was grown to mid-log in SDC at room temperature (∼23°C). The sec6-4 cells were warmed to 37°C for 30 min before labeling with M-C6-NBD-PE and were treated identically to the CRY2 cells as described below with the exception that they were maintained at 37°C during influx and efflux instead of 30°C. CRY2 cells were pelleted and resuspended in SDC + 2% sorbitol at OD600 = 0.16. Labeling of cells was initiated by the addition of M-C6-NBD-PE–containing donor vesicles (vesicle phospholipid concentration, 50 μM). A 2-ml aliquot was immediately placed in a stirred fluorometer cuvette at 30°C and NBD fluorescence (excitation, 475 nm; emission, 530 nm) was recorded continuously. The remainder were placed in a shaker incubator at 30°C. Aliquots were removed at the indicated times and washed three times in SCNaN3. A small aliquot was removed for fluorescence microscopy and the remainder were extracted, separated by TLC, and quantified by digital imaging of the M-C6-NBD-PE fluorescent spots. After 1 h, the remaining labeled cells were washed three times in ice-cold SDC + 2% sorbitol. Measurement of M-C6-NBD-PE in the cells and medium post labeling was initiated by returning the cells to 30°C in the shaker incubator in the presence or absence of unlabeled DOPC vesicles (50 μM). 2-ml aliquots were removed and placed in the fluorometer for continuous recording as above. Aliquots were removed at the indicated times for fluorescence microscopy, TLC separation and quantification as described above. (A and D) Labeling in the presence of M-C6-NBD-PE donor vesicles. (B and E) Post labeling in the absence of acceptor vesicles. (C and F) Post labeling in the presence of acceptor vesicles. Images in D–F are of CRY2 cells only. The appearance of the sec6-4 cells were similar and are not shown. Solid lines are fluorometer traces adjusted to 100% of maximum signal. Filled symbols refer to extracted, cell-associated M-C6-NBD-PE; open symbols refer to the M-C6-NBD-PE extracted from the supernatant. Circles, CRY2; squares, sec6-4. Bar, 10 μm.
Figure 3
Figure 3
Cellular M-C6-NBD-PE influx and efflux measured by fluorescence microscopy, fluorometry, and quantitative TLC. CRY2 was grown to mid-log phase in SDC medium at 30°C. NY17 (sec6-4) was grown to mid-log in SDC at room temperature (∼23°C). The sec6-4 cells were warmed to 37°C for 30 min before labeling with M-C6-NBD-PE and were treated identically to the CRY2 cells as described below with the exception that they were maintained at 37°C during influx and efflux instead of 30°C. CRY2 cells were pelleted and resuspended in SDC + 2% sorbitol at OD600 = 0.16. Labeling of cells was initiated by the addition of M-C6-NBD-PE–containing donor vesicles (vesicle phospholipid concentration, 50 μM). A 2-ml aliquot was immediately placed in a stirred fluorometer cuvette at 30°C and NBD fluorescence (excitation, 475 nm; emission, 530 nm) was recorded continuously. The remainder were placed in a shaker incubator at 30°C. Aliquots were removed at the indicated times and washed three times in SCNaN3. A small aliquot was removed for fluorescence microscopy and the remainder were extracted, separated by TLC, and quantified by digital imaging of the M-C6-NBD-PE fluorescent spots. After 1 h, the remaining labeled cells were washed three times in ice-cold SDC + 2% sorbitol. Measurement of M-C6-NBD-PE in the cells and medium post labeling was initiated by returning the cells to 30°C in the shaker incubator in the presence or absence of unlabeled DOPC vesicles (50 μM). 2-ml aliquots were removed and placed in the fluorometer for continuous recording as above. Aliquots were removed at the indicated times for fluorescence microscopy, TLC separation and quantification as described above. (A and D) Labeling in the presence of M-C6-NBD-PE donor vesicles. (B and E) Post labeling in the absence of acceptor vesicles. (C and F) Post labeling in the presence of acceptor vesicles. Images in D–F are of CRY2 cells only. The appearance of the sec6-4 cells were similar and are not shown. Solid lines are fluorometer traces adjusted to 100% of maximum signal. Filled symbols refer to extracted, cell-associated M-C6-NBD-PE; open symbols refer to the M-C6-NBD-PE extracted from the supernatant. Circles, CRY2; squares, sec6-4. Bar, 10 μm.
Figure 4
Figure 4
M-C6-NBD-PE transport in yeast is ATP-, temperature- and NEM-sensitive. Cells were treated with SCNaN3 medium (to deplete ATP stores), low temperature, or NEM as described in Materials and Methods. M-C6-NBD-PE internalization assays, fluorescence microscopy, and pixel brightness analysis were then performed as described in Materials and Methods. At least 20 cells were analyzed to determine the mean pixel brightness for each condition. These numeric values are shown above each column.
Figure 5
Figure 5
tpe mutants are inhibited in the accumulation of M-C6-NBD-PE. TPE1-1 and its Tpe+ parent strain, CRY2, were grown to mid-log phase at 23°C. The incubation temperature was then shifted to 37°C for 30 min, and M-C6-NBD-PE internalization assays were performed for 1 h before microscopic analysis as described in Materials and Methods. (A–C) CRY2. (D–F) TPE1-1. (G–I) tpe2-1. (A, B, D, E, G, and H) NBD fluorescence. (C, F, and I) DIC optics. In A and D, a neutral density filter was used that attenuated the excitatory light by 95%. In B and E, the filter was removed to allow 100% of the excitatory light to impinge upon the sample.
Figure 6
Figure 6
TPE1-1 and tpe2-1 display temperature-sensitive growth defects on nonfermentable carbon sources. TPE1-1, tpe2-1, and CRY2 were plated on rich media containing both a fermentable carbon source (2% glucose) (YPD), or the nonfermentable carbon sources glycerol (2%) and ethanol (2%) (YEP-GE). Plates were incubated for 2 d (30° and 37°C plates) or 4 d (23°C) before photography.
Figure 7
Figure 7
Complementation of tpe2-1 by PDR3. The tpe2-1 strain LKY161 was transformed with either the plasmid pRS405 alone or the pRS405 plasmid containing the PDR3, pRS405-PDR3. Four transformants from each transformation were grown to mid-log phase in SDC medium lacking leucine at 23°C. (A) 1 ml of each culture was incubated at 30°C for 30 min, and M-C6-NBD-PE internalization assays and fluorescence microscopy were performed as described in Materials and Methods. (a–c) tpe2-1 transformed with vector pRS405 alone. (d–f) tpe2-1 transformed with pRS405-PDR3. (a, b, d, and e) NBD fluorescence. (c and f) DIC optics. In a and d, a neutral density filter was used that attenuated the excitatory light by 95%. In b and e, the neutral density filter was removed to allow 100% of the excitatory light to reach the samples. The M-C6-NBD-PE accumulation of the cells shown in this figure are representative of that observed for all four transformants analyzed. (B) 5 μl of each culture was spotted onto SDC plates lacking leucine and containing 0 (not shown), 0.25, 0.50, or 0.75 μg/ml cycloheximide and incubated at 30°C for 3 d.
Figure 8
Figure 8
Deletion of PDR1 in TPE1-1 and PDR3 in tpe2-1 suppresses their M-C6-NBD-PE accumulation defect. Strains were grown to mid-log phase in SDC medium at 23°C. 1 ml of each culture was incubated at 37°C for 30 min and M-C6-NBD-PE internalization assays and fluorescence microscopy were performed as described in Materials and Methods. (A–C) tpe2-1 Δpdr3. (D–F) TPE1-1 Δpdr3. (G–I) tpe2-1 Δpdr1. (J–L) TPE1-1 Δpdr1. (A, B, D, E, G, H, J, and K) NBD fluorescence. (C, F, I, and L) DIC optics. In A, D, G, and J, a neutral density filter was used that attenuated the excitatory light by 95%. In B, E, H, and K, the neutral density filter was removed to allow 100% of the excitatory light to reach the samples.
Figure 9
Figure 9
The inhibition of M-C6-NBD-PE accumulation by mutations in PDR3 is allele specific. pdr3-2 and tpe2-1/pdr3-11 strains were grown to mid-log phase in SDC medium at 23°C. 1 ml of each culture was incubated at 37°C for 30 min and M-C6-NBD-PE internalization assays and fluorescence microscopy were performed as described in Materials and Methods. (A–C) tpe2-1/pdr3-11. (D–F) pdr3-2. (A, B, D, and E) NBD fluorescence. (C and F) DIC optics. In A and D, a neutral density filter was used that attenuated the excitatory light by 95%. In B and E, the neutral density filter was removed to allow 100% of the excitatory light to reach the samples.
Figure 10
Figure 10
Schematic model for the regulation of M-C6-NBD-PE flip-flop and sorting.

Similar articles

Cited by

References

    1. Alani E, Cao L, Kleckner N. A method for gene disruption that allows repeated use of URA3selection in the construction of multiply disrupted yeast strains. Genetics. 1987;116:541–545. - PMC - PubMed
    1. Ames BN, Dubin DT. The role of polyamines in the neutralization of bacteriophage deoxyribonucleic acid. J Biol Chem. 1960;235:769–775. - PubMed
    1. Balasubramanian K, Gupta CM. Transbilayer phosphatidylethanolamine movements in the yeast plasma membrane. Evidence for a protein-mediated, energy-dependent mechanism. Eur J Biochem. 1996;240:798–806. - PubMed
    1. Balzi E, Goffeau A. Genetics and biochemistry of yeast multidrug resistance. Biochim Biophys Acta. 1994;1187:152–162. - PubMed
    1. Balzi E, Goffeau A. Yeast multidrug resistance: the PDR network. J Bioenerg Biomembr. 1995;27:71–76. - PubMed

Publication types

MeSH terms

Substances