. 1997 Aug;110(2):119-33.
doi: 10.1085/jgp.110.2.119.

Functional expression of Drosophila para sodium channels. Modulation by the membrane protein TipE and toxin pharmacology

Affiliations

Functional expression of Drosophila para sodium channels. Modulation by the membrane protein TipE and toxin pharmacology

J W Warmke et al. J Gen Physiol. 1997 Aug.

Abstract

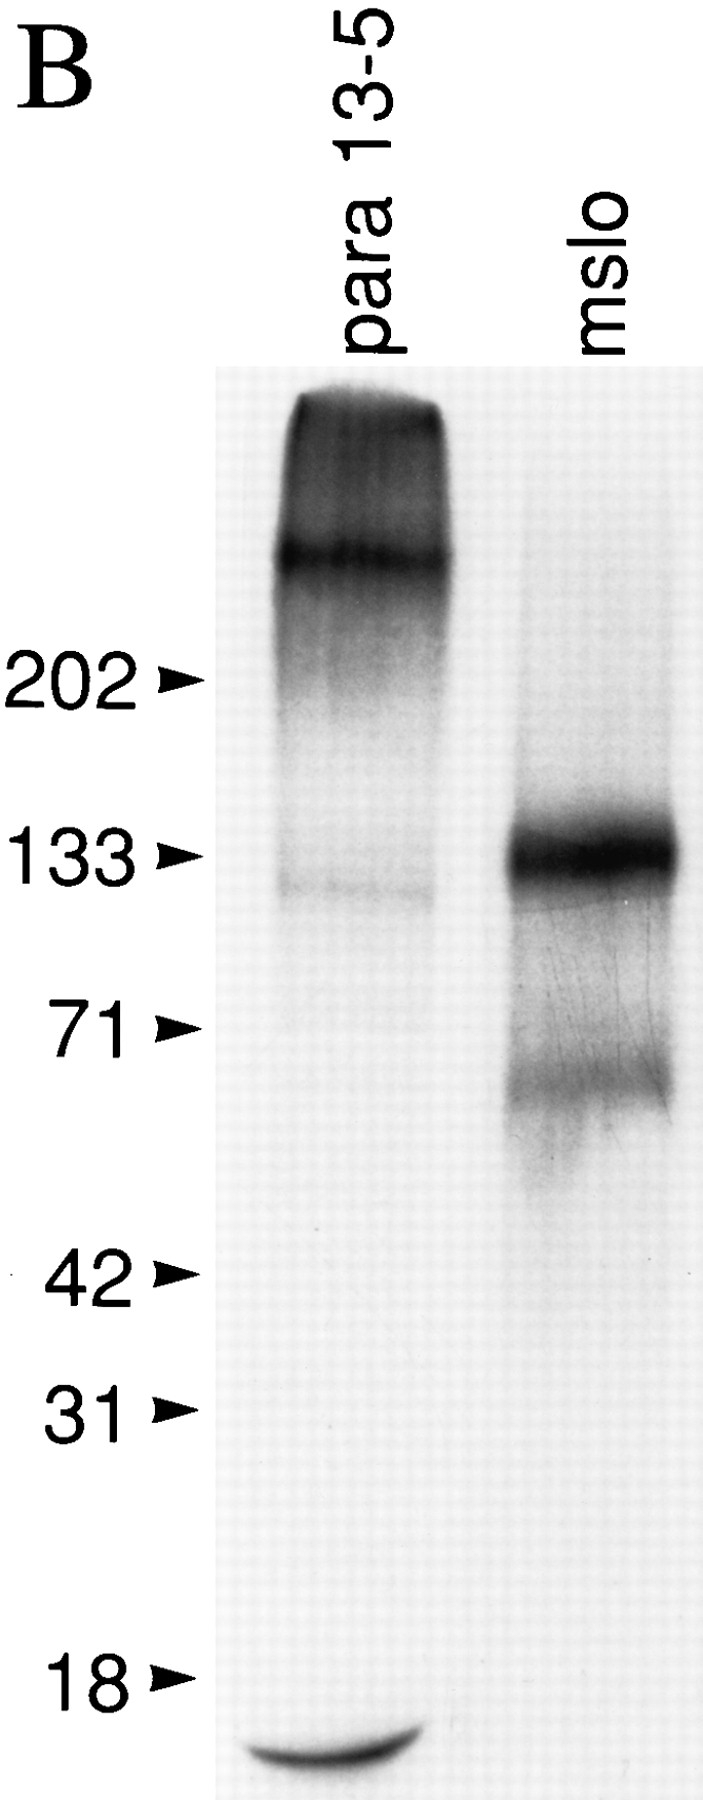
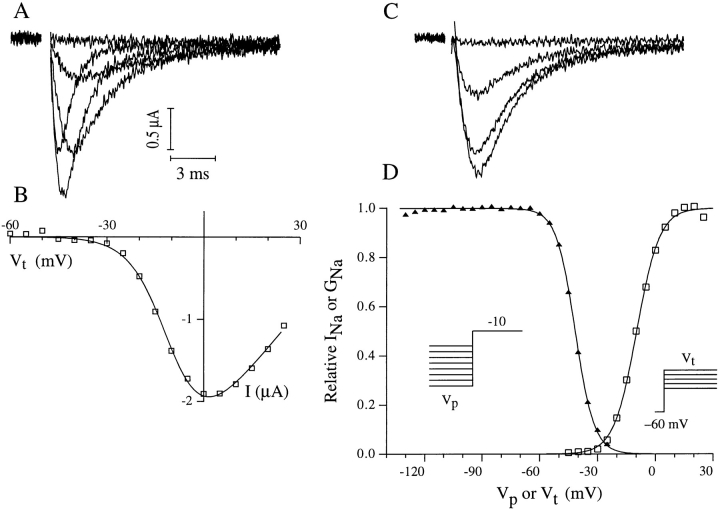
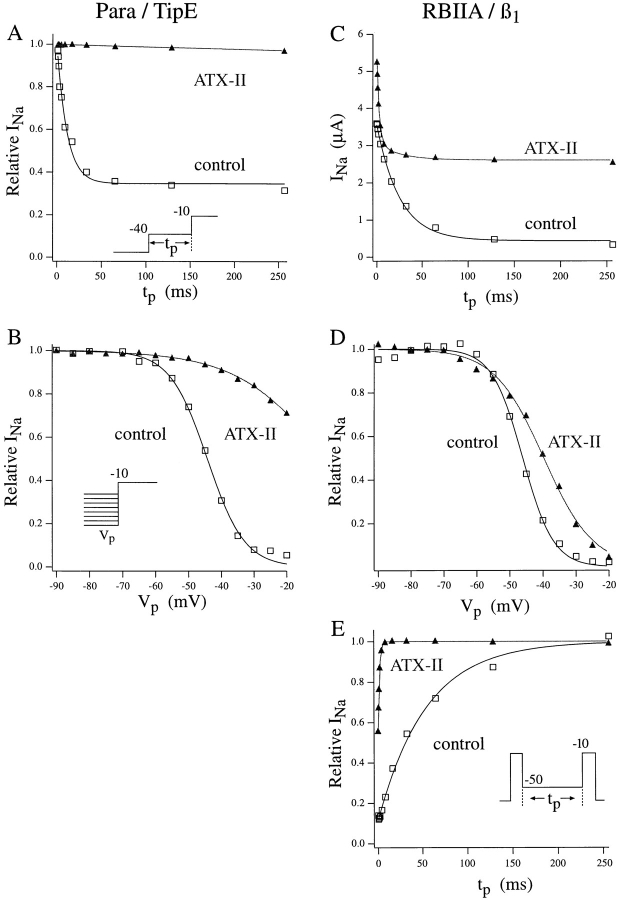
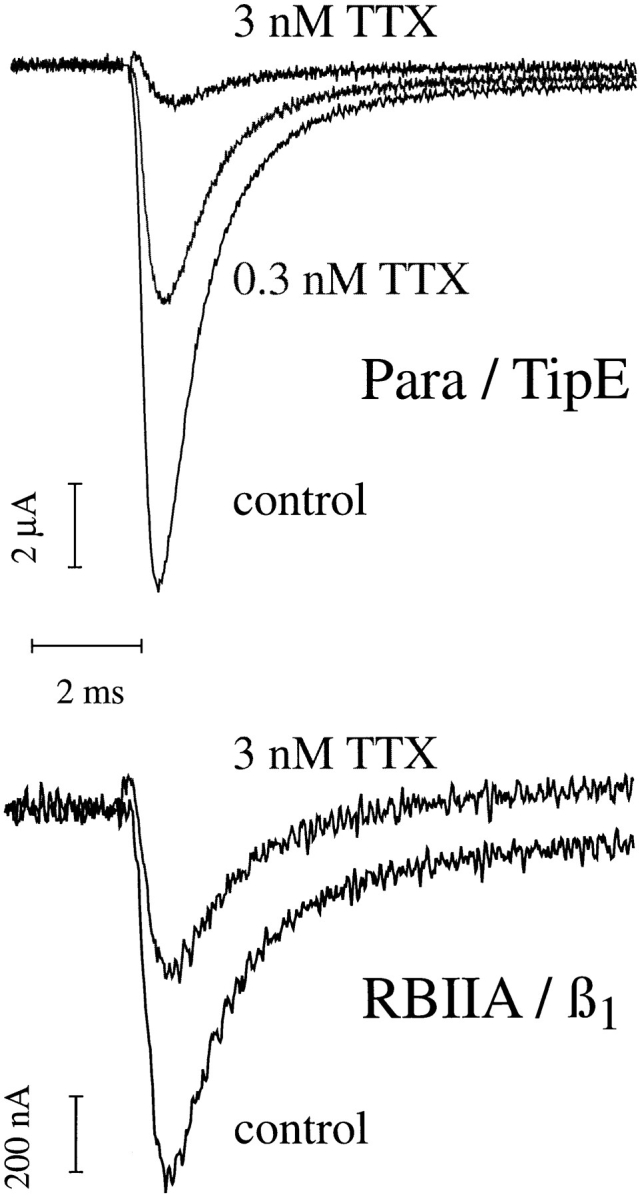
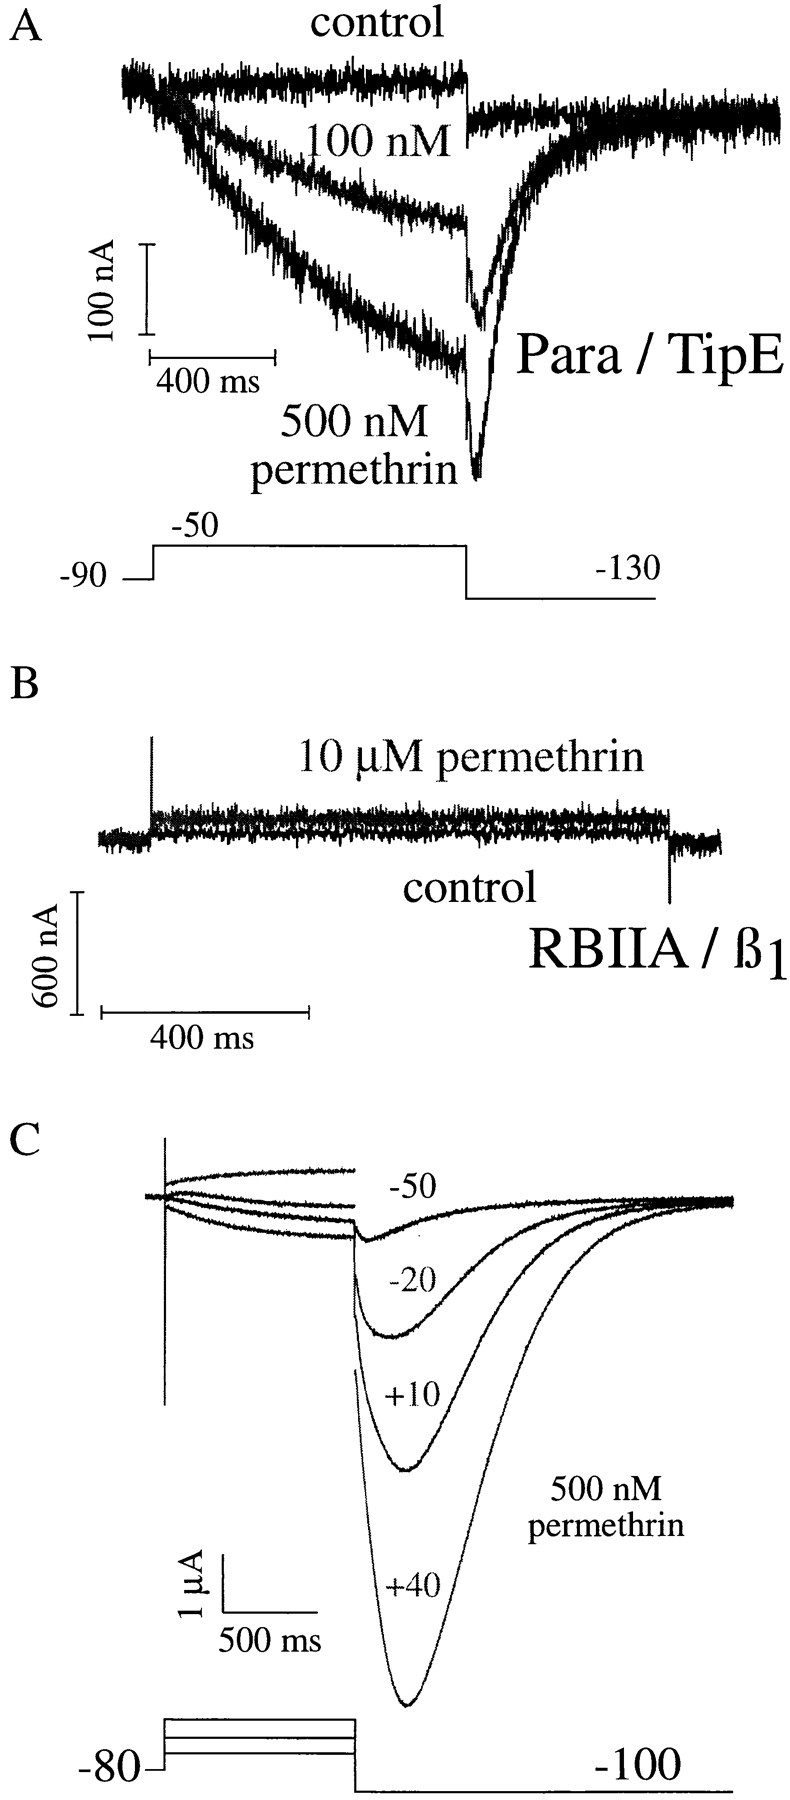
The Drosophila para sodium channel alpha subunit was expressed in Xenopus oocytes alone and in combination with tipE, a putative Drosophila sodium channel accessory subunit. Coexpression of tipE with para results in elevated levels of sodium currents and accelerated current decay. Para/TipE sodium channels have biophysical and pharmacological properties similar to those of native channels. However, the pharmacology of these channels differs from that of vertebrate sodium channels: (a) toxin II from Anemonia sulcata, which slows inactivation, binds to Para and some mammalian sodium channels with similar affinity (Kd congruent with 10 nM), but this toxin causes a 100-fold greater decrease in the rate of inactivation of Para/TipE than of mammalian channels; (b) Para sodium channels are >10-fold more sensitive to block by tetrodotoxin; and (c) modification by the pyrethroid insecticide permethrin is >100-fold more potent for Para than for rat brain type IIA sodium channels. Our results suggest that the selective toxicity of pyrethroid insecticides is due at least in part to the greater affinity of pyrethroids for insect sodium channels than for mammalian sodium channels.


Figures

Figure 1
Figure 1
Drosophila para sodium channel cDNAs. (A) Construction of a full length para sodium channel cDNA. A schematic representation of the predicted membrane topology of the para voltage-activated sodium channel α subunit approximately proportional to its true length with the cylinders representing probable transmembrane α helices. The approximate location of alternative exons are indicated. The location of the para ZS10.3 cDNA and the PCR fragments used to construct the full length para cDNA clone 13-5 are indicated. The para cDNA clone 13-5 is a composite of the ZS10.3 clone (filled box) and the PCR-generated cDNA clones (open boxes) and was constructed as described in methods. The para 13-5 cDNA contains exons j, i, b, d, e, and lacks exons a and f. The para 13-5 cDNA contains six amino acid substitutions as compared with the previously published sequence apparently due to polymorphisms within and between the Canton-S and Oregon-R strains of Drosophila melanogaster (G1158R, R1296Q, D1300N, L1363F, S1587N, and N1822S). Abbreviations for endonuclease restriction enzymes are B, BamHI; E, EcoRI; H, HindIII; S, SacI; U, StuI; and X, XbaI. The alternative exon j encodes amino acids 50–61, which are omitted in some para isoforms. Amino acid location is according to the complete para amino acid sequence including all known alternative exons (GenBank accession number M32078). (B) In vitro translation of the para voltage-activated sodium channel α subunit. Plasmid DNAs encoding either the para voltage-activated sodium channel α subunit or the mouse high conductance calcium-activated potassium channel α subunit were incubated in a rabbit reticulocyte in vitro transcription/translation reaction in the presence of [35S]methionine, and the products were run directly on a 4–20% SDS/PAGE and autoradiographed as described in methods. The para voltage-activated sodium channel α subunit has a predicted M r of 241 kD and the mouse high conductance calcium-activated potassium channel α subunit has a predicted M r of 135 kD. The position of M r markers are indicted on the left.
Figure 1
Figure 1
Drosophila para sodium channel cDNAs. (A) Construction of a full length para sodium channel cDNA. A schematic representation of the predicted membrane topology of the para voltage-activated sodium channel α subunit approximately proportional to its true length with the cylinders representing probable transmembrane α helices. The approximate location of alternative exons are indicated. The location of the para ZS10.3 cDNA and the PCR fragments used to construct the full length para cDNA clone 13-5 are indicated. The para cDNA clone 13-5 is a composite of the ZS10.3 clone (filled box) and the PCR-generated cDNA clones (open boxes) and was constructed as described in methods. The para 13-5 cDNA contains exons j, i, b, d, e, and lacks exons a and f. The para 13-5 cDNA contains six amino acid substitutions as compared with the previously published sequence apparently due to polymorphisms within and between the Canton-S and Oregon-R strains of Drosophila melanogaster (G1158R, R1296Q, D1300N, L1363F, S1587N, and N1822S). Abbreviations for endonuclease restriction enzymes are B, BamHI; E, EcoRI; H, HindIII; S, SacI; U, StuI; and X, XbaI. The alternative exon j encodes amino acids 50–61, which are omitted in some para isoforms. Amino acid location is according to the complete para amino acid sequence including all known alternative exons (GenBank accession number M32078). (B) In vitro translation of the para voltage-activated sodium channel α subunit. Plasmid DNAs encoding either the para voltage-activated sodium channel α subunit or the mouse high conductance calcium-activated potassium channel α subunit were incubated in a rabbit reticulocyte in vitro transcription/translation reaction in the presence of [35S]methionine, and the products were run directly on a 4–20% SDS/PAGE and autoradiographed as described in methods. The para voltage-activated sodium channel α subunit has a predicted M r of 241 kD and the mouse high conductance calcium-activated potassium channel α subunit has a predicted M r of 135 kD. The position of M r markers are indicted on the left.
Figure 5
Figure 5
ATX-II slows the rate of inactivation of Para/TipE, Para, and rat brain IIA/β1 sodium channels. (Left column) ATX-II greatly slows inactivation of Para/TipE sodium channels. (A) Sodium currents measured at −10 mV with and without 20 and 100 nM ATX-II and in 60 nM TTX. Sodium currents were measured with a two-microelectrode voltage clamp; holding potential, −45 mV; extracellular sodium, 20 mM; blanking interval, 660 μs. (B) Peak sodium current plotted as a function of V t. Control, □; +100 nM ATX-II, ▴. Control reverse potential (Erev) = +44.0 mV; Erev = +37.3 mV in ATX-II. For B, C, E, F, H and I, control data is indicated by □, those in toxin are indicated by ▴, and the solid curves indicate the best fit by a Boltzmann distribution with a linear single channel current-voltage relationship. (C) Sodium conductance vs. V t for the same experiment shown in (B). Note that ATX-II increases the maximal GNa with little change in the voltage dependence of opening. Control Boltzmann distribution: slope factor = 9.32 mV, midpoint potential = −18.7 mV, maximal GNa = 5.41 μS; +ATX-II: slope factor = 8.03 mV, midpoint potential = −20.2 mV, maximal GNa = 9.44 μS. (Center column) ATX-II effects Para expressed without TipE in the same way as Para/TipE. (D) Sodium currents measured at 0 mV with and without 1 μM ATX-II. Note that the time to peak current in toxin is >10 ms, indicating that channel activation is not complete at the time of control peak inward current. Similar results were obtained with Para/TipE in 1 μM ATX-II. Blanking interval, 400 μs. (E) Peak sodium current plotted as a function of V t. E rev = +47.6 mV in ATX-II. Erev = +48.7 mV for control assuming a linear single channel current–voltage relationship. (F) Sodium conductance vs. V t for the same experiment shown in D and E. Control Boltzmann distribution: slope factor = 5.89 mV, midpoint potential = −9.8 mV, maximal GNa = 47.2 μS; +ATX-II: slope factor = 6.31 mV, midpoint potential = −15.2 mV, maximal GNa = 122.5 μS. (Right column) ATX-II slows inactivation of RBIIA/β1 sodium channels to a lesser extent. (G) Sodium currents measured at +20 mV with and without 1.0 μM ATX-II. Each current record is fitted by the sum of two exponentials (with fast and slow time constants of decay, τf and τs) plus a constant. Control: τf = 0.289 ms; τs = 5.59 ms; +ATX-II: τf = 2.33 ms; τs = 30.78 ms. (H) Peak sodium current plotted as a function of V t. E rev = +47.3 mV for control; E rev = +46.3 mV in ATX-II. (I ) Sodium conductance vs. V t for the same experiment shown in H. Note that ATX-II causes channel opening at more negative voltages with little change in maximal GNa. Control Boltzmann distribution: slope factor = 6.11 mV, midpoint potential = −18.6 mV, maximal GNa = 178 μS; +ATX-II: slope factor = 5.27 mV, midpoint potential = −26.6 mV, maximal GNa = 206 μS.
Figure 2
Figure 2
Voltage dependence of activation and inactivation of Para/TipE sodium channels expressed in a Xenopus oocyte. (A) Superimposed current records measured at test potentials (V t) of −50, −30, −20, −10, +5, 15, 25, 35, and 50 mV from a holding potential of −90 mV. Blanking interval, 200 μs. (B) Peak sodium current plotted as a function of Vt. The reversal potential (+28 mV in this experiment) was highly variable, presumably reflecting variation in intracellular sodium concentration. Values up to +45 mV were observed. (C) Sodium currents measured at 10 mV from prepulse potentials (V p) of −95, −70, −55, −45, −35, and −25 mV. Prepulse duration, 200 ms; blanking interval, 100 μs. (D) Voltage dependence of steady state availability and of activation of sodium current. Both sets of data are based on measurements of peak current during a test depolarization for the same experiment shown in the top panels. Both curves are the best fit by a Boltzmann distribution. The steady state availability data represents normalized measurements of peak inward current (▪) and is plotted vs. V p. The curve is defined by a slope factor = 5.89 mV, midpoint potential = −49.2 mV, and maximal current = 1.66 μA. The relative sodium conductance (GNa) is calculated assuming a linear current–voltage relationship with a reversal potential of +28 mV (□). The curve is based on data for V t ⩽ +20 mV; slope factor = 6.12 mV, midpoint potential = −14.3 mV, and maximal GNa = 68.4 μS.
Figure 3
Figure 3
Voltage dependence of activation and of inactivation of Para sodium channels expressed in a Xenopus oocyte without TipE. (A) Superimposed current records measured at test potentials (V t) of −35, −20, −10, +5, and 20 mV from a holding potential of −60 mV. Blanking interval, 640 μs. (B) Peak sodium current plotted as a function of V t. The solid curve is the best fit by a Boltzmann distribution and linear current–voltage relationship, as described in (D). (C) Sodium currents measured at −10 mV from prepulse potentials (V p) of −70, −50, −40, and −25 mV. Prepulse duration, 200 ms; blanking interval, 420 μs. (D) Voltage dependence of steady state availability and of activation of sodium current, determined in the same manner as for Fig. 2. Both curves are the best fit by a Boltzmann distribution. The steady state availability data represents normalized measurements of peak inward current (▴) and is plotted vs. V p. The curve is defined by a slope factor = 4.77 mV, midpoint potential = −41.8 mV, and maximal current = 1.61 μA. The relative sodium conductance (GNa) is calculated assuming a linear current–voltage relationship with a reversal potential of +48.7 mV (□). The curve is defined by a slope factor = 5.85 mV, midpoint potential = −9.8 mV, and maximal GNa = 47.2 μS. All panels are for the same experiment using a two-microelectrode voltage clamp.
Figure 4
Figure 4
Para/TipE sodium channels inactivate more rapidly than rat brain IIA/β1 or para sodium channels. (A) Coexpression of para and tipE results in sodium currents that inactivate rapidly, but coexpression of rat brain IIA α and β1 results in sodium currents that inactivate with a biexponential time course. The amplitude of the slowly decaying component is fairly variable but typically ∼30% of the peak inward current. Current records from two experiments are superimposed; the amplitude of the Para/ TipE current is scaled up by 2.50. (B) TipE does not function as a β1 subunit in association with a mammalian neuronal sodium channel. Current records from three experiments are superimposed with the amplitudes scaled so that peak inward currents are equal. The time course of sodium currents due to expression of RBIIA is unaffected by coexpression with TipE, but coexpression with β1 results in much faster inactivation. Scale factors: 6.63 for RBIIA α; 5.89 for RBIIA α plus TipE. (C) Para sodium currents decay more rapidly when coexpressed with TipE. The time constant of decay of sodium current (τdecay) is plotted as a function of V t. The decay of each sodium current measurement was fit by a single exponential plus a constant. Each data point represents the mean of at least five experiments, except for two-microelectrode experiments with V t < −20 mV. Para/TipE sodium currents were measured with both the cut-open (□) and two-microelectrode (▴) voltage clamp techniques. The error bars indicate the SEM. Only (−SEM) is indicated for two-microelectrode measurements and only (+SEM) is indicated for cut-open oocyte measurements. Para sodium currents were measured with only the two-microelectrode technique (▪) and the error bars indicate ±SEM.
Figure 6
Figure 6
ATX-II modifies the onset and recovery from inactivation of Para/TipE and RBIIA/β1 sodium channels. In all panels, open squares indicate control data, filled triangles indicate data in ATX-II, and measurements were made with a two-microelectrode voltage clamp. (Left) ATX-II slows inactivation of Para/TipE sodium channels during weak depolarizations that cause little channel activation. (A) Onset of inactivation at −40 mV with and without 500 nM ATX-II. The pulse protocol is indicated in the inset. The solid curves indicate the best fit to the equation: relative INa = (A + Be(− t/τ))/(A + B). Control, A = 504 nA, B = 908 nA, τ = 11.3 ms; +ATX-II, A = 0, B = 5.31 μA, τ = 9.5 s. (B) ATX-II modifies the availability of Para/TipE sodium channels. The normalized peak inward current is plotted vs. V p. The solid curves indicate the best fit by a Boltzmann distribution. Control, Imax = 1.48 μA, midpoint potential = −44.3 mV, slope factor = 5.69 mV; +500 nM ATX-II: Imax = 5.52 μA, midpoint potential = −7.7 mV, slope factor = 13.7 mV; prepulse duration = 1 s. This prepulse duration is long enough for a steady state measurement in control, but not in ATX-II (see A). Same experiment as shown in A. (Right ) Modification of onset and recovery from inactivation of RBIIA/β1 sodium channels by ATX-II. (C) Onset of inactivation at −35 mV with and without 1 μM ATX-II. The solid curves indicate the best fit to INa = A + Bexp(−t/τ1) + Cexp(−t/τ2). Control, A = 0.436 μA, B = 3.18 μA, τ1 = 25.3 ms, C = 0; +ATX-II: A = 2.61 μA, B = 2.64 μA, τ1 = 2.81 ms; C = 0.465 μA, τ2 = 25.3 ms. Extracellular sodium, 20 mM. This result was typical of three experiments; the control rate of inactivation at −35 mV is 21.1 ± 2.6 ms; in 1 μM ATX -II, 18.3 ± 1.7% of the inactivating current decayed at the control rate and the rest decayed ∼10-fold faster (a time constant of 2.34 ± 0.42 ms). (D) Normalized peak inward current vs. prepulse potential. Same pulse protocol as for B, same experiment as for C. The solid curves indicate the best fit by a Boltzmann distribution; control, Imax = 4.45 μA, midpoint potential = −46.1 mV, slope factor = 4.63 mV; +1 μM ATX-II: Imax = 7.20 μA, midpoint potential = −39.7 mV, slope factor = 7.46 mV. (E) ATX-II speeds the recovery from inactivation of RBIIA/β1 sodium channels. The pulse protocol used is shown in the inset. The solid curves indicate the best fit to relative INa = [A + B(1 − exp(−t/τ))]/(A + B). Control, A = 0.313 μA, B = 2.532 μA, τ = 53.7 ms; +2 μM ATX-II, A = 8.189 μA, B = 12.38 μA, τ = 1.61 ms.
Figure 7
Figure 7
Tetrodo-toxin block of Para/ TipE and rat brain IIA/ β1 sodium channels. (Top) Superimposed Para/TipE sodium currents measured at −10 mV with 0, 0.3, and 3.0 nM TTX. Blanking interval, 100 μs. (Bottom), Superimposed RBIIA/ β1 sodium currents measured at −10 mV in 0 and 3 nM TTX. No blanking interval.
Figure 8
Figure 8
Permethrin effects on Para/TipE and rat brain IIA/β1 sodium channels. Sodium currents were measured using a two-microelectrode voltage clamp for both experiments shown in this figure. (A) Permethrin causes opening of Para/TipE sodium channels during long depolarizations to −50 mV. The current deactivates slowly when the membrane is repolarized to −130 mV, with a rising phase, or hook, on the tail currents. Maximal peak inward current (at V t = −15 mV), 3.2 μA; sampling interval, 1.0 ms. (B) 10 μM permethrin does not have a similar effect on RBIIA/β1 sodium channels. No effects were seen at other test potentials. Maximal peak inward current (at V t = −5 mV), 4.43 μA. (C) Modification of Para/TipE by 500 nM permethrin increases with test pulse voltage. Same experiment as shown in A. Depolarizations to the indicated voltages elicited currents that activated and inactivated rapidly, as for control, followed by slowly activating currents that were seen only with permethrin. The rapidly inactivating currents are not accurately measured with the sampling interval of 1.0 ms used for this experiment.

Similar articles

Cited by

References

    1. Adams ME, Olivera M. Neurotoxins: overview of an emerging research technology. Trends Neurosci. 1994;17:151–155. - PubMed
    1. Arena JP, Liu KK, Paress PS, Cully DF. Avermectin-sensitive chloride currents incuded by Caenorhabditis elegans RNA in Xenopusoocytes. Mol Pharmacol. 1991;40:368–374. - PubMed
    1. Arena JP, Liu KK, Paress PS, Schaeffer JM, Cully DF. Expression of a glutamate-activated chloride current in Xenopus oocytes injected with Caenorhabditis elegans RNA: evidence for modulation with avermectin. Mol Brain Res. 1992;15:339–348. - PubMed
    1. Baden DG. Brevetoxins: unique polyether dinoflagellate toxins. FASEB J. 1989;3:1807–1817. - PubMed
    1. Bergman C, Dubois JM, Rojas E, Rathmayer W. Decreased rate of sodium conductance inactivation in the node of Ranvier induced by a polypeptide toxin from sea anemone. Biochim Biophys Acta. 1976;455:173–184. - PubMed

Publication types

MeSH terms