. 1997 Aug;110(2):185-200.
doi: 10.1085/jgp.110.2.185.

NO3--induced pH changes in mammalian cells. Evidence for an NO3--H+ cotransporter

Affiliations

NO3--induced pH changes in mammalian cells. Evidence for an NO3--H+ cotransporter

C W Chow et al. J Gen Physiol. 1997 Aug.

Abstract

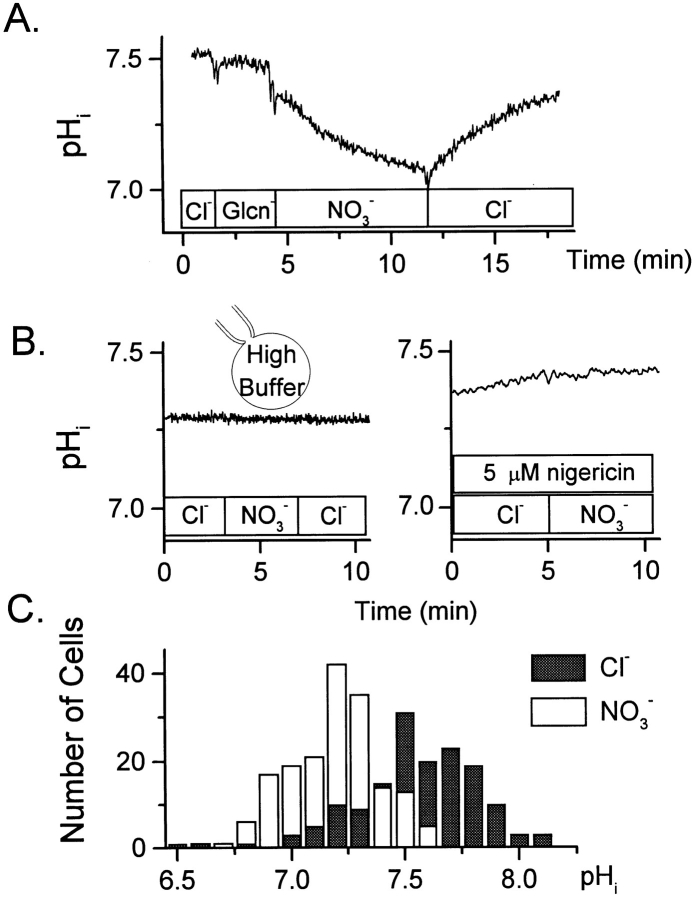
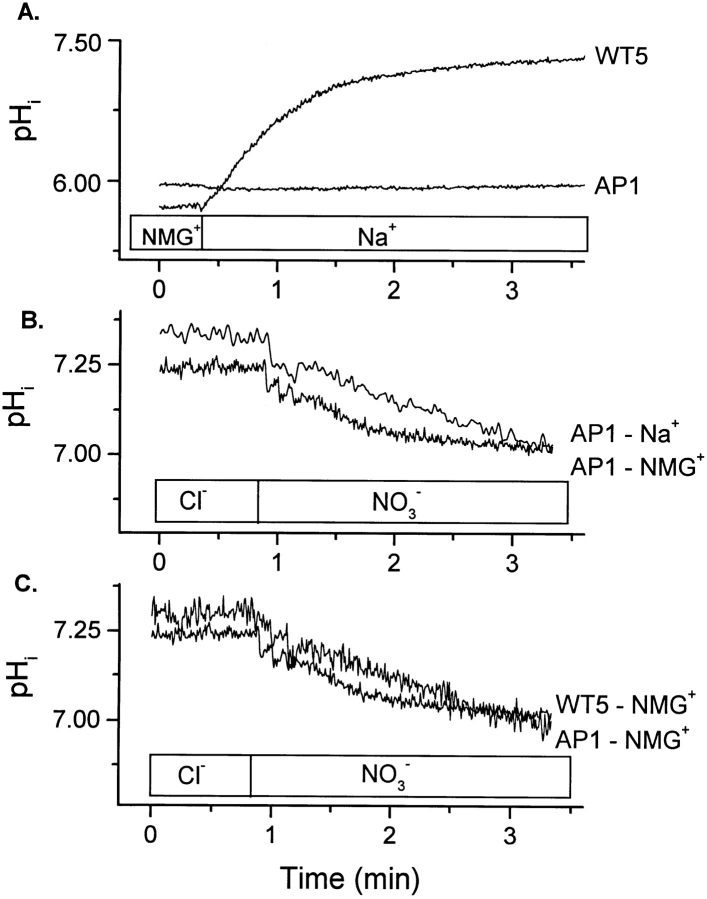
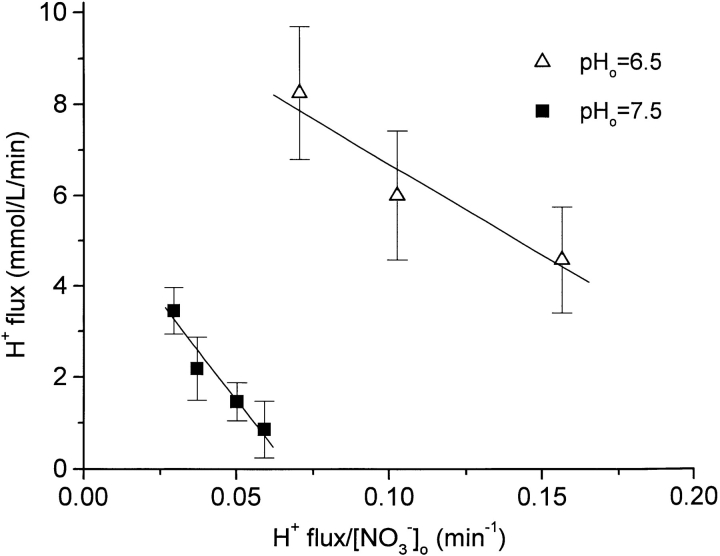
The effect of NO3- on intracellular pH (pHi) was assessed microfluorimetrically in mammalian cells in culture. In cells of human, hamster, and murine origin addition of extracellular NO3- induced an intracellular acidification. This acidification was eliminated when the cytosolic pH was clamped using ionophores or by perfusing the cytosol with highly buffered solutions using patch-pipettes, ruling out spectroscopic artifacts. The NO3-- induced pH change was not due to modulation of Na+/H+ exchange, since it was also observed in Na+/H+ antiport-deficient mutants. Though NO3- is known to inhibit vacuolar-type (V) H+-ATPases, this effect was not responsible for the acidification since it persisted in the presence of the potent V-ATPase inhibitor bafilomycin A1. NO3-/HCO3- exchange as the underlying mechanism was ruled out because acidification occurred despite nominal removal of HCO3-, despite inhibition of the anion exchanger with disulfonic stilbenes and in HEK 293 cells, which seemingly lack anion exchangers (Lee, B. S., R.B. Gunn, and R.R. Kopito. 1991. J. Biol. Chem. 266:11448- 11454). Accumulation of intracellular NO3-, measured by the Greiss method after reduction to NO2-, indicated that the anion is translocated into the cells along with the movement of acid equivalents. The simplest model to explain these observations is the cotransport of NO3- with H+ (or the equivalent counter-transport of NO3- for OH-). The transporter appears to be bi-directional, operating in the forward as well as reverse directions. A rough estimate of the fluxes of NO3- and acid equivalents suggests a one-to-one stoichiometry. Accordingly, the rate of transport was unaffected by sizable changes in transmembrane potential. The cytosolic acidification was a saturable function of the extracellular concentration of NO3- and was accentuated by acidification of the extracellular space. The putative NO3--H+ cotransport was inhibited markedly by ethacrynic acid and by alpha-cyano-4-hydroxycinnamate, but only marginally by 4, 4'-diisothiocyanostilbene-2,2' disulfonate or by p-chloromercuribenzene sulfonate. The transporter responsible for NO3--induced pH changes in mammalian cells may be related, though not identical, to the NO3--H+ cotransporter described in Arabidopsis and Aspergillus. The mammalian cotransporter may be important in eliminating the products of NO metabolism, particularly in cells that generate vast amounts of this messenger. By cotransporting NO3- with H+ the cells would additionally eliminate acid equivalents from activated cells that are metabolizing actively, without added energetic investment and with minimal disruption of the transmembrane potential, inasmuch as the cotransporter is likely electroneutral.


Figures

Figure 1
Figure 1
NO3 -induced cytosolic acidification in Chinese hamster ovary (CHO) cells. (A) CHO (AP1) cells grown to near confluence on glass coverslips were loaded with BCECF and used for microfluorimetric determination of pHi. The coverslip was perfused sequentially with the following K+-rich solutions, as indicated by the bar at the bottom of the graph: Cl, gluconate, NO3 , and Cl. Trace is representative of 4 similar experiments. (B, left) A single CHO cell was patched in the whole-cell configuration with a pipette filled with high buffer solution (50 mM HEPES, 50 mM Tris, 20 mM KCl) containing BCECF and used for microfluorimetric determination of pHi. After equilibration of the cytosol with the pipette buffer (∼5 min), the extracellular bathing medium was changed from KCl solution to KNO3 solution, as indicated. The trace is representative of 2 experiments. (right) CHO cells grown to near confluence on glass coverslips were loaded with BCECF and used for microfluorimetric determination of pHi. The pHi of the cells was clamped by incubation with 5 μM nigericin in a K+-rich solution for 5 min. Where indicated, the main anion of the perfusing solution was switched from Cl to NO3 , while keeping the K+ concentration constant at 140 mM. The trace is representative of 5 similar experiments. (C ) CHO cells were grown to 60–70% confluence on coverslips and loaded with BCECF for measurement of pHi by ratio imaging. The cells were allowed to equilibrate with the isotonic Cl-rich solution and one set of images was acquired (solid bars). The solution was then substituted for a NO3 -rich medium, and, after 5 additional min, another set of images was acquired (open bars). Images were collected from multiple areas of the coverslip while continuously perfusing the coverslip with the indicated solution. Quantification of cell-associated fluorescence ratio was performed using the Metamorph/Metafluor package (Universal Imaging, Inc.). Calibration of fluorescence ratio vs. pHi was performed on the same coverslip using the nigericin technique, as described in experimental procedures. The histogram was built using 153 and 174 cells perfused with isotonic Cl-rich and NO3 -rich media, respectively.
Figure 2
Figure 2
Time course of NO3 uptake by adherent CHO cells. CHO cells were grown to near confluence on 6-well plastic tissue culture dishes. The cells were exposed to NaNO3 solution for the times indicated, then washed extensively in the cold. Following lysis using 1 ml distilled H2O and repeated freeze-thawing, the intracellular NO3 content was measured after reduction to NO2 as described in experimental procedures. Solid squares: control cells. Open triangles : the uptake medium contained 100 μM 4,4′-diisothiocyanostilbene-2,2′ disulfonate (DIDS). Cell number and cell volume were measured using the Coulter-Channelyzer in parallel samples of cells that were suspended by trypsinization. Data are means ± SE of 3 determinations at 2 min and 6 experiments at other time points. Lines were fitted by linear regression.
Figure 3
Figure 3
NO3 -induced cytosolic acidification is independent of Na+/H+ exchange. (A) CHO cells grown to confluence on glass coverslips were loaded with BCECF and used for fluorimetric determination of pHi. WT5 cells are wild-type CHO cells, while AP1 cells are antiport-deficient CHO mutants isolated by the H+-suicide technique (see experimental procedures). Before the initiation of the trace, the cells were acid loaded by means of an ammonium pre-pulse (25 mM for 10 min). The trace starts upon perfusion of the ammonium-loaded cells with a Na+-free, NMG-Cl solution (pH 7.5). Where indicated, the bathing medium was switched to a Na+-rich solution (NaCl, pH 7.5). Representative of 5 experiments. (B and C ) pHi was measured fluorimetrically in CHO cells loaded with BCECF, as in panel A. In B AP1 cells were perfused initially with NaCl or NMG-Cl medium, as indicated. Where noted, the media were changed to NaNO3 or NMG-NO3 solution, respectively. In C  WT5 (top trace) or AP1 cells (lower trace) were perfused initially with NMG-Cl medium. Where noted, the perfusing medium was switched to NMG-NO3 solution. Traces in B and C are representative of 6 experiments, respectively. Mean NO3 - induced H+ flux of AP-1 cells was 2.54 ± 0.40 mmol/liter/ min in Na+-rich solution and 2.22 ± 0.45 mmol/liter/min in NMG+-rich solution. Mean NO3 - induced H+ flux of WT5 cells in NMG+-rich solution was 2.39 ± 0.39 mmol/liter/min.
Figure 4
Figure 4
NO3 -induced cytosolic acidification is independent of the anion exchanger. (A) pHi was measured fluorimetrically in CHO cells (WT5) loaded with BCECF. The cells were perfused initially with NMG-Cl medium and, where noted, the perfusing medium was switched to NMG-NO3 solution. For the lower trace the cells were pre-treated with 100 μM DIDS for 2 min before the initiation of the trace and the same concentration of the stilbene was present throughout the measurement period illustrated. (B) Microfluorimetric measurement of pHi in HEK cells. The cells were initially bathed in NMG-Cl solution and, where indicated, the medium was switched to NMG-NO3 solution. Traces in A and B are representative of 6 experiments, respectively.
Figure 5
Figure 5
NO3 -induced cytosolic acidification is independent of the V-ATPase. (A) pHi was measured fluorimetrically in CHO cells (AP1) loaded with BCECF. The cells were perfused initially with NMG-Cl medium and, where noted, the perfusing medium was switched to NMG-NO3 solution. For the lower trace the cells had been ATP depleted by preincubation for 10 min in glucose-free solution with 5 mM 2-deoxy-d-glucose and 1 μg/ml antimycin A. The fluorescence measurements were performed in glucose-free solutions. Traces are representative of 4 determinations. (B) Quantitation of the NO3 -induced cytosolic acidification in CHO cells. (left) WT5 cells. Where specified (stippled bar), the cells were treated with 50 nM bafilomycin for 2 min before, and also during the pHi measurements in KCl or KNO3 solutions. (right) AP1 cells. Where specified (stippled bar), the cells were ATP depleted as above. The pHi measurements were performed in NMG-Cl and NMG-NO3 solutions. H+ (equivalent) flux was calculated by multiplying the rate of pHi change (ΔpHi/Δtime) by the buffering capacity of CHO cells, measured to be 25 mmol/pH/liter of cells in the pH range of our measurements (Kapus et al., 1994). Data are means ± SE of 4 determinations.
Figure 6
Figure 6
Comparison of the effects of NO3 and NO2 on pHi and assessment of the role of carbonic anhydrase. (A) pHi was measured fluorimetrically in CHO cells (AP1) loaded with BCECF. The cells were perfused initially with 117 mM NaCl medium and, where noted, with solutions containing 10 mM sodium acetate (Act), 10 mM NaNO2 or 117 mM NaNO3. The sodium acetate and NaNO2 solutions were osmotically balanced with 107 mM Na-gluconate. (B) AP1 cells were preincubated for 5 min with 0.1 mM methazolamide in NaCl solution before fluorimetric measurement of pHi. Where noted, cells were perfused with solutions containing 10 mM NaNO2 or 117 mM NaNO3, as described in panel A, supplemented with 0.1 mM methazolamide. Traces in A and B are representative of 4 experiments each.
Figure 7
Figure 7
External pH dependence of the NO3 -induced cytosolic acidification. pHi was measured fluorimetrically in CHO cells (AP1) loaded with BCECF. The pHi change was measured upon introduction of a NO3 -rich solution of the indicated external [H+] (corresponding to a pHo range of 6.0–7.5). The rate of pHi change was estimated over a 60 s period and the H+ (equivalent) flux was calculated as in Fig. 5. The NO3 -independent acidification, due solely to the reduction in extracellular pH was estimated using Cl-rich solutions of identical pH, and was subtracted from the equivalent measurements performed in NO3 -rich media (see experimental procedures). NO3 -independent H+ flux at pHo of 6.0, 6.5, 7.0 was 4.11 ± 0.88, 1.71 ± 0.93 and 1.36 ± 0.77 mmol/ liter/min, respectively. Data are means ± SE of 5 experiments.
Figure 8
Figure 8
NO3 concentration dependence: Eadie-Hofstee plot. pHi was measured fluorimetrically in CHO cells (AP1) loaded with BCECF. The cells were equilibrated in Cl-rich medium and pHi changes were measured upon introduction of solutions of varying NO3 concentration (from 6.65 to 117 mM). The solutions were osmotically balanced using gluconate. No significant pHi change was induced by gluconate itself (e.g., Fig. 1). The rate of pHi change was estimated over a 60 s period and the H+ (equivalent) flux was calculated as in Fig. 5. These experiments were performed at pHo = 7.5 (closed squares) and pHo = 6.5 (open triangles). Data are means ± SE of 4 determinations. Vmax and K m, derived by linear regression from the Eadie-Hofstee plot were 5.8 ± 0.6 mmol/liter/ min and 86.2 ± 12.6 mM for pHo = 7.5 (R = −0.98) and 10.7 ± 1.3 mmol/liter/min and 40.1 ± 10.6 mM for pHo = 6.5 (R = −0.97).
Figure 9
Figure 9
Effect of membrane potential on NO3 -induced cytosolic acidification. An AP1 cell was voltage clamped in the whole-cell configuration of the patch-clamp technique, using a pipette filled with low buffer, KCl-rich solution containing BCECF. pHi was measured microfluorimetrically on the photometric system described in methods. Over 5 min were allowed at a holding potential of −60 mV for adequate fluorophore loading and for equilibration of the cytosol with the pipette solution before initiation of the pH measurements. The cell was initially superfused with KCl solution and subsequently with KNO3 solution, as noted. The holding voltage was stepped to values ranging from −60 mV to +40 mV, as indicated. Representative of  4 similar experiments.

Similar articles

Cited by

References

    1. Anggard E. Nitric oxide: mediator, murderer and medicine. Lancet. 1994;343:1199–1206. - PubMed
    1. Begault B, Edelman A. A nucleotide-regulated Cl−/ OH−anion exchanger in endoplasmic reticulum-enriched pig pancreatic microsomes. Biochim Biophys Acta. 1993;1146:183–190. - PubMed
    1. Bruce LJ, Anstee DJ, Spring FA, Tanner MJA. Band 3 Memphis variant II. J Biol Chem. 1994a;23:16155–16158. - PubMed
    1. Bruce LJ, Groves JD, Okubo Y, Thilaganathan B, Tanner MJA. Altered band 3 structure and function in glycopho-rin A- and B-deficient (MkMk) red blood cells. Blood. 1994b;84:916–922. - PubMed
    1. Cabantchik ZI, Knauf PA, Rothstein A. The anion transport system of the red blood cell. Biochim Biophys Acta. 1978;515:239–302. - PubMed

Publication types

MeSH terms