. 1997 Aug 15;17(16):6086-93.
doi: 10.1523/JNEUROSCI.17-16-06086.1997.

Phosphorylation at a single site in the rat brain sodium channel is necessary and sufficient for current reduction by protein kinase A

Affiliations

Phosphorylation at a single site in the rat brain sodium channel is necessary and sufficient for current reduction by protein kinase A

R D Smith et al. J Neurosci. .

Abstract

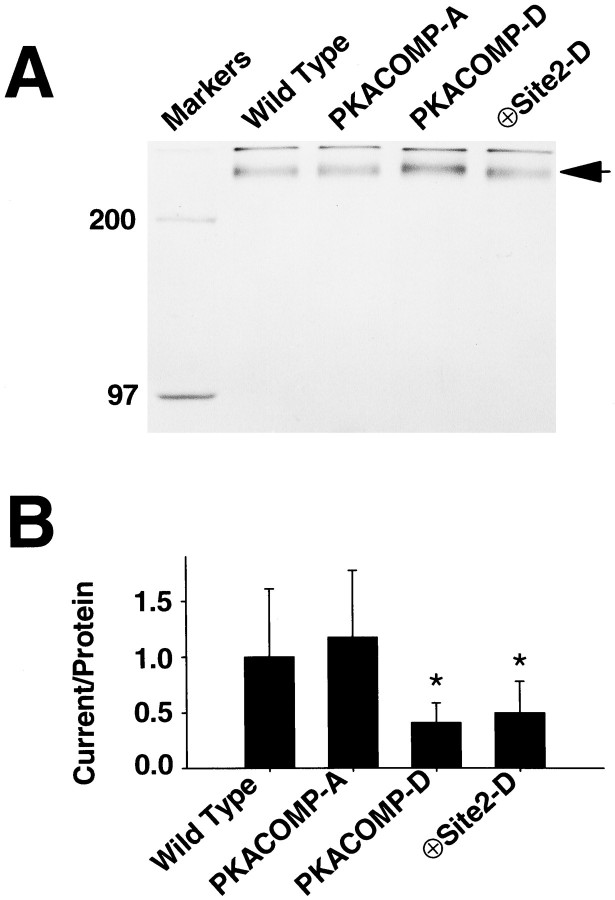
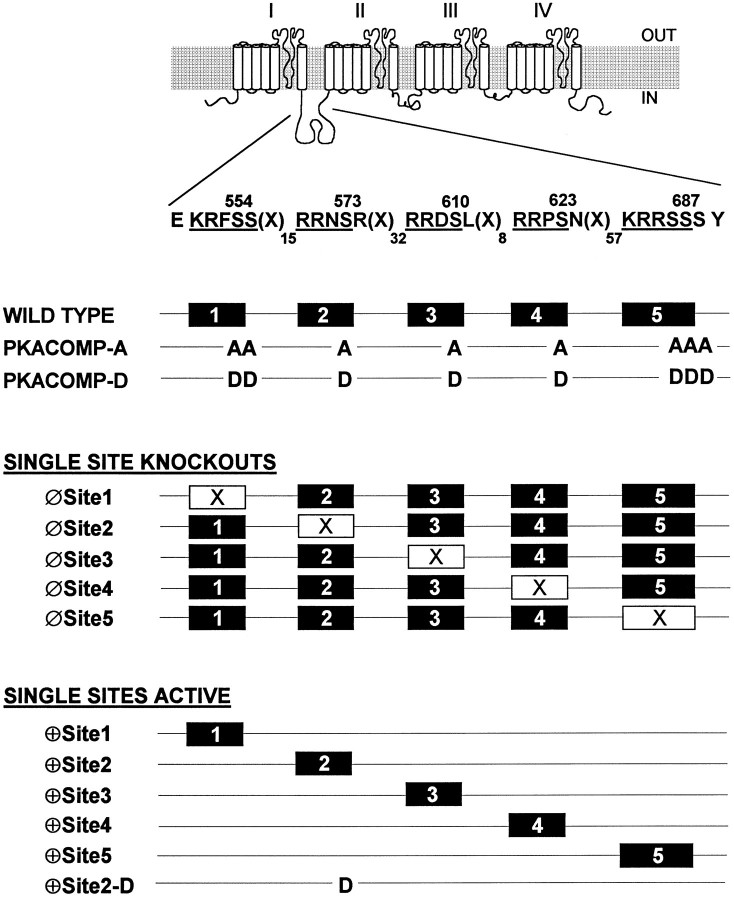
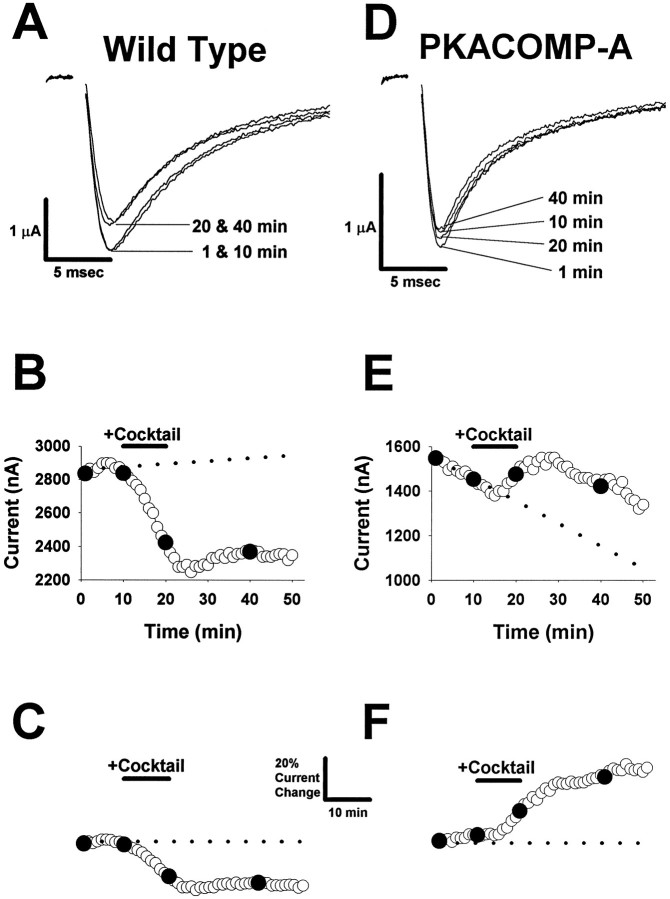
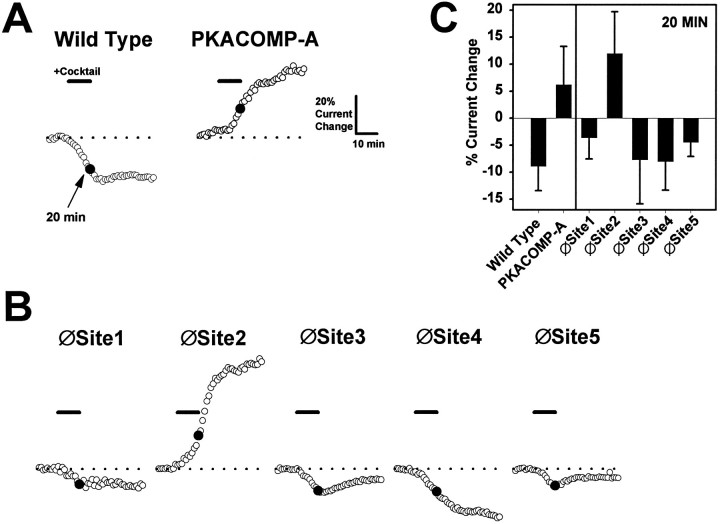
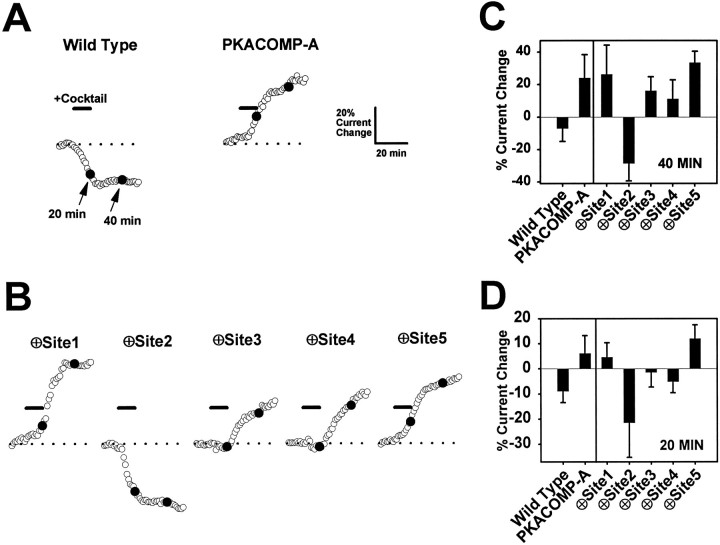
Voltage-gated sodium channels respond to excitatory inputs in nerve cells, generating spikes of depolarization at axon hillock regions and propagating the initial rising phase of action potentials through axons. It previously has been shown that protein kinase A (PKA) attenuates sodium current amplitude 20-50% by phosphorylating serines located in the I-II linker of the sodium channel. We have tested the individual contributions of five PKA consensus sites in the I-II linker by measuring sodium currents expressed in Xenopus oocytes during conditions of PKA induction. PKA was induced by perfusing oocytes with a cocktail that contained forskolin, chlorophenylthio-cAMP, dibutyryl-cAMP, and 3-isobutyl-1-methylxanthine. Phosphorylation at the second PKA site (serine-573) was necessary and sufficient to diminish sodium current amplitude. Phosphorylation at the third and fourth positions (serine-610 and serine-623) reduced current amplitude, but the effect was considerably smaller at those positions. Introduction of a negative charge at site 2 by substitution of serine-573 with an aspartate constitutively reduced the basal level of sodium current, indicating that the attenuation of sodium current by phosphorylation of site 2 by PKA results from the introduction of a negative charge at this site.


Figures

Fig. 5.
Fig. 5.
A negative charge at site 2 is sufficient to decrease sodium current amplitudes. A, Quantification of sodium channel protein. RNA encoding the sodium channel was injected into oocytes along with 35S-methionine to label the proteins metabolically. After 40 hr of incubation at 20°C, sodium channel protein was immunoprecipitated from the oocyte membrane fraction and analyzed by SDS-PAGE and autoradiography, as described in Materials and Methods. The band representing sodium channel protein (indicated by an arrow; Mr ≈ 260 kDa) was scanned and quantified. Molecular weight markers of 200 and 97 kDa were run in the first lane of the gel. B, Sodium current normalized to the amount of membrane sodium channel protein. Peak current amplitudes were measured in representative oocytes by depolarizations to −20 mV from a holding potential of −100 mV (n = 15 oocytes). The sodium current magnitude was ∼50 μA in ND-96 bath solution. To maintain voltage control using a two-electrode voltage clamp with oocytes expressing such high levels of current, we reduced sodium in the bath by substitution with choline. Sodium current was normalized to the amount of protein isolated (A), and the ratios of current to protein were normalized to the ratio for the wild-type channel, which was set at 1.0. Data are expressed as mean ± SD. The normalized ratio of current to protein for the PKACOMP-A channel was not significantly different from that of the wild-type channel. The asteriskindicates that the ratios for the PKACOMP-D and ⊕Site2-D channels were significantly reduced, compared with the level of the wild-type channel, as determined by t test analysis (PKACOMP-D,p < 0.001; ⊕Site2-D, p < 0.05).
Fig. 1.
Fig. 1.
Diagram of PKA site mutant sodium channels. Diagram of the rat brain sodium channel, emphasizing the presence of the five consensus PKA phosphorylation sites (RRXS and KRXXS) in the cytoplasmic linker that connects domains I and II of the channel. Amino acid positions are indicated above the serine residues within the consensus sites, and the number of amino acids separating each site is indicated by the subscripts after the symbol X. For the PKACOMP-A mutant, all of the PKA sites were eliminated collectively by replacing all serine residues at the five sites with alanines. For the PKACOMP-D mutant, the serines were replaced with aspartates to mimic the negative charges resulting from phosphorylation. Single PKA sites were eliminated (Single Site Knock-outs) by replacing serines with alanines at each position. A second series of channels was constructed in which all of the sites except one were modified by serine to alanine substitutions (Single Sites Active). The ⊕Site2-D mutant has an aspartate at position 2 (S573D) in a channel in which all of the serines at the other I–II linker PKA sites have been replaced with alanines.
Fig. 2.
Fig. 2.
PKA modulation of the sodium channel.A, Representative wild-type sodium current traces. Sodium currents were obtained by depolarizing pulses to −10 mV from a holding potential of −100 mV. Four traces are shown during depolarizations at 1, 10, 20, and40 min during a 50 min time course. PKA was induced in the oocyte as described in B during the 10–20 min time interval. B, Time course for wild-type peak current amplitude. Peak sodium current values are shown during a 50 min time course. The baseline current level was established during an initial 10 min interval (the dotted line represents a linear fit to the first 10 data points). PKA was induced during the 10 min time period indicated by the bar denoted Cocktail by perfusing with a PKA activation cocktail containing 25 μmforskolin, 10 μm cpt-cAMP, 10 μm db-cAMP, and 10 μm IBMX. Peak current values that correspond to the current traces in A (at 1, 10, 20, and 40 min) are indicated by the filled symbols. C, Adjusted and normalized time course for wild-type sodium channel peak current amplitude. The current values shown in B were adjusted by subtracting the linear relationship that was fit to the first 10 data points to compensate for the change in basal current. The adjusted values were normalized to the baseline current during the initial 10 min (dotted line). Calibration bars indicate a 20% relative change in current amplitude and a 10 min interval. D, Representative PKACOMP-A sodium current traces. Sodium currents were obtained by depolarizing pulses to −10 mV from a holding potential of −100 mV. Four traces are shown for time points obtained at1, 10, 20, and 40 min during a 50 min time course. PKA was induced in the oocyte as described in B during the 10–20 min time interval. E, Time course for PKACOMP-A peak current amplitude. Peak sodium current values are shown during a 50 min time course. The baseline current level was established during an initial 10 min interval (the dotted line represents a linear fit to the first 10 data points). PKA was induced during the 10 min time period indicated by the bardenoted Cocktail, as described in B. Peak current values that correspond to the current traces in D (at1, 10, 20, and 40 min) are indicated by the filled symbols. F, Adjusted and normalized time course for PKACOMP-A sodium channel peak current amplitude. The current values shown in E were adjusted by subtracting the linear relationship that was fit to the first 10 data points to compensate for the change in basal current. The adjusted values were normalized to the baseline current during the initial 10 min (dotted line). The calibration bars are shown inC and indicate a 20% relative change in current amplitude and a 10 min interval.
Fig. 3.
Fig. 3.
Site 2 is necessary for current reduction by PKA.A, Representative time courses for wild-type and PKACOMP-A channels. Adjusted and normalized peak current amplitudes are shown for representative oocytes injected with RNA encoding the wild-type and PKACOMP-A mutant channels. Currents were elicited by step depolarizations from a holding potential of −100 to −10 mV, with a sampling interval of 1 min. Peak current amplitudes were adjusted and normalized as described in Figure 2C, F. The basal level of current, indicated by the dashed lines, was established during an initial 10 min interval. PKA was induced by perfusion with a cocktail (25 μm forskolin, 10 μm cpt-cAMP, 10 μm db-cAMP, and 10 μm IBMX) for 10 min, as indicated by the solid bar denoted Cocktail. The 20 min time point (indicated by solid circles) was chosen to emphasize the reduction in current for the wild-type channel and the enhancement of current for the PKACOMP-A channel after PKA induction. Scale bars indicate a 10 min interval and a 20% change in current amplitude. B, Representative time courses for single site knock-out mutants. Adjusted and normalized peak current amplitudes are shown for sodium channels lacking single PKA sites. PKA was induced by a 10 min perfusion of cocktail, as indicated by the solid bars. Recording conditions and time and amplitude scales are the same as inA. C, Average percentage of changes in current amplitudes. The percentages of current change at the 20 min time points are plotted for each of the channels represented in A andB. The values reflect the average change in current amplitude with corresponding SD values for each of the different sodium channels 10 min after PKA induction. Sample sizes were wild-type, 9; PKACOMP-A, 8; and 5 for each of the single site knock-out mutants.
Fig. 4.
Fig. 4.
Site 2 is sufficient for current reduction by PKA.A, Representative time courses for the wild-type and PKACOMP-A channels. Adjusted and normalized peak current amplitudes are shown for representative oocytes injected with RNA encoding the wild-type and PKACOMP-A mutant channels. Currents were elicited by step depolarizations from a holding potential of −100 to −10 mV at a sampling interval of 1 min. Peak current amplitudes were adjusted and normalized as described in Figure 2C, F. The basal level of current (indicated by the dashed lines) was established during an initial 10 min interval. PKA was induced by perfusion with a cocktail (25 μm forskolin, 10 μm cpt-cAMP, 10 μm db-cAMP, and 10 μm IBMX) for 10 min, as indicated by the solid bar denoted Cocktail. The 20 and 40 min time points (indicated by solid circles) were chosen to emphasize the PKA-mediated reduction in current at both times for the wild-type channel, in contrast to the enhancement of current for the PKACOMP-A channel. Scale bars indicate a 10 min interval and a 20% change in current amplitude. B, Representative time courses for channels with single active PKA sites. Adjusted and normalized peak current amplitudes are shown for sodium channels that have single PKA sites present. PKA was induced by a 10 min perfusion of cocktail, as indicated by the solid bars. Recording conditions and time and amplitude scales are the same as in A. The 20 and 40 min time points (solid circles) are highlighted to emphasize the initial reduction in current at 20 min for the ⊕Site3 and ⊕Site4 channels and the enhancement of current at 40 min for these channels after PKA induction. C, Average percentage of changes in current amplitudes at 40 min. The percentage of current change at the 40 min time points is shown for each of the channels represented inA and B. These values reflect the average change in current amplitude with corresponding SD values for each of the channels 30 min after PKA induction. Sample sizes were wild-type, 9; PKACOMP-A, 8; and 8, 6, 7, 8, and 5 for channels with single sites active at positions 1–5, in that order. D, Average percentage of changes in current amplitudes at 20 min. The percentage of current change at the 20 min time points is shown for each of the channels represented in A and B. These values reflect the average change in current amplitude with corresponding SD values for each of the channels 10 min after PKA induction. The sample sizes were the same as forC.

Similar articles

Cited by

References

    1. Auld VJ, Goldin AL, Krafte DS, Catterall WA, Lester HA, Davidson N, Dunn RJ. A neutral amino acid change in segment IIS4 dramatically alters the gating properties of the voltage-dependent sodium channel. Proc Natl Acad Sci USA. 1990;87:323–327. - PMC - PubMed
    1. Chen T-C, Law B, Kondratyuk T, Rossie S. Identification of soluble protein phosphatases that dephosphorylate voltage-sensitive sodium channels in rat brain. J Biol Chem. 1995;270:7750–7756. - PubMed
    1. Costa MR, Catterall WA. Cyclic AMP-dependent phosphorylation of the alpha subunit of the sodium channel in synaptic nerve ending particles. J Biol Chem. 1984;259:8210–8218. - PubMed
    1. Costa MR, Casnellie JE, Catterall WA. Selective phosphorylation of the alpha subunit of the sodium channel by cAMP-dependent protein kinase. J Biol Chem. 1982;257:7918–7921. - PubMed
    1. Frohnwieser B, Chen L-Q, Schreibmayer W, Kallen RG. Modulation of the human cardiac sodium channel α-subunit by cAMP-dependent protein kinase and the responsible sequence domain. J Physiol (Lond) 1997;498:309–318. - PMC - PubMed

Publication types

MeSH terms

LinkOut - more resources