. 1997 Aug 15;17(16):6152-64.
doi: 10.1523/JNEUROSCI.17-16-06152.1997.

N-Type calcium channels in the developing rat hippocampus: subunit, complex, and regional expression

Affiliations

N-Type calcium channels in the developing rat hippocampus: subunit, complex, and regional expression

O T Jones et al. J Neurosci. .

Abstract

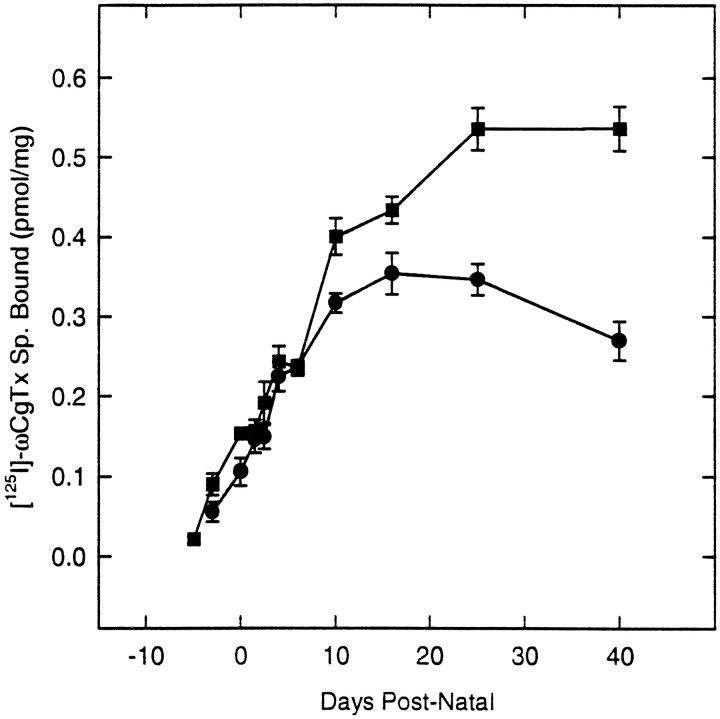
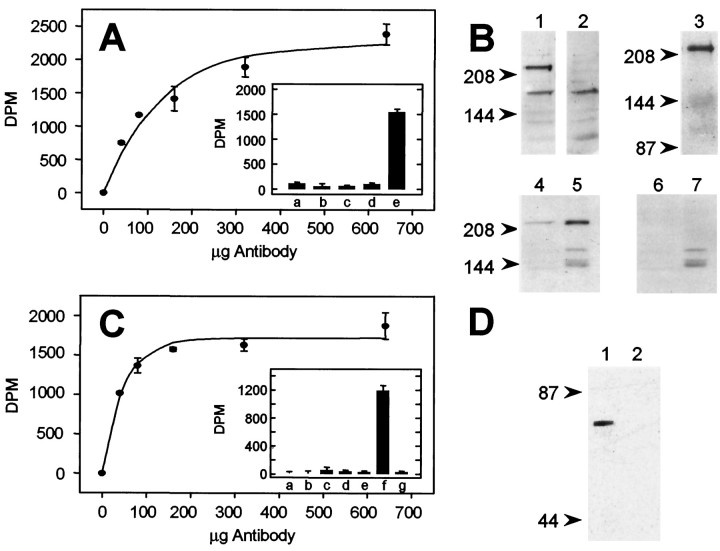
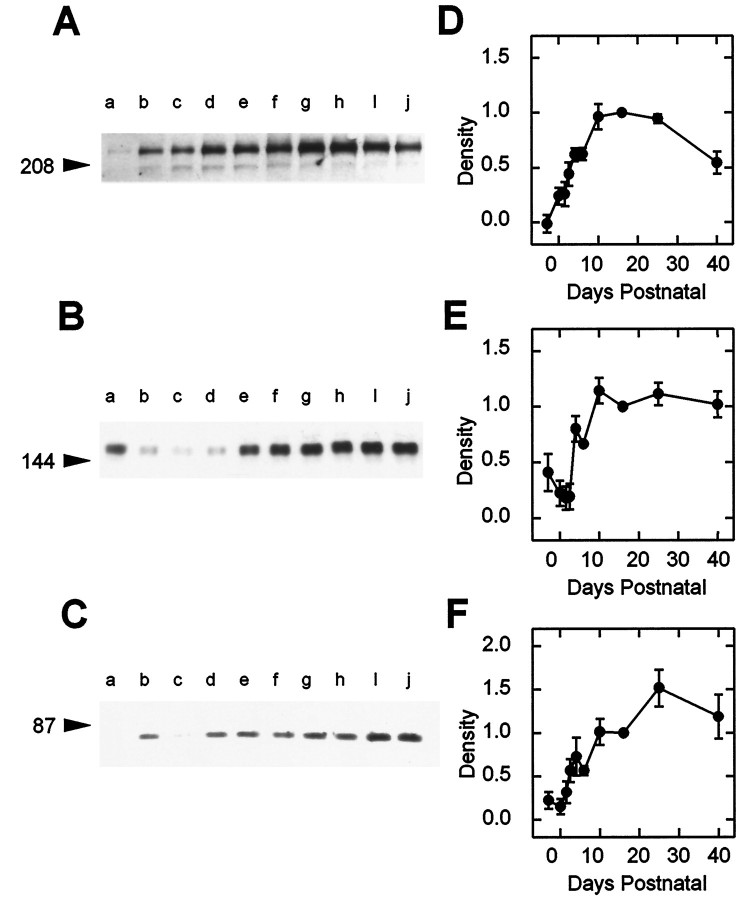
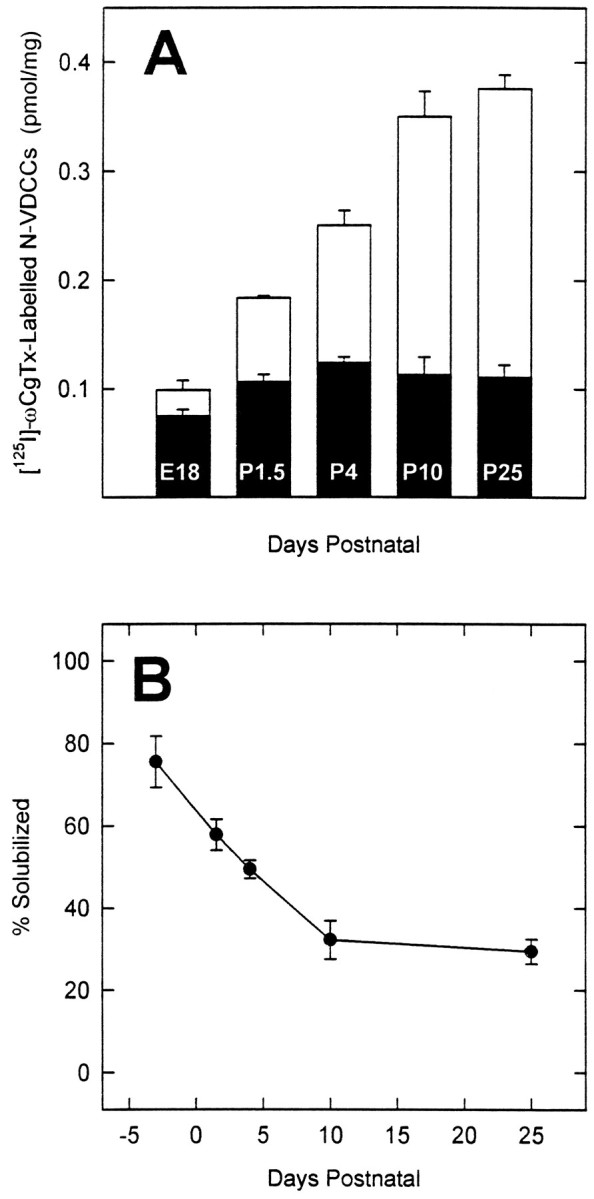
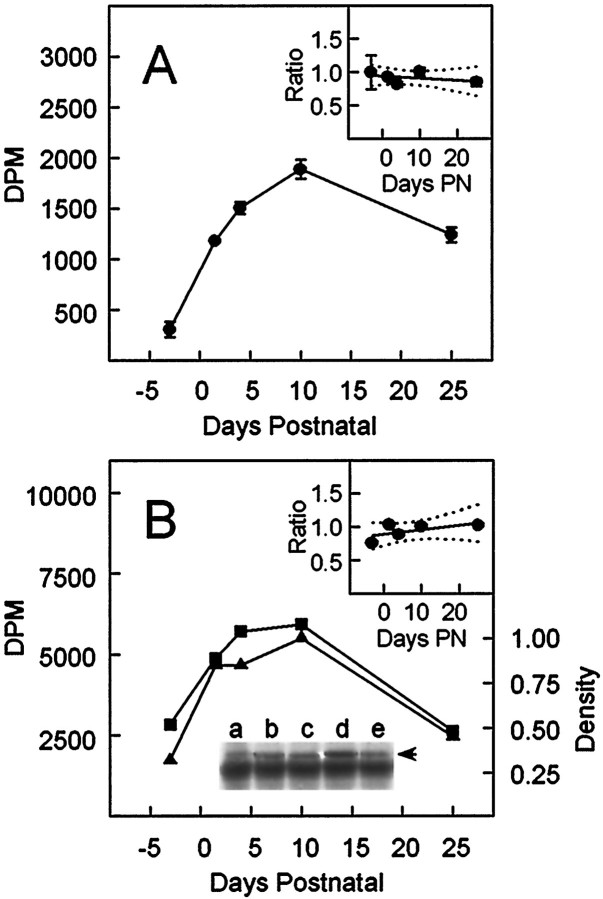
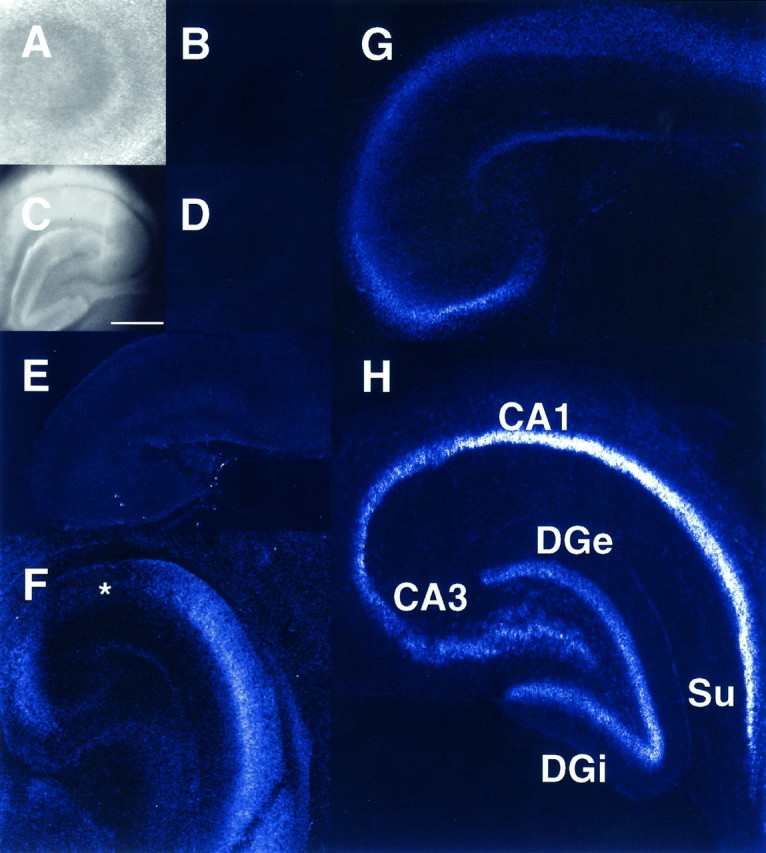
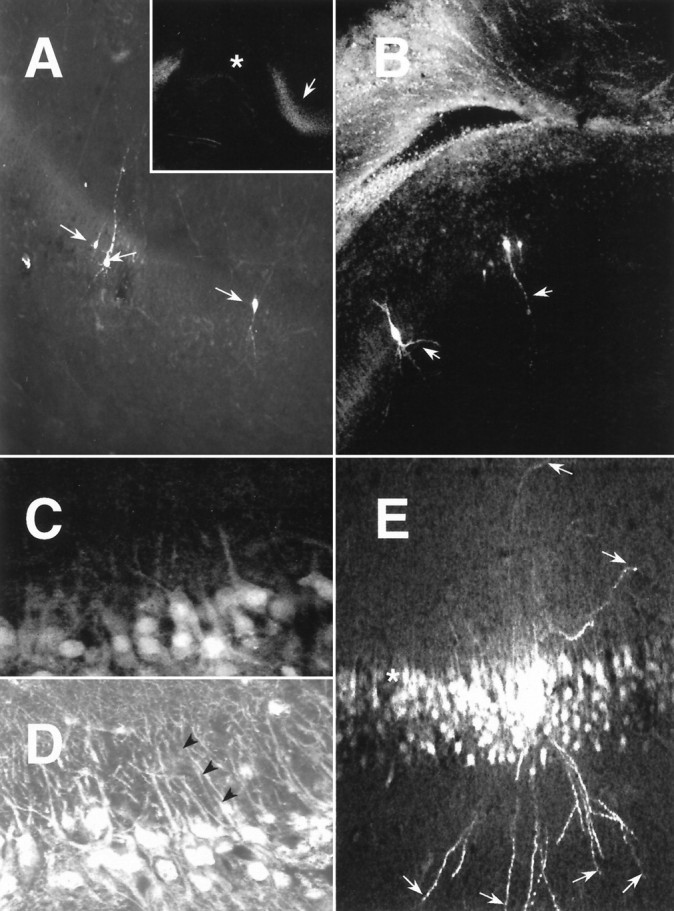
The expression of multiple classes of voltage-dependent calcium channels (VDCCs) allows neurons to tailor calcium signaling to functionally discrete cellular regions. In the developing hippocampus a central issue is whether the expression of VDCC subtypes plays a role in key phases such as migration and synaptogenesis. Using radioligand binding and immunoblotting, we show that some N-type VDCCs exist before birth, consistent with a role in migration; however, most N-VDCC subunit expression is postnatal, coinciding with synaptogenesis. Immunoprecipitation studies indicate that the increased expression of N-VDCCs in early development occurs without subunit switching because there is no change in the fraction of beta3 subunits in the N-VDCC alpha1B-beta3 heteromers. Fluorescence imaging of cell surface N-VDCCs during this period reveals that N-VDCCs are expressed on somata before dendrites and that this expression is asynchronous between different subfields of the hippocampus (CA3-CA4 before CA1-CA2 and dentate gyrus). Our data argue that N-VDCC expression is an important cue in the genesis of synaptic transmission in discrete hippocampal subfields.


Figures

Fig. 1.
Fig. 1.
Expression of N-VDCCs in development determined by radioligand binding. Shown are ontogeny of [125I]ω-CgTx binding in cortical (▪) or hippocampal (•) rat brain synaptic membranes. Values (pmol/mg total protein) represent mean ± SEM (n = 4) except for P40, in which n = 7.
Fig. 2.
Fig. 2.
Kinetics of binding of [125I]ω-CgTx to hippocampal membranes from newborn (P0) or postnatal day 40 (P40) rats. A, Association kinetics. B, Dissociation kinetics. The rates of [125I]ω-CgTx binding or dissociation were determined by filtration assays (see Materials and Methods) for membranes at P0 (•) and P40 (▪). Curves were fit assuming bimolecular reaction kinetics (see Results) and using a nonlinear least-squares algorithm.
Fig. 3.
Fig. 3.
Characterization of α1B(A, B) and β3(C, D) polyclonal antibodies.A, Immunoprecipitation of [125I]ω-CgTx-labeled N-VDCCs by anti-α1B antibodies. [125I]ω-CgTx-labeled N-VDCCs were solubilized with digitonin (see Materials and Methods), and their interaction with anti-α1B antibodies was demonstrated by the concentration dependence of immunoprecipitation. The data were fit assuming a saturation curve of the form y = 2254 × [1−exp(−x/134)], according to Westenbroek et al. (1992), as above. The value of 2254 dpm corresponds to 55% of the total [125I]ω-CgTx in each reaction.Inset, The specificity of the interaction between anti-α1B antibodies and solubilized [125I]ω-CgTx binding sites was determined by comparing the radioactivity in experimental immunoprecipitations (e) with that in control immunoprecipitations made with preimmune serum (a); control membranes, i.e., those pretreated with excess cold ω-CgTx before radiolabeling (b); competing antigenic peptide (25 μm) (c); and preimmune serum plus competing peptide antigen (25 μm) (d). B, Antibodies against α1B recognize a band of ∼220 kDa on immunoblots (lane 1) and several bands of lower molecular weight. Staining of the 220 kDa, but not the minor bands, was eliminated if the antibody was treated first with competing competing α1Bpeptide antigen (40 μm) (lane 2). The band recognized by our α1B antibodies is identical in molecular weight to that recognized by monoclonal antibodies to an α1B fusion protein (lane 3) (Gift of Dr. V. Lennon, Mayo Clinic, Rochester, MN), persists on purification of digitonin-solubilized N-VDCCs with heparin–agarose (lane 4), and is intensified after an additional wheat germ affinity chromatography step (lane 5). The 220 kDa bands in lanes 4 and 5 both can be displaced by pretreatment of the α1B antibody with competing peptide (lanes 6 and 7, respectively). Blots were analyzed with MAPS-purified α1B antibody (10 μg/ml) and detected by ECL (see Materials and Methods). C, Immunoprecipitation of [125I]ω-CgTx-labeled N-VDCCs by anti-β3 antibodies. Digitonin solubilized [125I]ω-CgTx-labeled N-VDCCs immunoprecipitated as described for anti-α1B antibodies (A, above), and the data were fit to the saturation equationy = 1717 × [1−exp(−x/48)], as above. The value 1717 dpm corresponds to 42% of the total [125I]ω-CgTx sites in each reaction.Inset, Specificity of the β3immunoprecipitations, determined as in A, inset. Experimental immunoprecipitations (f) were compared with the following controls: control membranes (a) (see A, inset b), competing antigenic peptide (25 μm) (b), control membranes plus competing peptide (c), immunoprecipitates with no primary antibody (d), control membranes and no primary antibody (e), and preimmune serum (g). D, Antibodies against β3 recognize a band of 55 kDa on immunoblots (lane 1), which can be displaced completely by competing peptide antigen (lane 2) (40 μm). Molecular weights were derived from prestained molecular weight standards (arrowheads at left).
Fig. 4.
Fig. 4.
Ontogeny of N-VDCC subunits in hippocampal membranes as determined by immunoblotting. Immunoblots were probed with the following antibodies: α1B (A), α2/δ (B), and β3 (C) (see Materials and Methods).Lanes a–j correspond to the following ages at which the hippocampal membranes were prepared: E18, P0, 1.5, 2.5, 4, 6, 10, 16, 25, and 40. Arrowheads at left denote positions of molecular weight markers (see Materials and Methods). Densitometric scans of immunoblots corresponding to α1B, α2/δ, and β3 are shown in D–F, respectively. Each panel shows data ± SEM obtained from three separate sets of animals, normalized to the values seen at P16.
Fig. 5.
Fig. 5.
The extent of solubilization of hippocampal N-VDCCs changes during development. A, Comparison of the number of [125I]ω-CgTx binding sites in digitonin-treated membranes from different days in development before (open bar) and after (solid bar) centrifugation at 100,000 × g for 1 hr (see Materials and Methods). Note the different ontogeny for the solubilized (solid bar) versus the total number (open bar) of [125I]ω-CgTx binding sites.B, Solubilization of [125I]ω-CgTx binding sites decreases in development. In both A andB the data represent the mean ± SEM (n = 7).
Fig. 6.
Fig. 6.
Immunoprecipitation analysis of α1B–β3 complexation during development.A, Immunoprecipitation of [125I]ω-CgTx-labeled N-VDCCs by anti-β3 antibodies. Hippocampal membranes from rats at various ages were labeled with [125I]ω-CgTx, solubilized with digitonin, and immunoprecipitated by anti-β3 antibodies, and then the radioactivity was counted (see Materials and Methods). The specific radioactivity in the immunoprecipitates is shown as the mean ± SEM (n = 3). The inset shows the ratio of the [125I]ω-CgTx radioactivity in the β3 immunoprecipitates to that in the solubilizates after normalizing the respective data to values obtained at P10. The lines of best fit and 95% confidence limits, corresponding to the linear equation y = b0 +b1 · x (in whichy and x correspond to the ratio and the days postnatal, respectively), are shown as solid anddotted lines, respectively. The corresponding regression coefficients b0 andb1 were 0.94 and −0.003, respectively.B, Immunoprecipitation of β3 subunits by anti-α1B antibodies. Hippocampal membranes from rats at E18, P1.5, P4, P10, and P25 (lanes a–e, respectively) were labeled with [125I]ω-CgTx, solubilized with digitonin, and immunoprecipitated by biotinylated anti-α1antibodies on streptavidin–agarose (see Materials and Methods). The level of β3 in the immunoprecipitates was assayed by immunoblotting with digoxygenylated anti-β3 antibodies and quantified densitometrically (axis,right). The concentration of [125I]ω-CgTx binding sites at the corresponding ages was determined from the radioactivity in the immunoprecipitates before electrophoresis (axis, left). The ratio of the β3 subunits determined densitometrically to the [125I]ω-CgTx radioactivity in the α1B immunoprecipitates is shown in theinset after the respective data had been normalized to the values obtained at P10. The lines of best fit and 95% confidence limits, determined by linear regression, are shown assolid and dotted lines, respectively, and the corresponding regression coefficients (calculated as above) were 0.90 for b0 and 0.006 forb1, respectively.
Fig. 7.
Fig. 7.
Distribution of N-VDCCs in the developing rat hippocampus, as determined by Fl-ω-CgTx labeling. Hippocampi were sectioned, labeled with Fl-ω-CgTx, and imaged at low power by confocal fluorescence microscopy, as described (see Materials and Methods). A–D, Control experiments reveal lack of fluorescence (B, D) in hippocampal slices pretreated with ω-CgTx before labeling with Fl-ω-CgTx at both P0 (A, B) and P40 (C,D). A and C show phase micrographs corresponding to the slices in B andD. Scale bar in C, 500 μm.E–H, Distribution of fluorescence in hippocampal slices labeled with Fl-ω-CgTx. E, Hippocampus at E19; note absence of marked staining. F, Hippocampus at P0; note relative absence of staining in subfields CA1–CA2 (asterisk) and the dentate gyrus, as compared with CA3–CA4 and the subiculum (Su). G, At day 4, labeling is detected in the somata and dendrites of all subfields, except the internal granule cell layer of the dentate gyrus (DGi). H, Labeling of adult hippocampus by Fl-ω-CgTx is now evident in all fields and is consistently higher on the somata than in the dendrites. DGe, Dentate gyrus. All measurements were replicated in at least five separate experiments.
Fig. 8.
Fig. 8.
Comparative distributions of Fl-ω-CgTx labeling and CA1 neurons identified by filling with the intracellular dye Lucifer yellow. A, Hippocampal CA1 neurons at P2 filled with Lucifer yellow show extensive arborization (arrows) but weak staining with Fl-ω-CgTx (inset, asterisk). In contrast to CA1, staining with Fl-ω-CgTx is much stronger in the adjacent subiculum (inset, arrow). B, Direct comparison of the distributions of Fl-ω-CgTx labeling and CA1 neurons identified by Lucifer yellow filling (arrows) at P3. Note the much weaker staining of the CA1 subfield neurons, as compared with those in the cingulate cortex (top left).C, Fl-ω-CgTx labeling in P7 CA1 neurons. Note the strong staining of the somata and the very proximal dendritic regions and the sharp decline in labeling that occur within a few soma diameters from the cell body. D, Fl-ω-CgTx labeling in adult CA1 neurons. Note that the staining, while often punctate, is sustained for distances corresponding to several soma diameters on dendrites emanating from identifiable somata (arrowheads) and pervades the dendritic arbor. E, At high magnification, Lucifer filling of P7 CA1 neurons reveals extensive dendritic arborization and stains even the most distal dendritic regions (arrows), whereas the Fl-ω-CgTx labeling is restricted to somata and very proximal dendrites (asterisk), as inC.

Similar articles

Cited by

References

    1. Altman J, Bayer SA. Mosaic organization of the hippocampal neuroepithelium and the multiple germinal sources of dentate granule cells. J Comp Neurol. 1990a;301:325–342. - PubMed
    1. Altman J, Bayer SA. Prolonged sojourn of developing pyramidal cells in the intermediate zone of the hippocampus and their settling in the stratum pyramidale. J Comp Neurol. 1990b;301:343–364. - PubMed
    1. Altman J, Bayer SA. Migration and distribution of two populations of hippocampal granule cell precursors during the perinatal and postnatal periods. J Comp Neurol. 1990c;301:365–381. - PubMed
    1. Bading H, Ginty DD, Greenberg ME. Regulation of gene expression in hippocampal neurons by distinct calcium signaling pathways. Science. 1993;260:181–186. - PubMed
    1. Bahn S, Volk B, Wisden W. Kainate receptor gene expression in the developing rat brain. J Neurosci. 1994;14:5525–5547. - PMC - PubMed

Publication types

MeSH terms

LinkOut - more resources