. 1997 Aug 15;17(16):6409-23.
doi: 10.1523/JNEUROSCI.17-16-06409.1997.

Physiology and plasticity of morphologically identified cells in the mormyrid electrosensory lobe

Affiliations

Physiology and plasticity of morphologically identified cells in the mormyrid electrosensory lobe

C C Bell et al. J Neurosci. .

Abstract

The electrosensory lobe (ELL) of mormyrid electric fish is the first stage in the central processing of sensory input from electroreceptors. The responses of cells in ELL to electrosensory input are strongly affected by corollary discharge signals associated with the motor command that drives the electric organ discharge (EOD). This study used intracellular recording and staining to describe the physiology of three major cell types in the mormyrid ELL: the medium ganglion cell, the large ganglion cell, and the large fusiform cell. The medium ganglion cell is a Purkinje-like interneuron, whereas the large ganglion and large fusiform cells are efferent neurons that convey electrosensory information to higher stages of the system. Clear differences were observed among the three cell types. Medium ganglion cells showed two types of spikes, a small narrow spike and a large broad spike that were probably of axonal and dendro-somatic origin, respectively, whereas the large ganglion and large fusiform cells showed only large narrow spikes. Most of the medium ganglion cells and all of the large ganglion cells were inhibited by electrosensory stimuli in the center of their receptive fields, whereas the large fusiform cells were excited by such stimuli. Responses to the EOD corollary discharge were different in the three cell types, and these responses underwent plastic changes after a few minutes of pairing with an electrosensory stimulus. Plastic changes were also observed in medium and large ganglion cells after the corollary discharge was paired with depolarizing, intracellular current pulses.


Figures
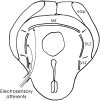
Fig. 1.
Fig. 1.
Schematic diagram of a frontal section through ELL. The ELL is divided into medial (MZ), dorsolateral (DLZ), and ventrolateral (VLZ) zones. Much of ELL is covered by the eminentia granularis posterior (EGp), which contains the granule cells that give rise to the parallel fibers of ELL molecular layer.
Fig. 2.
Fig. 2.
Cell and fiber types of ELL discussed in the text (adapted from Meek, 1993). Primary afferent input terminates in the granular layer (mormyromast afferent). Sensory information is then relayed to different types of interneurons, including two types of medium ganglion cells (MG1 andMG2) and efferent projection neurons (LG and LF). The apical dendritic trees of MG, LG, and LF neurons extend through the molecular layer where they are contacted by parallel fibers from EGp. Small stellate cells in the molecular layer are also contacted by the parallel fibers. Parallel fibers convey corollary discharge signals, descending electrosensory information from the preeminential nucleus (preem.), and information from other sensory modalities. The preeminential nucleus also projects directly to the inner molecular layer (preem. afferent). Corollary discharge input from the juxtalobar nucleus terminates in the granular, plexiform, and ganglion layers. Output neurons of ELL project to the mesencephalon via the lateral lemniscus and give off collaterals to the preeminential nucleus.
Fig. 4.
Fig. 4.
Medium ganglion cell: intracellular recordings.A, Corollary discharge responses. Top traces, Superimposed intracellular recordings of corollary discharge responses consisting of a compound EPSP giving rise to a fixed latency small spike (s), followed by a burst of less strictly timed small spikes. A large broad spike (b) with an inflection on the rising phase (arrowhead) is evoked on one sweep. A medium broad spike (mb) with an amplitude corresponding to that of the inflection on the broad spike also occurs on one sweep. Raster display, Firing pattern of successive corollary discharge responses. Each line of the raster is triggered by the electric organ command signal. Each point in the raster shows the occurrence of a spike. Most spikes are small narrow spikes, but some medium and large broad spikes are also included in the raster. Bottom trace, Electric organ command signal. T0, Time 0, temporal reference point used in describing results. The recorded amplitude of the command signal varied between 100 and 200 μV in different fish. The exact amplitude of this signal is not indicated in this or subsequent figures. B, Responses to depolarizing intracellular current pulse. Pulse of 0.3 nA evokes small, medium, and broad spikes.
Fig. 3.
Fig. 3.
Reconstructions of intracellularly recorded, biocytin-labeled neurons. Left column, Two medium ganglion cells; middle column, large ganglion cells;right column, large fusiform cells. mo, Molecular layer; ga, ganglion layer; pl, plexiform layer; gr, granular layer; *, axon. Scale bars, 50 μm.
Fig. 6.
Fig. 6.
Medium ganglion cell: corollary discharge plasticity after pairing with an intracellular current pulse. Each column shows a different pairing of the corollary discharge with an intracellularly evoked broad spike. The top row(C before) shows superimposed traces of the corollary discharge response before pairing. The middle row(C + intra) shows superimposed traces during the 2 min of pairing (at a lower gain). The bottom row (C after) shows superimposed traces after the pairing.Arrows point to IPSPs that precede the EPSPs in some traces. Left column, Broad spike before the corollary discharge EPSP during pairing. Middle column, Broad spike at the time of the corollary discharge during pairing.Right column, Broad spike after the corollary discharge EPSP during pairing. Note that the corollary discharge EPSP is enhanced during pairings in which the broad spike is evoked before or after the EPSP during pairing but is depressed when the broad spike is evoked at the time of the EPSP during pairing. In the right column, the pairing-induced increase in the peak of the EPSP is less obvious than the general increase in size and duration of the EPSP. Note the hyperpolarization late in the after-pairing sweeps of the right column, presumably attributable to previous pairing with the broad spike at this delay. The vertical calibration bar at the right of the middle row is for the middle row only. The vertical calibration bar at the right of the bottom row is for both the top and bottom rows.
Fig. 5.
Fig. 5.
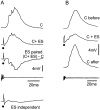
Medium ganglion cell: interactions between corollary discharge and electrosensory responses. A, Corollary discharge enhancement of inhibition by electrosensory stimulus. C, Postsynaptic response to corollary discharge alone; C+ ES, response to corollary discharge plus electrosensory stimulus given at 4 msec delay; (C+ ES) − C, computed response to ES when locked to corollary discharge, calculated by subtracting the top trace from the second trace (C+ ES); ES independent, response to ES given independently of corollary discharge. The IPSP is quite shallow and has a latency of ∼10 msec. B, Corollary discharge plasticity after pairing with electrosensory stimulus. Same cell as that shown in A. C before, Response to corollary discharge before pairing; C + ES, response to corollary discharge during pairing. C after, Response to corollary discharge after 4 min of pairing. Note the increase in EPSP size. All traces in A and B are averages of 10 responses. • indicates electrosensory stimulus in this and subsequent figures.
Fig. 7.
Fig. 7.
Large ganglion cells: corollary discharge and electrosensory responses. A, Cell with minimal corollary discharge response. Top trace, Response at resting membrane potential of −62 mV. Middle trace, Response with cell hyperpolarized to −69 mV. Note synaptic potential.Bottom trace, Command signal. B, Cell with pronounced corollary discharge response. Top trace, Response at resting membrane potential of −59 mV, showing IPSP–EPSP–IPSP sequence. Second from top trace, Response with cell hyperpolarized to −65 mV. Third from top trace, Response with cell hyperpolarized to −80 mV. Note the inversion of the IPSPs. Bottom trace, Command signal.C, Corollary discharge enhancement of inhibitory response to electrosensory stimulus. Top trace, Cell with minimal corollary discharge response. Electrosensory stimulus given at a long delay after the command does not evoke a visible response. Middle trace, The same electrosensory stimulus evokes a large IPSP when given at a short delay. Bottom trace, Command signal. D, Responses to electrosensory stimuli in center and periphery of receptive field with enhancement by corollary discharge (superimposed traces). Left traces, Electrosensory stimulus in center of receptive field evokes an IPSP. Right traces, Electrosensory stimulus in periphery evokes an EPSP. Top row, Stimulus given independent of command. Bottom row, Stimulus given at short delay after command. Note that both IPSPs and EPSPs are enhanced when stimulus is locked to command.E, Drawing of the head of a fish showing location of points on the skin where electrosensory stimuli cause excitation and inhibition for a cell like that shown in D (−, inhibition; +, excitation).
Fig. 8.
Fig. 8.
Large ganglion cell: plasticity of the corollary discharge response after pairing with an electrosensory stimulus.A, Raster display showing spike responses. C before, Corollary discharge response before pairing. C + ES (initial), Responses to corollary discharge plus stimulus at start of stimulation. The vertical black line indicates the delay and presence of the stimulus. C + ES (late), Responses to corollary discharge plus stimulus at the end of 2 min of pairing. C after, Corollary discharge response after pairing. Note the newly developed burst. B, Superimposed intracellular records from same cell and epochs as in A. Note reduction in electrosensory IPSP after pairing.
Fig. 9.
Fig. 9.
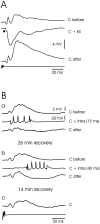
Large ganglion cells: corollary discharge plasticity after pairing with electrosensory stimuli and intracellular current pulses. A, Plasticity after pairing with an electrosensory stimulus. Traces show corollary discharge responses before pairing (C before), during pairing with an electrosensory stimulus (C + ES), and after pairing (C after). Note that the late components are strongly affected by the pairing but the early components are not. Intracellular recordings are the averages of 10 sweeps. B, Plasticity after pairing with an intracellular current pulse. A different cell from that shown in A. a, Pairing with intracellular current pulse with onset at 15 msec after the command.Traces show corollary discharge responses before pairing (C before), during pairing with intracellular current pulse that evokes a burst of four spikes [C + intra (15 ms)], and after pairing for 3 min (C after). Note depression of corollary discharge-evoked EPSP. b, Pairing with intracellular current pulse with onset at 40 msec after the command.Traces show corollary discharge responses before pairing (C before), during pairing with intracellular current pulse [C + intra (40 ms)], and after pairing for 3 min (C after). The first trace shows that the corollary discharge response has not fully recovered 26 min after the pairing in a. Note that the effect of this second pairing is delayed with respect to the effects of the first pairing, and that a long-lasting hyperpolarization developed in the response to the corollary discharge that was roughly centered on the time of the previously paired burst of spikes. c, Corollary discharge response 14 min after previous pairing. The response has almost recovered to the level observed before the second pairing inb.
Fig. 10.
Fig. 10.
Large fusiform cells: corollary discharge and electrosensory responses. A, B, Corollary discharge-evoked IPSPs. Records from two different neurons. Each is shown at resting potential and at a hyperpolarized potential. Note that the IPSPs are inverted by hyperpolarization. C, Small depolarizations preceding electrosensory-evoked spike. Depolarizations indicated by arrowheads in inset (see Results). D, Responses to electrosensory stimuli in center and periphery of receptive field and interaction with corollary discharge (superimposed traces). Same neuron as inB. Left column, Stimuli to center of receptive field. Stimuli given independently of the command evoke small, slowly rising EPSPs, with a spike occurring on one of the EPSPs (top traces). The same stimuli given 5 msec after the command evoke short-latency, sharply rising EPSPs, with a burst of three or four spikes on each of the EPSPs (bottom traces). Right column, Stimuli to periphery of receptive field. Stimuli given independently of the command evoke small IPSPs (top traces). Same stimuli given 5 msec after the command evoke EPSPs and spikes. E, Drawing of the head of a fish showing location of points on the skin where electrosensory stimuli alone cause excitation and inhibition for a cell like that shown in D (−, inhibition; +, excitation).
Fig. 11.
Fig. 11.
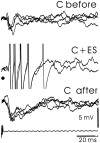
Large fusiform cell: corollary discharge plasticity after pairing with an electrosensory stimulus. C before, Corollary discharge evokes only a small IPSP before pairing. C + ES, Electrosensory stimulus evokes a burst of spikes when paired with the corollary discharge. C after, Corollary discharge evokes a much large IPSP after 2 min of pairing with an electrosensory stimulus.
Fig. 12.
Fig. 12.
I1-type cell: corollary discharge and electrosensory responses. A, Corollary discharge responses of I1 cell shown with raster display of spikes and superimposed intracellular traces. B, Corollary discharge enhancement of electrosensory IPSP in I1 cell.Top traces, Electrosensory stimuli at a delay of 70 msec after the command evoke small IPSPs. Bottom traces, The same stimuli at a delay of 3 msec evoke much larger IPSPs that reduces the size of the corollary discharge EPSP.
Fig. 13.
Fig. 13.
Summary figure showing the timing of corollary responses in ELL: intracellularly recorded cells and extracellularly recorded field potentials. E - LF, Corollary discharge responses of two large fusiform cells (E-cells). I3 - LG, Corollary discharge responses of two large ganglion cells (I3 cells). I2 - MG, Corollary discharge responses of a medium ganglion cell (I2 cell).I1 - ?, Corollary discharge response of I1 cell with unknown morphology. granule cell (primary afferent), Corollary discharge response recorded inside primary afferent that is attributable to synaptic input to granule cells. field potentials, Corollary discharge responses shown with extracellularly recorded field potentials in ganglion (ga) and granule (gr) layers. Arrow points to small deflection signaling arrival of juxtalobar input at ELL. Shaded bars show division of responses into shorter and longer latency events. The gains for the first five sets of traces, which are intracellular recordings, are given by the 5 mV vertical scale bar. The gains for the two bottom traces, which are extracellularly recorded field potentials, are given by the 1 mV vertical scale bar.

Similar articles

Cited by

References

    1. Bastian J. Gain control in the electrosensory system mediated by descending inputs to the electrosensory lateral line lobe. J Neurosci. 1986;6:553–562. - PMC - PubMed
    1. Bastian J. Pyramidal-cell plasticity in weakly electric fish: a mechanism for attenuating responses to reafferent electrosensory inputs. J Comp Physiol. 1995;176:63–78. - PubMed
    1. Bastian J. Plasticity in an electrosensory system. II. Postsynaptic events associated with a dynamic sensory filter. J Neurophysiol. 1996;76:2497–2507. - PubMed
    1. Bell CC. An efference copy modified by reafferent input. Science. 1981;214:450–453. - PubMed
    1. Bell CC. Properties of a modifiable efference copy in electric fish. J Neurophysiol. 1982;47:1043–1056. - PubMed

Publication types

Substances

LinkOut - more resources