. 1997 Aug 5;94(16):8421-6.
doi: 10.1073/pnas.94.16.8421.

A Z-DNA binding domain present in the human editing enzyme, double-stranded RNA adenosine deaminase

Affiliations

A Z-DNA binding domain present in the human editing enzyme, double-stranded RNA adenosine deaminase

A Herbert et al. Proc Natl Acad Sci U S A. .

Abstract

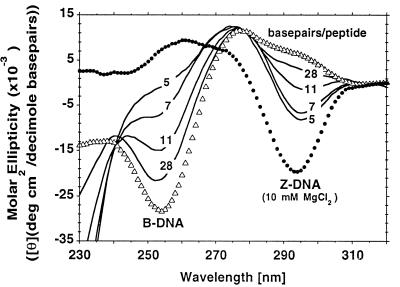
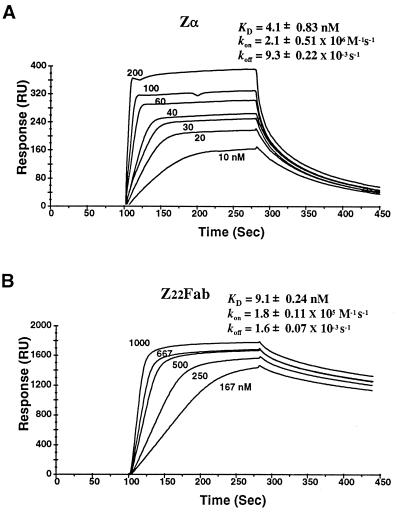
Editing of RNA changes the read-out of information from DNA by altering the nucleotide sequence of a transcript. One type of RNA editing found in all metazoans uses double-stranded RNA (dsRNA) as a substrate and results in the deamination of adenosine to give inosine, which is translated as guanosine. Editing thus allows variant proteins to be produced from a single pre-mRNA. A mechanism by which dsRNA substrates form is through pairing of intronic and exonic sequences before the removal of noncoding sequences by splicing. Here we report that the RNA editing enzyme, human dsRNA adenosine deaminase (DRADA1, or ADAR1) contains a domain (Zalpha) that binds specifically to the left-handed Z-DNA conformation with high affinity (KD = 4 nM). As formation of Z-DNA in vivo occurs 5' to, or behind, a moving RNA polymerase during transcription, recognition of Z-DNA by DRADA1 provides a plausible mechanism by which DRADA1 can be targeted to a nascent RNA so that editing occurs before splicing. Analysis of sequences related to Zalpha has allowed identification of motifs common to this class of nucleic acid binding domain.


Figures

Figure 1
Figure 1
Demonstration of Z-DNA specific binding by the Zα domain of DRADA1 in a bandshift assay using nondenaturing 6% polyacrylamide gel electrophoresis (19). All assays were performed in a final volume of 20 μl and contained purified Zα (5 ng), 1 μg of sonicated salmon sperm DNA, 10 mM MgCl2, 25 mM NaCl, 25 mM Tris⋅HCl (pH 7.4), and 100 pg of radiolabeled Z-DNA probe. (A) Specificity of Zα-binding to the probe was tested by competition with unlabeled B-form poly(dC-dG) (Pharmacia) (lanes 1–3) or unlabeled, chemically brominated Z-form poly(dC-dG) (20) (lanes 4–6) that were titrated in 5-fold dilution steps, starting at 35 ng (lanes 3 and 6). Lanes without added competitor are marked + while those without added Zα are labeled −. The two band shifts (arrows) arise from one or two complexes of Zα bound to the probe. (B) Unlabeled supercoiled plasmid pDHg16(21) also was used as competitor at bacterial superhelical density (lanes 4–6). This plasmid contains a (dC-dG)13 insert, which adopts the Z-DNA conformation under these conditions. Competition was compared with that of the parental plasmid pDPL6 (21), which has no Z-DNA forming insert under these conditions (lanes 1–3). Titrations were performed in 5-fold steps, starting at 500 ng of plasmid DNA (lanes 3 and 6). (C) A diagram of DRADA1 showing the locations of Zα (residues 121–197), Zβ, dsRNA binding motifs (DRBM 1–3), and the catalytic domain. Zβ is a second Z-DNA binding domain present in DRADA1 that currently is being analyzed.
Figure 2
Figure 2
CD spectra of poly(m5dC-dG) in the presence of increasing amounts of Zα peptide. The Zα peptide alone had no observable effect on spectra in the region of 250 to 320 nm, so spectra with DNA were not corrected for the presence of peptide. The spectra measured using Zα therefore contain a large negative peak present below 245 nm that is attributable to the peptide. Molar ellipticities were calculated using base pairs of DNA. Numbers next to each spectra (solid lines) reflect the molar ratio of base pairs to peptide. The spectra obtained with DNA alone (i.e., no added MgCl2) (B form) and DNA in the presence of 10 mM MgCl2 (Z form) are also shown for comparison.
Figure 3
Figure 3
Association and dissociation constants for interactions between Zα and Z-DNA polymer, compared with that of mAb Z22 Fab (22). The binding was determined using surface plasmon resonance (BIAcore, Pharmacia Biosensor) and are labeled in RU, or response units, which measure the mass bound to the surface of a sensor chip. The equilibrium constant KD for Zα (A) and Z22 Fab (B) are shown. The association rate (kon) was measured over a 180-s period, and the dissociation rate (koff) was over a 200-s time frame. Neither protein gave measurable association when a biotinylated 400-bp mixed sequence B-DNA fragment was attached to the sensor chip.
Figure 4
Figure 4
Sequence and structural analysis of the Zα and related domains. Human Zα and Zβ (hza, hzb, and HSU10439A), rat Zα and Zβ (rza, rzb, and RNU18942), bovine Zα and Zβ (bza, bzb, and this paper), two Zα-related sequences (xa1 and xa2) and two Zβ related sequences (xb1 and xb2) present in xenopus dsRAD1 and dsRAD2 (XLU88065 and XLU88066, respectively), the vaccinia E3L protein (S64006), and the variola equivalent (var, VVCGAA), as well as a mouse expressed sequence tag (AA204007) with relationship to Zα are shown. An HMM-generated alignment of sequences (29) is presented in A, with dots indicating gaps and blanks inserted to aid in viewing the data. Residues conserved in all sequences are shown in bold. (B) Common sequence motifs present in this group of sequences. These motifs were extracted using the meme program (30) and are presented as a multilevel consensus sequence. (C) Structural prediction for Zα made using the dsc program (31), which incorporate sequence variation at each position to improve accuracy. H is used to indicate predicted regions of helix, E for β-sheet residues, and C for coiled or loop elements. An alternative prediction made using the phd program also is shown (32). (D) Alignment between the cobbler (or composite) sequence of the blocks (33) that characterize the ICLR helix–turn–helix family (HTH_ICLR, BL01051A), the GNTR helix–turn–helix family (HTH_GNTR, BL00043), the CRP helix–turn–helix family (HTH_CRP, BL0042B), the DEOR helix–turn–helix family (HTH_DEOR, BL00894A), the LACI helix–turn–helix family (HTH_LACI), and the Zα group of related sequences (ZA_BLOCK). The ZA_BLOCK was generated after removal of the inserted R and P residues present in helix C of Zβ-related sequences, a move necessary to maintain alignment of other residues during analysis. The Z-scores indicate a high probability that the relationships revealed by lama (34) are true positive results. For the HTH families, sequences corresponding to the DNA binding region are capitalized.

Similar articles

Cited by

References

    1. Bass B L. In: The RNA World. Gesteland R F, Atkins J F, editors. Plainview, NY: Cold Spring Harbor Lab. Press; 1993. pp. 383–418.
    1. Verdoorn T A, Burnashev N, Monyer H, Seeburg P H, Sakmann B. Science. 1991;252:1715–1718. - PubMed
    1. Hume R I, Dingledine R, Heinemann S F. Science. 1991;253:1028–1031. - PubMed
    1. Sommer B, Kohler M, Sprengel R, Seeburg P H. Cell. 1991;67:11–19. - PubMed
    1. Kohler M, Burnashev N, Sakmann B, Seeburg P H. Neuron. 1993;10:491–500. - PubMed

Publication types