. 1997 Aug 5;94(16):8545-50.
doi: 10.1073/pnas.94.16.8545.

Ultrafast signals in protein folding and the polypeptide contracted state

Affiliations

Ultrafast signals in protein folding and the polypeptide contracted state

T R Sosnick et al. Proc Natl Acad Sci U S A. .

Abstract

To test the significance of ultrafast protein folding signals (<<1 msec), we studied cytochrome c (Cyt c) and two Cyt c fragments with major C-terminal segments deleted. The fragments remain unfolded under all conditions and so could be used to define the unfolded baselines for protein fluorescence and circular dichroism (CD) as a function of denaturant concentration. When diluted from high to low denaturant in kinetic folding experiments, the fragments readjust to their new baseline values in a "burst phase" within the mixing dead time. The fragment burst phase reflects a contraction of the polypeptide from a more extended unfolded condition at high denaturant to a more contracted unfolded condition in the poorer, low denaturant solvent. Holo Cyt c exhibits fluorescence and CD burst phase signals that are essentially identical to the fragment signals over the whole range of final denaturant concentrations, evidently reflecting the same solvent-dependent, relatively nonspecific contraction and not the formation of a specific folding intermediate. The significance of fast folding signals in Cyt c and other proteins is discussed in relation to the hypothesis of an initial rate-limiting search-nucleation-collapse step in protein folding [Sosnick, T. R., Mayne, L. & Englander, S. W. (1996) Proteins Struct. Funct. Genet. 24, 413-426].


Figures

Figure 1
Figure 1
The fragment preparations. Traces from matrix-assisted laser desorption ionization mass spectrometry showing the holoprotein (Top), the F1–80 preparation with a minor native-like contaminant (Middle), and the F1–65 preparation (Bottom). For each species, z on the m/z axis is 1, 2, and 3 from right to left.
Figure 2
Figure 2
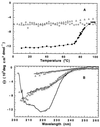
Ellipticity of the fragments (▵, F1–80; ⋄, F1–65), and holo Cyt c (• and/or —). (A) Ellipticity (222 nm) as a function of temperature. (B) CD spectra: native Cyt c (Bottom); the fragments at 22°C and Cyt c thermally denatured at 97°C (Middle); Cyt c and F1–80 in 4.4 M GdmCl (Top).
Figure 3
Figure 3
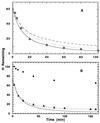
H-T exchange of the fragments. (A) Measured data for F1–65 (◊) and the curve predicted for an unprotected polypeptide with the same amino acid sequence (—). Predicted curves are also shown for the fragment with 20% of its NHs blocked by H-bonding (— — —), and for all the NHs time-sharing 20% of H-bonding (· · ·). (B) Measured data for F1–80 (▵) compared with the random coil prediction (—) and for a random coil preparation with 10% contamination by Cyt c (- - -; 0.9× random coil curve plus 0.1× Cyt c curve). HX of Cyt c at the same condition is shown (•). See Materials and Methods for details.
Figure 4
Figure 4
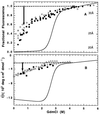
The unfolded baseline and the Cyt c burst phase. The solid curves show the equilibrium behavior of Cyt c. The equilibrium fluorescence and CD of the (unfolded) fragments (▵ and ◊) match the unfolded holo Cyt c baseline at high GdmCl and define the continuation of the unfolded baseline to lower GdmCl concentrations. The horizontal dashed line shows the initial fluorescence and CD in the stopped-flow experiments (4.3 M GdmCl). The solid symbols indicate the fluorescence (A) and the ellipticity (B; 222 nm) reached by holo Cyt c in the burst phase upon dilution into lower (or higher) GdmCl, as suggested by the arrows (compare Fig. 5) [starting from either pH 2 (•) or pH 4.9 (▪)]. These comparisons are made on an absolute, per molecule basis. Förster-averaged distance (Trp-59 to heme) is at the right of A.
Figure 5
Figure 5
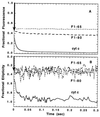
Kinetic refolding measured by fluorescence (A) and ellipticity (B; 222 nm). The arrows indicate the fast burst phase change on dilution from 4.3 M GdmCl to 0.7 M GdmCl (pH 4.9, 10°C).

Similar articles

Cited by

References

    1. Roder H, Colon W. Curr Opin Struct Biol. 1997;7:15–28. - PubMed
    1. Sosnick T R, Mayne L, Englander S W. Proteins Struct Funct Genet. 1996;24:413–426. - PubMed
    1. Sosnick T R, Mayne L, Hiller R, Englander S W. Nat Struct Biol. 1994;1:149–156. - PubMed
    1. Gross E. Methods Enzymol. 1967;11:238–255.
    1. Englander, S. W. & Englander, J. J. (1972) Methods Enzymol. 406–413. - PubMed

Publication types

LinkOut - more resources