. 1997 Aug 5;94(16):8618-21.
doi: 10.1073/pnas.94.16.8618.

Ultraviolet plumage colors predict mate preferences in starlings

Affiliations

Ultraviolet plumage colors predict mate preferences in starlings

A T Bennett et al. Proc Natl Acad Sci U S A. .

Abstract

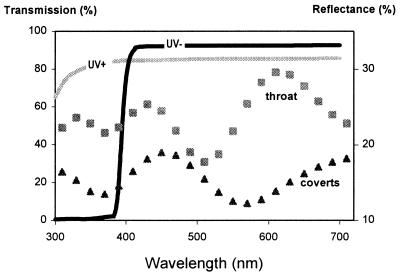
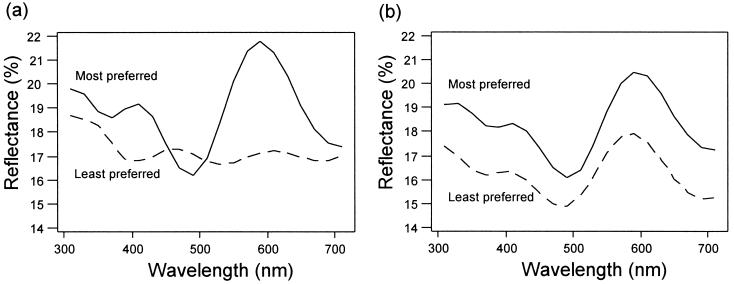
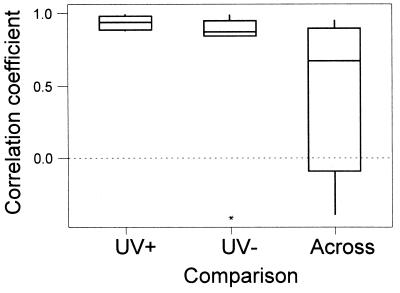
Avian plumage has long been used to test theories of sexual selection, with humans assessing the colors. However, many birds see in the ultraviolet (<400 nm), to which humans are blind. Consequently, it is important to know whether natural variation in UV reflectance from plumage functions in sexual signaling. We show that female starlings rank males differently when UV wavelengths are present or absent. Principal component analysis of approximately 1300 reflectance spectra (300-700 nm) taken from sexually dimorphic plumage regions of males predicted preference under the UV+ treatment. Under UV- conditions, females ranked males in a different and nonrandom order, but plumage reflectance in the human visible spectrum did not predict choice. Natural variation in UV reflectance is thus important in avian mate assessment, and the prevailing light environment can have profound effects on observed mating preferences.


Figures

Figure 1
Figure 1
Left axis and solid lines, transmission spectra of the two filter types (UV+, UV−) used in the experiment. Spectra are the mean of five randomly located measurements on each filter taken with a Unicam Prism spectrophotometer. The two filter types were equalized for transmitted quantal flux (<1% difference in flux 300–700 nm) as measured for the spectral irradiance on a female viewing empty stimulus cages, with lights as described earlier (6). In this way, any preference for UV+ or UV− is unlikely to be a preference for higher or lower quantal flux. A hyper-Graeco Latin square design (10) was used to allocate individual filters to stimulus cages, stimulus cages to positions in the room, and males to individual filters; order of treatment was randomized in a balanced way. Right axis and dotted lines, reflectance spectra of iridescent feathers on two body regions (throat and wing coverts) of male starlings. Spectra are the mean of the 32 bird means taken across 10 randomly located measurements within each body region and are plotted at 20-nm intervals. Measurement details in legend of Fig. 3.
Figure 3
Figure 3
Reflectance spectra of the iridescent throat feathers of the most preferred and least preferred males under (a) UV+ conditions and (b) UV− conditions. Each spectrum is the mean of the bird means for the eight respective males, calculated from 10 randomly located measurements on the iridescent throat feathers. All feathers were removed without cutting any innervated tissue, by snipping slightly above the base of the feather. Reflectances from these feathers were measured using a Zeiss MCS 230 diode array photometer, with illumination by a Zeiss CLX 111 Xenon lamp. Illumination and measuring fiber optics were held at 45° to the normal by a Zeiss GK 111 goniometer, with illumination from the proximal end of the feather. Spectra were recorded in 1-nm steps from 300 to 700 nm and were expressed relative to a Spectralon 99% white standard. All feathers were mounted on black velvet during measurement to eliminate stray reflections. Each measurement was taken from a 2-mm diameter spot, randomly chosen from within a uniform region of the exposed part of the main body of the feather. Because many feathers also had white or pale brown tips, most feathers were measured twice. To minimize measurement error, a dark current and reference calibration were taken immediately before measuring each feather. Within feathers, regions were randomly allocated for spectrophotometric measurements over time, and feathers from each individual were allocated over time in a randomized block design.
Figure 2
Figure 2
The similarity of preference of each pair of females for each of the four males within a quartet was assessed by Pearson correlation on the numbers of hops facing each male (actual durations show the same pattern). Whether any one pair of females shows a significant correlation is not of as much interest as whether females on average show consistent similarities of preferences. Thus, Wilcoxon one-sample tests (15) were used to compare if average correlation coefficients across pairs of females differed from 0; Friedman’s test (15) was used to see if the median correlation coefficients differed across treatments. Nonparametric tests were used because it was not possible to normalize the residuals. Correlation coefficients for similarity of preference are presented separately for (i) females of a pair under UV+, (ii) females of a pair under UV−, and (iii) females of a pair across viewing conditions. In the latter case, there are two possible sets of comparisons (i.e., correlating the UV− preferences of female A with the UV+ preferences of female B, and vice versa), so the mean of these two correlations (per pair of females) are graphed. Indicated are medians ± the interquartile range. ∗, an outlier in one of eight pairs, but results remain robust because rank orders are used for treatment comparisons. Similarity of preference differed significantly across the three types of comparison [UV−, UV+, across treatments; Friedman’s test, S = 9.0; df = 2; P = 0.011; multiple comparisons (15): within UV+ > within UV− > across treatments]. Under UV+ conditions, preferences of pairs of females were highly correlated (mean r = 0.94, median r = 0.94, W = 36, n = 8, P = 0.014). They also were highly correlated under UV− conditions, although less so than under UV+ conditions (mean r = 0.74, median r = 0.87, W = 35, n = 7, P = 0.021). Preferences across UV+ and UV− treatments were not correlated (for the two possible comparisons it is arbitrary which female is designated A and B; using Monte Carlo simulation to select one female as A and one as B from each pair, the median P = 0.080 from 1000 randomly selected sets of eight).

References

    1. Darwin C. The Descent of Man and Selection in Relation to Sex. London: Murray; 1871.
    1. Andersson M. Sexual Selection. Princeton, NJ: Princeton Univ. Press; 1996.
    1. Bennett A T D, Cuthill I C, Norris K J. Am Nat. 1994;144:848–860.
    1. Bennett A T D, Cuthill I C. Vision Res. 1994;34:1471–1478. - PubMed
    1. Partridge J C. J Comp Physiol A. 1989;165:415–426.

Publication types

LinkOut - more resources